

Abstract
Deletions within the mitochondrial DNA (mtDNA) cause Kearns Sayre Syndrome (KSS) and Chronic Progressive External Opthalmoplegia (CPEO). The clinical signs of KSS include muscle weakness, heart block, pigmentary retinopathy, ataxia, deafness, short stature, and dementia. The identical deletions occur and rise exponentially as humans age, particularly in substantia nigra. Deletions at >30% concentration cause deficits in basic bioenergetic parameters, including membrane potential and ATP synthesis, but it is poorly understood how these alterations cause the pathologies observed in patients. To better understand the consequences of mtDNA deletions, we microarrayed 6 cell types containing mtDNA deletions from KSS and CPEO patients. There was a prominent inhibition of transcripts encoding ubiquitin-mediated proteasome activity, and a prominent induction of transcripts involved in the AMP kinase pathway, macroautophagy, and amino acid degradation. In mutant cells, we confirmed a decrease in proteasome biochemical activity, significantly lower concentration of several amino acids, and induction of an autophagic transcript. An interpretation consistent with the data is that mtDNA deletions increase protein damage, inhibit the ubiquitin-proteasome system, decrease amino acid salvage, and activate autophagy. This provides a novel pathophysiological mechanism for these diseases, and suggests potential therapeutic strategies.
Introduction
Mitochondrial deletions cause KSS, CPEO, and PS
Mitochondrial DNA deletions (ΔmtDNA), when present at concentrations of 30% and greater in muscle tissue, can cause three disorders, Kearns-Sayre Syndrome (KSS), Chronic Progressive External Opthalmoplegia (CPEO), and Pearson's Syndrome (PS) [1-3]. Clinical signs include muscle weakness, exercise intolerance, droopy eyelids and weakness of ocular muscles (CPEO), plus heart block, pigmentary retinopathy, ataxia, deafness, and dementia (KSS), and sideroblastic anemia (PS).
Diagnosis is usually confirmed by muscle histochemistry, showing ragged red fibers, and mosaic cytochrome oxidase negativity.
Deletions vary in size (1.3-8 kb) and position within the mitochondrial genome and occur with higher frequency at direct repeats [4, 5]. The amount of the deleted mtDNA is the most important determinant of clinical severity, the size and location of deletion are not [6-8].
Origin of mtDNA deletions is twofold
mtDNA deletions are acquired through two main mechanisms. Single, sporadic deletions of mtDNA are thought to occur somatically early in development, as spontaneous errors of the gamma polymerase, and the identical deletion is observed in multiple tissues [9]. Alternatively, patients may inherit nuclear ‘mutator’ alleles in the germline of the mitochondrial polymerase gamma, the mitochondrial helicase twinkle, and the adenine nucleotide translocator, which promote multiple mtDNA deletions of various lengths and cause mendelian disorders dominated by CPEO [10-12].
mtDNA deletions also occur spontaneously and rise exponentially with normal aging
Deletions also occur and accumulate exponentially with human age, particularly in non-mitotic tissues [13]. Although in most tissues the level of mtDNA deletions is in the aged is less than 5% of the total, levels reach 5% in some aged muscles, and 50% in aged substantia nigra [14-18]. These deletions occur as spontaneous errors in individual cells as a consequence of age, and rise in concentration over time, with each cell containing a different predominant deletion species. Age-dependent mtDNA deletions have also been correlated with respiratory chain defects in muscle and substantia nigra [19-24].
The pathogenetic mechanism of KSS and CPEO is unclear
Although the occurrence of mitochondrial deletions was first documented in 1988 [1], and several experiments have shown that ‘thresholds’ of 30% (in patients) and 60 % (in HeLa cells) have to be surpassed for a biochemical effect to become evident [25, 26], it is still uncertain how mitochondrial deletions trigger the pathophysiological cascade; even with the advent of a mouse model [27, 28], the pathogenetic mechanism of KSS/CPEO is still unclear.
The two main pathophysiological mechanisms proposed for the occurrence of the CPEO/KSS/PS phenotypes involve a decline in mitochondrial bioenergetics [26] plus an increased production of reactive oxygen species (ROS), which may reinforce the bioenergetic defect through oxidative damage to DNA, proteins, and lipids [29-33].
However, in addition to their well-known role in respiration and oxidative phosphorylation, mitochondria are also sites for mitochondrial protein synthesis, and for such diverse cellular functions as apoptosis, heme, urea and amino acid biosynthesis, ion homeostasis, and fatty acid oxidation, all of which might be involved in the pathophysiological mechanism [34-37].
In order to clarify the cellular response to mtDNA deletions, we investigated by oligonucleotide microarray the global gene expression profile of nuclear encoded genes in muscle biopsies, myoblasts, fibroblasts, and lymphoblast cell lines from controls and patients with CPEO or KSS. We also investigated transmitochondrial cybrids with preneuronal NT2 or 143B osteosarcoma nuclear background and harboring different mtDNA deletions. The significance of the mechanisms suggested by the microarray data is discussed.
Materials and Methods
Cell lines and Culture conditions
We studied different cell types coming from patients harbouring a single 4.9 kb mtDNA deletion and from age and sex matched healthy subjects. Muscle cells were snapfrozen and kept at −80°C until RNA isolation. Fibroblasts were cultured in Dulbecco's modified Eagle's medium (Invitrogen, Carlsbad, CA) supplemented with 10% fetal bovine serum (FBS), 100 mM pyruvate, 5mg/ml uridine and 50 mg/ml gentamycin. Lymphoblasts were grown in RPMI-1640 medium (Life Technologies) supplemented with 15% FBS, 50mm sodium pyruvate, 0.5 mM uridine, 100 U/ml penicilin and 100 ug/ml streptomycin. Myoblasts were cultured in skeletal muscle basal medium (SkBM) supplemented with hEGF, 10% FBS and L-glutamine (Cambrex Bio Science Walkersville, Inc.). Transmitochondrial cybrids containing either NT2 or 143B osteosarcoma nuclear backgrounds were created as previously described [38]. Briefly, enucleation of mitochondria donor cells (lymphoblasts for NT2 cybrids and fibroblasts 143B cybrids) were carried out using the treatment of 15X10^6 cells with 10 ug/ml Cytochalasin-B for one hour at 37° C. Enucleated cells were mixed with mitochondrial-depleted cells (NT2 rho-zero and 143B rho-zero) and then treated with 0.2 ml 40% Poly Ethylene Glycol (PEG) for 45 seconds, suspended in DMEM media and plated. Two weeks later the visible colonies were expanded and checked for mtDNA deletion and nuclear background with at least three microsatellites. In order to exclude fusion specific effects on gene transcriptions, we used fusion control cell lines (FC) created by fusing rho-zero cells with mitochondria donor cells (lymphoblasts and fibroblasts, for NT2 and 143B cybrids respectively) bearing mtDNA with no disease-related mutations. 2 NT2 control cybrids and three 143B control cybrids (HGA13, HPC7 and H1959, kindly provided by A. Martinuzzi) were utilized, as described elsewhere [39]. 2 NT2 mutant cybrids harbouriong the 4.9 kb ‘common deletion’, 3 143B mutant cybrids harbouring the 4.9 kb deletion (14.6, 51-18 kind gifts of Y.H. Wei and BH.10.59 from C. Moraes), 2 143B mutant cybrids harbouring a 7.5 kb deletion (16.3 and ΔH.2.1 kind gifts from C. Moraes) and one 143B rho-zero cell line (kindly donated by M. Zeviani) were used. All cybrid cell lines were cultured in DMEM supplemented with 10% FBS, 1 mM sodium pyruvate, 0.1 mM uridine, 100 U/ml penicillin and 100ug/ml streptomycin. Parental osteosarcoma 143B cells (1 line purchased from ATCC and 1 line kind gift from G. Attardi) were cultured in the same medium. All the cultured cells were kept in a humidified atmosphere containing 5% CO2 at 37° C and frequently tested for mycoplasma infection using the mycosensor PCR testing protocol (Stratagene).
Oligonucleotide Microarray Analysis
Microarray analysis was performed as previously described [40]. Briefly, Total RNA was isolated from cell lines and frozen muscle tissues using a Quiagen RNeasy mini kit (Valencia, CA). Double-stranded cDNA was synthesized from 10μg of purified total RNA using the SuperScript Choice System (Invitrogen, Gaithersburg, MD) and T7-(dt)24 primer (Genset, La Jolla, CA). The cRNA was prepared and biotin-labeled using the cDNA as a template for an in vitro transcription (ENZO Farmingdale, NY). The labeled cRNA was randomly fragmentated by heating at 95 °C for 35 minutes in a fragmentation buffer (40mM Tris Acetate, PH8.1, 100mM potassium acetate, and 30mM magnesium acetate) prior to hybridization to the chips. The chips were then washed, stained with avidin-labelled phycoerytherin and scanned with an Affymetrix GeneChip scanner. Raw data were processed by Microarray Suite 4.0 (Affymetrix) and microarray data files analyzed using DNA-chip Analyzer (dChip) software [41].
54 Affymetrix Hu95Av2GeneChips (Affymetrix, Santa Clara, CA) were utilized: 11 for muscle biopsies (7 patients and 4 controls), 4 for lymphoblasts (2 patients and 2 controls), 7 for fibroblasts (4 patients and 3 controls), 6 for NT2 cybrids (2 mutants in duplicate and 2 fusion controls), 9 for 143B cybrids (2 mutants with 5kb deletion in duplicate, 2 mutants with 7.5kb deletion in duplicate and 3 fusion controls, two of them in duplicate) and 8 for 143B cells (2 for 143B rho zero and 6 for 2 parental 143B cell lines in triplicate). Differentially expressed genes were identified by comparing GeneChips designated as baseline (muscles, myoblasts, fibroblasts and lymphoblasts from healthy subjects, fusion control cell lines and parental 143B cells) with the ones that represent the experimental parameters (muscles, myoblasts, fibroblasts and lymphoblasts from patients, mutant cybrids and 143B rho zero cells) using a difference in mean fluorescence ≥30 and a p value <0.05 (Table 1). To determine whether the significant altered genes deviated from random expectation with respect to biochemical pathway, cellular compartment or molecular function, we used the program Onto-Express (OE) [42].
Table 1.
Summary of basic microarray statistics.
| Cell types | Chips number | Mutants vs Controls | # Unique altered genes |
|---|---|---|---|
| Differentiated muscles | 11 | 7/4 | 499 |
| Myoblasts | 4 | 2/2 | 1417 |
| Fibroblasts | 7 | 4/3 | 1309 |
| Lymphoblasts | 5 | 2/3 | 1988 |
| +NT2 cybrids | 6 | 4/2 | 2444 |
| 143B cybrids | 13 | 8/5 | 2077 |
| 143B rho-zero | 8 | 2/6 | 2413 |
| Tot | 54 | 29/25 | 3661 |
Quantitative Real Time Reverse Transcriptase PCR (QRT-PCR)
The same total RNA utilized for microarray analysis was used to create cDNA for quantitative RT-PCR examination of 6 selected genes. Superscript reverse transcriptase II (Invitrogen, Gaithersburg, MD) was used and PCR was performed with Roche LightCycler (Roche Diagnostic, Indianapolis, IN), annealing at 58°C for 5 s and extension at 72°C for 15 s for 40 cycles. Samples were quantified by generating a standard curve of a synthesized target from the control cell lines. Each sample was run in triplicates and normalized to beta-actin expression.
Immunoblot and ELISA assays Immunoblot assay
The cell lysis buffer used for preparing total cell extracts was a modified RIPA buffer (50 mM Tris pH 7.4, 100 mM NaCl, 10mM EDTA, 1mM PMSF, 1% IGEPAL) supplemented with complete protease inhibitor cocktail (Sigma, St. Louis, MO) added just before use. Cells were washed twice with PBS and lysed for 30 min at 4°C. The homogenate was centrifuged for 30 minutes at 16.000 × g and the supernatants were saved for immunoblot. Equal quantities of proteins, as determined by Bradford protein assay, were separated by electrophoresis in a 4-20% SDS-polyacrylamide gel (BioRad, Hercules, CA). Anti-syntaxin 16 (rabbit antiserum, Synaptic System) and anti-beta-actin (mouse monoclonal, Sigma) were used as primary antibodies with the suitable HRP-conjugated secondary antibodies. Bound antibodies on nitrocellulose (Amersham Biosciences) membranes were detected using the chemiluminescent substrate ECL (Amersham Biosciences). Densitometry analysis was performed using Quantity One software (Bio-Rad).
Measurement of proteasome activity
Quantitative in vitro analysis of 20S proteasome activity was performed by measuring the hydrolysis of the fluorogenic peptidyl substrate Suc-Leu-Leu-Val-Tyr-AMC (Calbiochem, La Jolla CA). Testing was assayed in 143B mutant cybrids with 7.5 kb mtDNA deletions and 143B fusion controls as well as in patient-derived lymphoblast cell lines harbouring a single 4.9 kb mtDNA deletion and lymphoblasts from age and sex matched healthy subjects. Low concentrations of sodium dodecyl sulfate (SDS) were added in order to induce conformational changes allowing access to the central cavity where the active sites residues reside. Briefly, approximately 3 million of cells were lysated and incubated for 1hr at 37°C in 500mM HEPS pH 7.6, 10 mM EDTA, 3% SDS and 200uM of the substrate suc-Leu-Leu-Val-Tyr-AMC. The substrate, cleaved by the chymotrypticlike activity of the proteasome, released free AMC (7-amino-4-methylcoumarin) which was detected using a fluorimeter (Ex380nm; Em460 nm). A standard curve was generated using AMC. Results are presented as fluorescence over time (nM/ mg protein/ 60 min).
Amino Acid Analysis (AAA)
Lymphoblast cell lines from patients and controls were used. The samples were acidified with sulfosalicyclic acid (SSA, 3% final concentration) to precipitate any intact protein prior to analysis and centrifuged at 14000 rpm for 15 min at 4 °C. AAA in the supernatants was performed using Beckman 6300 amino acid analyzer (Beckman Instruments, Inc., Palo Alto, CA, U.S.A) which utilize a lithium citrate buffer system [43]. Amino acids separation by ion-exchange chromatography was followed by a “post-column” ninhydrin reaction detection system. The standard injection volume was 50.0ul. Aminoethylcysteine (AEcys) was used as internal standards to correct for any variation in the operating conditions of the analyser over time. A data file comprised of a series of absorbance values vs. time points was generated during each chromatographic run. The values corresponding to the mutant samples were compared to the control ones; fold changes and p values between the two groups are presented in Table 6.
Table 6.
Altered cytoplasmic amino acids in mutant lymphoblast cell lines
| Amino acid | Fold Change | P value |
|---|---|---|
| Standard amino acids | ||
| Alanine | −2.5 | 0.00004 |
| Asparagine | −1.7 | 0.005 |
| Aspartate | 1.4 | 0.05 |
| Glutamine | −1.3 | 0.05 |
| Glycine | −1.8 | 0.002 |
| Histidine | −1.9 | 0.001 |
| Isoleucine | −1.7 | 0.003 |
| Leucine | −1.7 | 0.006 |
| Methionine | −1.9 | 0.002 |
| Phenylalanine | −1.8 | 0.0006 |
| Proline | −1.4 | 0.02 |
| Serine | −3 | 0.0002 |
| Threonine | −2.7 | 0.05 |
| Tryptophan | −1.9 | 0.004 |
| Tyrosine | −2 | 0.0007 |
| Valine | −1.8 | 0.004 |
| Nonstandard amino acids | ||
| Citrulline | −6.1 | 0.001 |
| G-aminobutyric acid | −4.2 | 0.002 |
| Methylhistidine | −1.9 | 0.0005 |
| Ornithine | −2.3 | 0.002 |
| Phosphoethanolamine | −2.2 | 0.02 |
Statistical analysis
Data are expressed as mean and standard deviation (SD). Comparisons between groups were performed by two-tailed Unpaired Student's t test. P values of <0.05 were considered statistically significant. Data were analyzed using GraphPad-Prism software (Prism 4.0, GraphPad Software, Inc.).
Results
Several transcriptional consequences of deletions are significantly shared
Complementary RNA (cRNA) was prepared from 54 samples, labeled and microarrayed on 54 chips. Cell types included differentiated muscle, myoblasts, fibroblasts, lymphoblasts, NT2 cybrids, and 143B osteosarcoma cybrids (Table 1). We also compared the results with those obtained with 143B osteosarcoma rho-zero cells, which lack mtDNA completely, as the transcriptional consequences were similar to those observed in 143B cybrids bearing mtDNA deletions.
To identify the most consistent consequences of mtDNA deletions across cell types, we looked for transcripts that were significantly different at the p ≤ 0.10 criterion in each of the seven experiments of mutants and controls. Thus, the combined probability for observing the same gene altered in the same direction across N experiments is: {(0.10)(0.5)}N. For example, the nominal p-value for a single transcript to be shared among 4 experiments at the p≥0.10 criterion in the same direction is (0.05)4, i.e. p ≤ 0.0000063, p ≤ 6.3 × 10⁻⁶ [44].
mtDNA deletions cause transcriptional inhibition
Several transcripts were non-randomly shared among experiments (Table 2). In addition, mtDNA deletions caused about twice as many shared downregulated than upregulated transcripts. For example, 38 transcripts were shared and downregulated vs 17 shared and upregulated among 5 experiments, 230 down vs 109 up among 4 experiments, and 983 down vs 684 up among 3 experiments. Thus, it is clear from the most consistently altered transcripts that in cells harboring mitochondrial deletions there are more nuclear gene inhibitions than activations by a ratio of approximately 2:1, when similar categories are compared.
Table 2.
Transcriptional results shared among experiments
| Transcripts shared among experiments |
≥3 | ≥4 | ≥5 | ≥6 |
|---|---|---|---|---|
| Down-regulated | 983 | 230 | 38 | 8 |
| Up-regulated | 684 | 109 | 17 | 0 |
| Individual P value | 0.00012 | 6.3 × 10⁻⁶ | 3 × 10⁻⁷ | 1.6 x 10⁻⁸ |
Pathway analysis shows inhibition of ubiquitin-proteasome and mitochondrial transcripts
The Onto-Express bioprocess program objectively reveals the predominance of particular biochemical pathways in microarray data [42]. Using lists encompassing the broadest and most consistent consequences of mtDNA deletions (i.e. genes significantly altered in the same direction across 4 experiments), we analyzed the pathways emphasized by the bioprocess function of Onto-Express (Table 3).
Table 3.
Onto-Express analysis of pathways affected by mtDNA deletions
| Function Name |
Unique altered genes |
Total unique genes |
P-Value |
|---|---|---|---|
| Downregulated bioprocesses | |||
| ubiquitin cycle | 11 | 116 | 3.46E-04 |
| ubiquitin-dependent protein catabolism | 8 | 74 | 7.17E-04 |
| transcription from RNA polymerase II promoter | 11 | 159 | 0.005158 |
| ATP synthesis coupled proton transport | 4 | 28 | 0.005166 |
| regulation of transcription | 6 | 50 | 0.005441 |
| regulation of translational initiation | 3 | 23 | 0.006789 |
| vesicle-mediated transport | 4 | 39 | 0.007359 |
| Upregulated bioprocesses | |||
| intra-Golgi transport | 3 | 17 | 4.33E-04 |
| intracellular signaling cascade | 9 | 227 | 0.003112 |
| regulation of cell growth | 4 | 60 | 0.003343 |
| cell surface receptor linked signal transduction | 6 | 120 | 0.003429 |
| regulation of transcription from RNA polymerase II promoter |
6 | 151 | 0.007731 |
| cell cycle arrest | 3 | 50 | 0.007767 |
| negative regulation of cell proliferation | 5 | 117 | 0.009219 |
Onto-Express identified the following pathways as significantly inhibited: ubiquitin-proteasome (corrected p value <0.0007), mitochondrial ATP synthesis (p<0.006), and initiation of protein synthesis (p<0.007). By contrast, intra-Golgi transport, cell cycle arrest, and negative regulation of cell proliferation were significantly activated.
Negative transcriptional consequences of mtDNA deletions: proteasomal, mitochondrial, synthetic, and muscle-specific genes
Of the transcripts shared and downregulated in cells harboring mtDNA deletions in ≥3 experiments, four prominent clusters were evident by inspection, three of which had been previously identified by the Onto-Express analysis. First, many members of the ubiquitin-proteasomal complex were downregulated, including the proteasome (PSMB6, PSME3, PSMB4, PSMF1, PSMB2), and the ubiquitin ligase (UBE2E3,UBE2E1,UBE2L6, UBE2I, UBE3B, USP7, USP10, USP22, USP15, USP33, UBR2, CAND2) systems. Thus, mtDNA deletions cause a strong and significant inhibition of many transcripts involved in ubiquitin proteasome activity.
Second, and also consistent with the Onto-express results, many mitochondrially targeted transcripts were inhibited, including those that encode subunits of Complex I, NADH dehydrogenase (NDUFA5, NDUFA6, NDUFAF1, NDUFB3, NDUFS3, NDUFV2), Complex II (SDHC, SDHB), genes involved in the assembly of Complex IV (SURF1,SURF2), and Complex V (ATP5G2, ATP5H, ATP5J2), TCA cycle genes (DLD, SLC25A1, ACO2, IDH3G), mitochondrial ribosomal genes (IARS2, MRPL28, MRPS18B, MRPL23), and a mitochondrial antioxidant gene (SOD2). Thus, mtDNA deletions result in inhibition of nuclear-encoded, mitochondrial-targeted proteins.
mtDNA deletions activate SNARE genes, stress genes, MYC and amino acid degradation transcripts
We inspected the lists of genes shared and activated in ≥3 experiments, searching for functional clusters. In agreement with the Onto-Express analysis, several SNARE genes involved in intra-Golgi and vesicular transport and were induced in mutants, including syntaxin 16, (STX16, TGOLN2, ARHGEF, GOLGA8A, RAFTLIN, VAPB, ATP6V0E2L, VPS13A), suggesting an increase in vesicular activity. As discussed further below, these
Multiple stress-related genes of different categories were also induced in 3 or more experiments, including genes involved in the unfolded protein stress response (PERK, HSPA4, DNAJC3, and DNAJC4). Stress genes related to energy depletion were also induced in mutants (PRKAA, AMPK, ATG12, GATM), as were hypoxia-responsive genes (UGCG, ADM, STC2). ADM and STC2 are each targets of Hif1alpha, which was significantly induced in two experiments. Stress genes related to nonsense-mediated decay (SMG1, DICER1) were also induced. These results suggest increased stress in general in cells with mitochondrial deletions, including unfolded protein stress, energy depletion stress, and hypoxic stress. The stress category was not flagged by Onto-Express, probably because these sets of genes belong to separate stress pathways.
The MYC gene was also induced in mutants. MYC, which has recently been shown to serve as a transcription factor for mitochondrial biogenesis, responds to mitochondrial functional depletion [40, 44-47].
Several transcripts encoding enzymes that degrade amino acids were also induced, including GCAT, METAP2, GLS, AASS, LOX. This suggests an increase in amino acid scavenging.
Decreased proteasome activity in mutant cells
Because the ubiquitin-proteasome pathway was significantly downregulated by the Onto-Express analysis, and was also obvious by inspection of the inhibited gene lists, we first confirmed the downregulation at the RNA level by measuring the proteasomal catalytic 26S subunit through quantitative rt-PCR (Figure 1). We then carried out a functional analysis of proteasome activity in 143B osteosarcoma cybrids harboring a 7.5 kb deletion and in lymphoblasts from patients carrying a 5 kb mtDNA deletion (Figure 2). In agreement with microarray results, we observed decreased proteasomal activity in both mutant cell types.
Figure 1.

Quantitative rt-PCR validation of microarray data.
Fold changes of 4 selected genes obtained by microarray analysis and by quantitative rt-PCR are shown. QRT-PCR results were normalized to beta-actin expression. Significant differences from the control groups: * unpaired t test, p<0.05, ** unpaired t test, p<0.005.
Figure 2.

Measurement of proteasome activity in 143B cybrids and lymphoblasts.
In vitro assessment of 20S proteasome activity was done by measuring the hydrolysis of the fluorogenic peptidyl substrate Suc-Leu-Leu-Val-Tyr-AMC by the SDS-activated proteasome. (A) Average activity in three 143B fusion controls and two osteosarcoma cybrids 3.6 and 16.3 with 70% of 7,5 kb mtDNA deletions. (B) Average activity in lymphoblast cell lines from three control subjects, and two patient cell lines, (848) with 57% of 4,9 kb mtDNA deletion and (63358) with 27% of 7,4 kb mtDNA deletion. C, control cells; M, mutant cells. Error bars represent SEM. * Unpaired t test, p<0.02.
Amino acid concentration is deficient in mutant lymphoblasts
Proteasome activity is both important for normal degradation of proteins and for providing a substantial fraction of amino acids required for protein synthesis [48]. We compared amino acid concentration in two sets of lymphoblast cells harboring 5 kb and 7.5 kb mtDNA deletions and in control lymphoblasts, and found that 15 out of 20 standard amino acids tested were significantly decreased while one (aspartate) was only mildly increased. In addition, five nonstandard amino acids were also less in mutant lymphoblasts than in controls. All decreased acids are shown in Table 6.
Induction of the autophagy 12 transcript is a specific consequence of mtDNA deletions
The ATG12 transcript encodes the first and most important product of the autophagy pathway [49, 50], and was induced in the microarray data from fibroblasts, lymphoblasts, and myoblasts from KSS patients, and in NT2 neural cells bearing deletions. As depletion of steady-state concentrations of amino acids is known to induce autophagy [51, 52], the induction of ATG12 could relate to the significant decreases in several amino acids that we observed in the mutant cells. To determine whether the induction of ATG12 was a specific consequence of mtDNA deletions, we quantified ATG12 transcript levels in 143B osteosarcoma cybrid fusion controls (i.e. cell lines that had gone through the process of cybridization but with normal mtDNA), in osteosarcoma cybrids harboring deletions, and in osteosarcoma cell lines lacking the mitochondrial genome (Figure 3). The ATG12 transcript levels were highly correlated with the presence of deletions, were significantly higher in cells bearing deletions, and highest in cells lacking mtDNA.
Figure 3.

ATG12 RNA overexpression in mutant 143B cybrids
Quantitative rt-PCR analysis of ATG12 RNA expression in 143B osteosarcoma cybrids. QRT-PCR results were normalized to 18sRNA expression. (A) QRT-PCR results of three separate experiments each done in duplicate. Black bars represent fusion control cell lines (FC), white bars mutant cell lines (M) and striped bars mtDNA depleted rho-zero 143B cell lines, cell line mutation status is described in Table 7. (B) Average relative ATG12 RNA expression of fusion controls, mutant cybrids and 143B rho-zero cells at left, summed. Error bars represent SEM. * Unpaired t test, p<0.05. ** Unpaired t test, p<0.01.
Increase in syntaxin 16 protein
Both inspection of the microarray data and the Onto-Express analysis suggested an increase in vesicular activity in the mutant cells. STX16 is a t-SNARE (SNAP receptors) molecule involved in synaptic vesicle docking and fusion, found in the Golgi and trans-Golgi network and essential for autophagy [53-55]. Immunoblot analysis confirmed an increased expression of STX16 in 143B cybrids and 143B rho-zero cells compared to 143B fusion controls (unpaired t test, p=0.0270 and p=0.0036 respectively, Figure 4).
Figure 4.

Syntaxin 16 protein overexpression in mutant 143B cybrids.
Relative expression of syntaxin 16 (STX16) in 143B mutant cybrids (M) compared to 143B fusion control cybrids (FC). (A) Representative immunoblot for STX16 out of three separate experiments. From left, the samples were: FC (fusion controls)-HGA13 & HPC7; M-Mutants: 14.6, 16.3. and 51-18. The blots were stripped and reprobed against beta-actin. (B) Average relative density (syntaxin 16 over beta-actin) in fusion controls, mutant cybrids and 143B rho-zero cells. Error bars represent SEM. * Unpaired t test, p<0.05. ** Unpaired t test, p<0.005.
Increase in oxidized proteins in mutant cells
Since deletions erase not only tRNAs but also mitochondrially-encoded subunits of the respiratory chain, it would not be unexpected if misfolding of electron transport chain complexes caused increased oxidative damage to proteins. Thus we measured oxidatively modified proteins using the Oxyblot method. There were significantly more oxidized proteins in cells bearing mtDNA deletions than fusion controls, i.e. controls that had been through the cybridization process with normal mtDNA.
Discussion
Single mtDNA deletions cause KSS, CPEO, or PS, whose affected tissues show impaired electron transport activity, ATP production, and mitochondrial protein synthesis [26, 56, 57]. Muscle biopsies from patients with KSS or CPEO show ragged-red fibers and cytochrome oxidase-negative fibers [58, 59]. Clinical signs vary widely in different syndromes but include muscle weakness, heart block, retinopathy, deafness, diabetes, short stature and dementia [2, 60]. We have used microarray in an attempt to link the primary cause of KSS/CPEO/PS with cellular, morphological, and clinical consequences. We examined the common transcriptomal consequences of mtDNA deletions in 6 cell types. Because deletions erase essential parts of the mitochondrial protein synthetic machinery (i.e. tRNAs) [58, 61] as well as essential components of the respiratory chain complexes that produce energy and other metabolites for the cell (Figure 5), we expected a strong ‘nuclear response’ to the ‘mitochondrial stimulus’.
Figure 5.
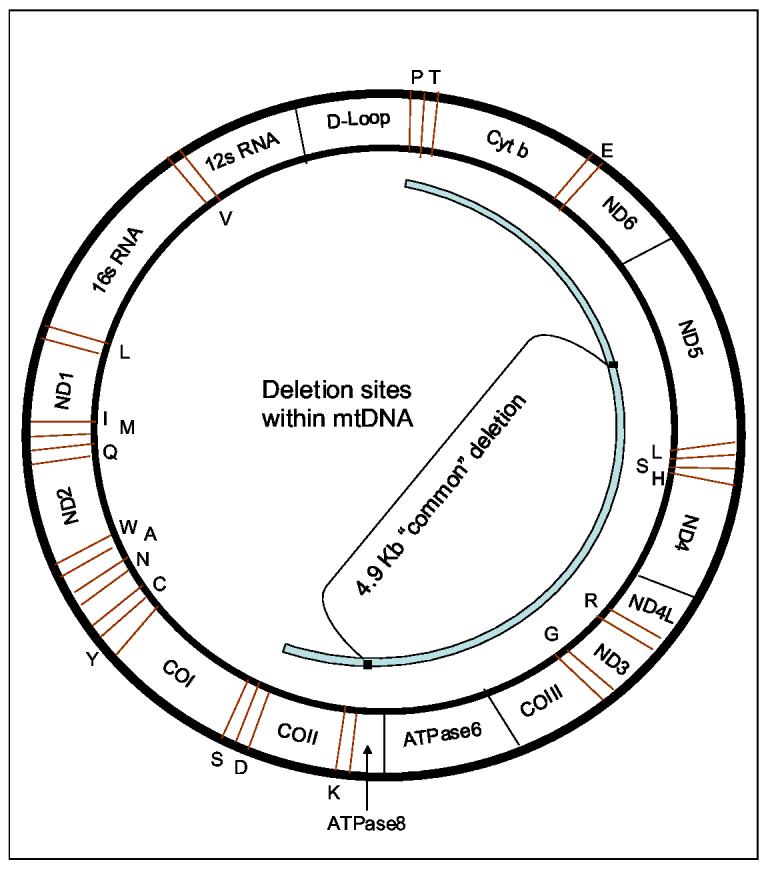
Deletion sites within mtDNA.
Deletions of mtDNA may occur within a certain region (shown in light blue). The deleted genes code for respiratory chain subunits of Complex I (ND3, ND4, ND4L, ND5 and ND6), Complex III (Cyt b), Complex IV (COII and COIII), and Complex V (ATPase 6and 8). The deletions may erase also transfer RNA genes (indicated in red) such as S, D, K, G, R, H, S, L, E, T, and P.
Single mtDNA deletions produce inhibition of multiple mitochondrial transcripts.
Since the mitochondrial and nuclear genome exist symbiotically, and co-encode several multisubunit complexes, it was interesting to see that mtDNA deletions had a strong negative effect on nuclear-encoded mitochondrially targeted genes. This was especially evident on Complex I transcripts, but also on Complex II and Complex IV assembly genes, on Complex V, on several TCA cycle genes, and on components of the mitochondrial ribosome. These data suggest that the nucleus senses the irreversible depletion of mtDNA-encoded mitochondrial subunits and tRNAs, and responds by down-regulating the interacting subunits that would normally form a functional complex. The downregulation of nuclear-encoded mitochondrial ribosomal subunits, OXPHOS, and TCA cycle transcripts thus appears to reinforce the mitochondrial defect initiated by the deletions, and add to the mitochondrial metabolic defect in the patients.
The depletion of mitochondrial function has recently been shown to induce MYC overexpression, and we also observed a substantial upregulation of MYC in cells bearing mtDNA deletions [40, 44-47, 62]
Deletions inhibit the ubiquitin and proteasome system
Deletions of the mitochondrial genome erase not only subunits of the respiratory chain that must co-operate with nuclear-encoded subunits [63], but also tRNAs necessary for mitochondrial protein synthesis [57].
Deletion of specific mtRNAs not only decreases mitochondrial translation rates [64, 65] but is also expected to result in increased mitochondrial protein unfolding and damage.
Although it has been known for some time that mildly damaged mitochondrial proteins are degraded by the proteasome, it hasn't been appreciated until recently that heavily damaged mitochondrial proteins inhibit the proteasome [66-70]. Thus, the very strong inhibition of many subunits of the ubiquitin-proteasome system is likely a consequence of misfolded and damaged mitochondrial proteins specified by the mtDNA deletions. Also, recent studies have demonstrated that mtDNA deletions increase ROS production, which would seem to compound the misfolding/damage problem [31]. To test these ideas, we measured oxidative damage to proteins by the Oxyblot method, and observed a >300% increase in oxidized proteins. Thus, mtDNA deletions result not only in increased protein oxidative damage but also decreased proteasome activity.
The downregulation of the proteasome microarray signal appears to be a unique consequence of mtDNA deletions, as it was not observed in a larger microarray study of other mitochondrial diseases, including Friedreich's ataxia, Leber's Hereditary Optic Neuropathy, Myoclonic Epilepsy with Ragged Red Fibers, and Neuropathy, Ataxia , and Retinitis Pigmentosa [44]. Thus, it seems likely that inhibition of the proteasomal transcripts is a direct consequence of mtDNA deletions.
Decreased amino acid concentration in mutant cells
One potential consequence of decreased ubiquitin protease activity is decreased salvage of amino acids, and recently the proteasome has been shown to be an important provider of amino acids for protein synthesis, specifically under conditions of minimal nutrient status [48].
Consistent with this prediction, we observed a significant and substantial decrease in steady-state amino acid concentration in mutant cells, and significant increases in transcripts that encode several amino acid-degrading enzymes, possibly as a response to amino acid depletion.
Induction of autophagy transcript in mutant cells
Deletions erase essential tRNA genes responsible for decoding mitochondrial RNA transcripts, which should result in irreparable protein damage. Since proteasomal activity is inhibited in cells with deletions, this raises the question of how the cell may deal with mitochondria carrying irreparable protein damage. ATG12, which is the first and most important gene in the mammalian autophagy cascade [49, 50], was upregulated in response to deletions, as shown by microarray across cell lines (Table 5), and the degree of upregulation was correlated with deletion status in the osteosarcoma cell line (Figure 3). It has recently been shown that autophagy is induced in response to impaired ubiquitin proteasome system activity [71, 72]. Also, it is known that low amino acid concentration triggers autophagy via inhibition of mTOR, thus providing a possible pathogenic mechanism for KSS: deletions> misfolding> proteasome inhibition> AA depletion> mTOR inhibition> autophagy, inhibition of protein synthesis and of cell growth.
Table 5.
Upregulated genes
| Function | Gene name | Gene | Up | Fold |
|---|---|---|---|---|
| Stress response | ||||
| Unfolded protein | ||||
| heat shock 70kDa protein 4 | HSPA4 | 3 | 1.8 | |
| DnaJ member 3 | DNAJC3 | 4 | 1.9 | |
| DnaJ member 4 | DNAJC4 | 3 | 1.2 | |
| Energy depletion | AMP kinase, alpha 1 | PRKAA | 3 | 2.1 |
| ATG12 autophagy related 12 | ATG12 | 4 | 1.7 | |
| glycine amidinotransferase | GATM | 3 | 1.9 | |
| Hypoxia | UDP-glucose ceramide glucosyltransferas | UGCG | 4 | 2.1 |
| adrenomedullin | ADM | 3 | 3.6 | |
| stanniocalcin 2 | STC2 | 4 | 3.0 | |
| Nonsense-mediated decay | PI-3-kinase-related kinase SMG-1 | SMG1 | 4 | 2.0 |
| Dicer1, Dcr-1 homolog (Drosophila) | DICER1 | 3 | 1.7 | |
| DNA damage | glycine amidinotransferase | ATM | 3 | 1.9 |
| Mitochondrial depletion | v-myc myelocytomatosis viral oncogene | MYC | 5 | 1.9 |
| SNARE/ intra-golgi transport | ||||
| syntaxin 16 | STX16 | 5 | 1.5 | |
| trans-golgi network protein 2 | TGOLN2 | 4 | 1.6 | |
| rho/rac guanine nucleotide exchange fact | ARHGEF | 4 | 1.3 | |
| golgi autoantigen, golgin subfamily a, 8A | GOLGA8A | 3 | 2.8 | |
| raft-linking protein | RAFTLIN | 3 | 2.8 | |
| VAMP (vesicle-associated membrane prot | VAPB | 3 | 2.1 | |
| ATPase, H+ transporting V0 subunit E isof | ATP6V0E2 | 3 | 1.6 | |
| vacuolar protein sorting 13A (yeast) | VPS13A | 3 | 1.6 | |
| Amino acid degradation | ||||
| glycine C-acetyltransferase (2-amino-3-ke | GCAT | 3 | 1.2 | |
| methionyl aminopeptidase 2 | METAP2 | 3 | 1.8 | |
| glutaminase | GLS | 3 | 1.6 | |
| aminoadipate-semialdehyde synthase | AASS | 3 | 2.2 | |
| lysyl oxidase | LOX | 4 | 1.6 |
Autophagy requires the action of SNARE and vesicular proteins
Consistent with the hypothesis of an induction of autophagy in mutant cells, we observed the induction of several SNARE/vesicular transcripts, syntaxin 16 (STX16, TGOLN2, ARHGEF, GOLGA8A, VAPB, ATP6V0E2L, VPS13A). Induction of SNARE proteins is essential for the process of autophagy [53, 73-75]. Thus it is possible that the subsarcolemmal proliferation of mitochondria observed in KSS/CPEO and revealed by the Gomori trichrome stain in ragged-red fibers is in fact the result of increased autophagic activity.
Amino acid deprivation induces autophagy
Amino acid deprivation is known to induce autophagy via inhibition of the mTOR pathway [51, 52]. Amino acid deprivation is also known to signal GCN2 and stimulate eIF2-alpha phosphorylation [76-78], resulting in increased expression of unfolded protein response (UPR) genes and endoplasmic reticulum (ER) stress-related genes, many of which are induced in mutant cells. Both the inhibition of mTOR and the phosphorylation of eIF2 alpha should result in the inhibition of protein synthesis transcripts that we observe in the microarray data.
A pathogenetic mechanism for KSS
mtDNA deletions remove tRNAs and functional components of the respiratory chain. The resulting mitochondrial protein damage has multiple consequences. Perhaps as a result of oxidative protein damage, one consequence is inhibition of the ubiquitin proteasome system, which may cause amino acid depletion through decreased amino acid salvage. A second generally accepted consequence is the reduction of ATP synthesis [26, 79]; and ATP depletion is known to activate the AMPK response [80] as a protective mechanism. Both amino acid depletion and AMPK activation can result in inhibition of mTOR [51, 81] which in turn inhibits translation, protein synthesis, and cellular growth, and induces autophagy (Figure 6).
Figure 6.

A mechanistic hypothesis for the consequences of mtDNA deletions.
Expected consequences of mtDNA deletions. Deletions must perforce erase essential tRNAs and components of multisubunit complexes of the OXPHOS chain, and result in increased protein oxidative damage. Increased protein oxidative damage has been demonstrated to inhibit ubiquitin-proteasomal activity, which is expected to decrease the rate of salvage of amino acids, and result in decreased amino acid concentration in cells, which has previously been demonstrated to decrease the activity of mTOR, which then represses protein synthesis and activates autophagy. Deletions were shown to result in decreased expression of nuclear-encoded OXPHOS complex (of both the electron transport chain and ATP synthase), which must also inhibit ATP synthesis (which has been demonstrated at the biochemical level by others), and stimulate the activity of AMP kinase, which then should inhibit mTOR, which should result in the inhibition of protein synthesis and the activation of autophagy [52].
Implications of the proposed mechanism for KSS patients
If this mechanism is correct, it suggests potential interventions for patients harboring mtDNA deletions. If the ubiquitin proteasomal defect is a primary consequence of mtDNA deletions, as we suspect, and causes the decrease in cellular amino acid concentration, which in turn signals mTOR and causes decreased protein synthesis transcripts, then supplementation of free amino acids might benefit the patients, because amino acids in general (and leucine in particular) are known to potently stimulate mTOR and inhibit autophagy [82-85].
Table 4.
Downregulated genes
| Function | Gene name | Gene | Times Down |
Fold |
|---|---|---|---|---|
| Ubiquitin-proteasome system | ||||
| Proteasome | proteasome beta type, 6 | PSMB6 | 4 | −1.2 |
| proteasome activator 3 | PSME3 | 3 | −1.6 | |
| proteasome , beta type, 4 | PSMB4 | 3 | −1.3 | |
| proteasome inhibitor subunit 1 | PSMF1 | 3 | −1.4 | |
| proteasome subunit, beta type, 2 | PSMB2 | 4 | −1.3 | |
| Ubiquitin ligase system | ubiquitin-conjugating enzyme E2E 3 | UBE2E3 | 6 | −1.3 |
| ubiquitin-conjugating enzyme E2E 1 | UBE2E1 | 3 | −1.4 | |
| ubiquitin-conjugating enzyme E2L 6 | UBE2L6 | 4 | −1.7 | |
| ubiquitin-conjugating enzyme E2I | UBE2I | 4 | −1.2 | |
| ubiquitin protein ligase E3B | UBE3B | 3 | −1.1 | |
| Ubiquitin specific peptidase 7 | USP7 | 4 | −1.4 | |
| ubiquitin specific peptidase 22 | USP22 | 4 | −1.4 | |
| ubiquitin specific peptidase 15 | USP15 | 3 | −1.6 | |
| ubiquitin specific peptidase 33 | USP33 | 4 | −1.4 | |
| ubiquitin protein ligase E3 n-recognin 2 | UBR2 | 5 | −1.3 | |
| cullin-associated & neddylation-dissociated 2 | CAND2 | 3 | −1.5 | |
| Mitochondrially-targeted transcripts | ||||
| Complex I | NADH dehydrogenase 1 alpha | NDUFA5 | 5 | −1.8 |
| NADH dehydrogenase 1 alpha | NDUFA6 | 3 | −1.4 | |
| NADH dehydrogenase 1 alpha | NDUFAF1 | 5 | −1.5 | |
| NADH dehydrogenase 1 beta | NDUFB3 | 3 | −1.5 | |
| NADH dehydrogenase Fe-S protein 3 | NDUFS3 | 3 | −1.4 | |
| NADH dehydrogenase flavoprotein | NDUFV2 | 3 | −1.3 | |
| Complex II | succinate dehydrogenase | SDHC | 3 | −1.4 |
| succinate dehydrogenase complex | SDHB | 3 | −1.3 | |
| Complex IV assembly | surfeit 1 | SURF1 | 3 | −1.4 |
| surfeit 2 | SURF2 | 3 | −1.5 | |
| Complex V | ATP synthase F0 complex, subunit c | ATP5G2 | 3 | −1.4 |
| ATP synthase, F0 complex, subunit d | ATP5H | 4 | −1.3 | |
| ATP synthase, F0 complex, subunit f | ATP5J2 | 3 | −1.3 | |
| TCA cycle | dihydrolipoamide dehydrogenase | DLD | 3 | −1.4 |
| aconitase 2, mitochondrial | ACO2 | 3 | −1.7 | |
| isocitrate dehydrogenase 3 (NAD+) gamma | IDH3G | 4 | −1.4 | |
| Mitochondrial ribosome | isoleucine-tRNA synthetase 2, mitochondrial | IARS2 | 4 | −1.4 |
| mitochondrial ribosomal protein L28 | MRPL28 | 3 | −1.3 | |
| mitochondrial ribosomal protein S18B | MRPS18B | 4 | −1.3 | |
| mitochondrial ribosomal protein L23 | MRPL23 | 4 | −1.4 | |
| Mitochondrial antioxidant | superoxide dismutase 2, mitochondrial | SOD2 | 3 | −1.7 |
Table 7.
Cell lines and tissues used in the study, with size and percent of deletion and disease status.
| Line | Size | Disease | % | array | QPCR | UPS | |
|---|---|---|---|---|---|---|---|
| Osteosarcoma | 3.7 | 7.5kb | kss | 70 | * | * | |
| 16.3 | 7.5kb | kss | 70 | * | * | ||
| 51-18 | 5kb | kss | 21 | * | |||
| BH.10.59 | 5kb | kss | 50 | * | |||
| 14-6 | 5kb | kss | 21 | * | |||
| dH.2.1 | 7.5kb | kss | 50 | * | |||
| 143GA | 0 | Normal | 0 | * | |||
| 143MK | 0 | Normal | 0 | * | |||
| hga13 | 0 | Control Fused | 0 | * | |||
| hpc7 | 0 | Control Fused | 0 | * | |||
| h1959 | 0 | Control Fused | 0 | * | |||
| hba2 | 0 | Control Fused | 0 | * | |||
| Lymphoblasts | 848 | 5kb | kss | 57 | * | * | * |
| 63358 | 7.4kb | kss | 27 | * | * | ||
| C536 | 0 | Normal | 0 | ||||
| C333 | 0 | Normal | 0 | * | * | ||
| C621 | 0 | Normal | 0 | * | |||
| Fibroblasts | AC | 5kb | kss | 20 | * | ||
| RJ | 5kb | kss | 72 | * | |||
| 3511 | NA | kss | NA | * | |||
| 3246 | NA | kss | NA | * | |||
| C305 | 0 | Normal | 0 | ||||
| C572 | 0 | Normal | 0 | ||||
| NT2 cybrids | 4.9-1(8) | 5kb | kss | 16 | * | ||
| 4.9-2 (48) | 5kb | kss | 75 | * | |||
| AW Ctl | 0 | Normal | 0 | ||||
| Myoblasts | 4317 | 5kb | kss | NA | * | * | |
| 8279 | 5kb | kss | NA | * | * | ||
| 2f0135 | 0 | Normal | 0 | * | * | ||
| 2f0873 | 0 | Normal | 0 | * | * | ||
| Muscle | 1348 | 5 kb | kss | NA | * | * | |
| 3515 | 5kb | kss | NA | * | * | ||
| 3516 | 5kb | kss | NA | * | |||
| 3517 | 5kb | kss | NA | * | * | ||
| 2378 | 0 | normal | 0 | * | |||
| 2666 | 0 | normal | 0 | * | |||
| 2794 | 0 | normal | 0 | * | * | ||
| 2815 | 0 | normal | 0 | * | * |
Acknowledgements
The Authors would like to gratefully acknowledge Drs. N. Kennaway, C. Moraes, G. Mattijs and Y-H Wei for providing mutant cell lines, C. Duong and C. Lu, for technical support. This work was supported by United States Public Health Service grants RO1 AG11967, AG16719, EY12245, RO3 AG023311, P30ES005707 and by NIH grant V440C21.
List of Abbreviations
- CPEO
Chronic Progressive External Opthalmoplegia
- FBS
fetal bovine serum
- FC
fusion control cell lines
- KSS
Kearns Sayre Syndrome
- OE
Onto-Express
- mtDNA
mitochondrial DNA
- OPG
Osteoprotegerin
- PS
Pearson's Syndrome
- PEG
Poly Ethylene Glycol
- ROS
reactive oxygen species
- SDS
sodium dodecyl sulfate
- SSA
sulfosalicyclic acid
- SD
standard deviation
- UPR
unfolded protein response
Footnotes
Publisher's Disclaimer: This is a PDF file of an unedited manuscript that has been accepted for publication. As a service to our customers we are providing this early version of the manuscript. The manuscript will undergo copyediting, typesetting, and review of the resulting proof before it is published in its final citable form. Please note that during the production process errors may be discovered which could affect the content, and all legal disclaimers that apply to the journal pertain.
References
- 1.Holt IJ, Harding AE, Morgan-Hughes JA. Deletions of muscle mitochondrial DNA in patients with mitochondrial myopathies. Nature. 1988;331:717–719. doi: 10.1038/331717a0. [DOI] [PubMed] [Google Scholar]
- 2.Moraes CT, DiMauro S, Zeviani M, Lombes A, Shanske S, Miranda AF, Nakase H, Bonilla E, Werneck LC, Servidei S, et al. Mitochondrial DNA deletions in progressive external ophthalmoplegia and Kearns-Sayre syndrome. N. Engl. J. Med. 1989;320:1293–1299. doi: 10.1056/NEJM198905183202001. [DOI] [PubMed] [Google Scholar]
- 3.Rotig A, Cormier V, Blanche S, Bonnefont JP, Ledeist F, Romero N, Schmitz J, Rustin P, Fischer A, Saudubray JM, et al. Pearson's marrow-pancreas syndrome. A multisystem mitochondrial disorder in infancy. J. Clin. Invest. 1990;86:1601–1608. doi: 10.1172/JCI114881. [DOI] [PMC free article] [PubMed] [Google Scholar]
- 4.Johns DR, Rutledge SL, Stine OC, Hurko O. Directly repeated sequences associated with pathogenic mitochondrial DNA deletions. Proc. Natl. Acad. Sci. U S A. 1989;86:8059–8062. doi: 10.1073/pnas.86.20.8059. [DOI] [PMC free article] [PubMed] [Google Scholar]
- 5.Schon EA, Rizzuto R, Moraes CT, Nakase H, Zeviani M, DiMauro S. A direct repeat is a hotspot for large-scale deletion of human mitochondrial DNA. Science. 1989;244:346–349. doi: 10.1126/science.2711184. [DOI] [PubMed] [Google Scholar]
- 6.Moraes CT, Sciacco M, Ricci E, Tengan CH, Hao H, Bonilla E, Schon EA, DiMauro S. Phenotype-genotype correlations in skeletal muscle of patients with mtDNA deletions. Muscle Nerve. 1995;3:S150–S153. doi: 10.1002/mus.880181429. [DOI] [PubMed] [Google Scholar]
- 7.Zeviani M, Moraes CT, DiMauro S, Nakase H, Bonilla E, Schon EA, Rowland LP. Deletions of mitochondrial DNA in Kearns-Sayre syndrome. Neurology. 1988;38:1339–1346. doi: 10.1212/wnl.38.9.1339. [DOI] [PubMed] [Google Scholar]
- 8.Vielhaber S, Kudin A, Schroder R, Elger CE, Kunz WS. Muscle fibres: applications for the study of the metabolic consequences of enzyme deficiencies in skeletal muscle. Biochem. Soc. Trans. 2000;28:159–164. doi: 10.1042/bst0280159. [DOI] [PubMed] [Google Scholar]
- 9.Chen X, Prosser R, Simonetti S, Sadlock J, Jagiello G, Schon EA. Rearranged mitochondrial genomes are present in human oocytes. Am. J. Hum. Genet. 1995;57:239–247. [PMC free article] [PubMed] [Google Scholar]
- 10.Kaukonen J, Juselius JK, Tiranti V, Kyttala A, Zeviani M, Comi GP, Keranen S, Peltonen L, Suomalainen A. Role of adenine nucleotide translocator 1 in mtDNA maintenance. Science. 2000;289:782–785. doi: 10.1126/science.289.5480.782. [DOI] [PubMed] [Google Scholar]
- 11.Spelbrink JN, Li FY, Tiranti V, Nikali K, Yuan QP, Tariq M, Wanrooij S, Garrido N, Comi G, Morandi L, Santoro L, Toscano A, Fabrizi GM, Somer H, Croxen R, Beeson D, Poulton J, Suomalainen A, Jacobs HT, Zeviani M, Larsson C. Human mitochondrial DNA deletions associated with mutations in the gene encoding Twinkle, a phage T7 gene 4-like protein localized in mitochondria. Nat. Genet. 2001;28:223–231. doi: 10.1038/90058. [DOI] [PubMed] [Google Scholar]
- 12.Van Goethem G, Dermaut B, Lofgren A, Martin JJ, Van Broeckhoven C. Mutation of POLG is associated with progressive external ophthalmoplegia characterized by mtDNA deletions. Nat. Genet. 2001;28:211–212. doi: 10.1038/90034. [DOI] [PubMed] [Google Scholar]
- 13.Cortopassi GA, Shibata D, Soong NW, Arnheim N. A pattern of accumulation of a somatic deletion of mitochondrial DNA in aging human tissues. Proc. Natl. Acad. Sci. U S A. 1992;89:7370–7374. doi: 10.1073/pnas.89.16.7370. [DOI] [PMC free article] [PubMed] [Google Scholar]
- 14.Wang E, Wong A, Cortopassi G. The rate of mitochondrial mutagenesis is faster in mice than humans. Mutat. Res. 1997;377:157–166. doi: 10.1016/s0027-5107(97)00091-2. [DOI] [PubMed] [Google Scholar]
- 15.Soong NW, Hinton DR, Cortopassi GA, Arnheim N. Mosaicism for a specific somatic mitochondrial DNA mutation in adult human brain. Nat. Gent. 1992;2:318–323. doi: 10.1038/ng1292-318. [DOI] [PubMed] [Google Scholar]
- 16.Katayama M, Tanaka M, Yamamoto H, Ohbayashi T, Nimura Y, Ozawa T. Deleted mitochondrial DNA in the skeletal muscle of aged individuals. Biochem. Int. 1991;25:47–56. [PubMed] [Google Scholar]
- 17.Simonetti S, Chen X, DiMauro S, Schon EA. Accumulation of deletions in human mitochondrial DNA during normal aging: analysis by quantitative PCR. Biochim. Biophys. Acta. 1992;1180:113–122. doi: 10.1016/0925-4439(92)90059-v. [DOI] [PubMed] [Google Scholar]
- 18.Kraytsberg Y, Kudryavtseva E, McKee AC, Geula C, Kowall NW, Khrapko K. Mitochondrial DNA deletions are abundant and cause functional impairment in aged human substantia nigra neurons. Nat. Genet. 2006;38:518–520. doi: 10.1038/ng1778. [DOI] [PubMed] [Google Scholar]
- 19.Brierley EJ, Johnson MA, James OF, Turnbull DM. Mitochondrial involvement in the ageing process. Facts and controversies. Mol. Cell. Biochem. 1997;174:325–328. [PubMed] [Google Scholar]
- 20.Cao Z, Wanagat J, McKiernan SH, Aiken JM. Mitochondrial DNA deletion mutations are concomitant with ragged red regions of individual, aged muscle fibers: analysis by laser-capture microdissection. Nucleic Acids Res. 2001;29:4502–4508. doi: 10.1093/nar/29.21.4502. [DOI] [PMC free article] [PubMed] [Google Scholar]
- 21.Kopsidas G, Kovalenko SA, Kelso JM, Linnane AW. An age-associated correlation between cellular bioenergy decline and mtDNA rearrangements in human skeletal muscle. Mutat. Res. 1998;421:27–36. doi: 10.1016/s0027-5107(98)00150-x. [DOI] [PubMed] [Google Scholar]
- 22.Pesce V, Cormio A, Fracasso F, Vecchiet J, Felzani G, Lezza AM, Cantatore P, Gadaleta MN. Age-related mitochondrial genotypic and phenotypic alterations in human skeletal muscle. Free Radic. Biol. Med. 2001;30:1223–1233. doi: 10.1016/s0891-5849(01)00517-2. [DOI] [PubMed] [Google Scholar]
- 23.Short KR, Bigelow ML, Kahl J, Singh R, Coenen-Schimke J, Raghavakaimal S, Nair KS. Decline in skeletal muscle mitochondrial function with aging in humans. Proc. Natl. Acad. Sci. U S A. 2005;102:5618–5623. doi: 10.1073/pnas.0501559102. [DOI] [PMC free article] [PubMed] [Google Scholar]
- 24.Bender A, Krishnan KJ, Morris CM, Taylor GA, Reeve AK, Perry RH, Jaros E, Hersheson JS, Betts J, Klopstock T, Taylor RW, Turnbull DM. High levels of mitochondrial DNA deletions in substantia nigra neurons in aging and Parkinson disease. Nat. Genet. 2006;38:515–517. doi: 10.1038/ng1769. [DOI] [PubMed] [Google Scholar]
- 25.Hayashi J, Ohta S, Kikuchi A, Takemitsu M, Goto Y, Nonaka I. Introduction of disease-related mitochondrial DNA deletions into HeLa cells lacking mitochondrial DNA results in mitochondrial dysfunction. Proc. Natl. Acad. Sci. U S A. 1991;88:10614–10618. doi: 10.1073/pnas.88.23.10614. [DOI] [PMC free article] [PubMed] [Google Scholar]
- 26.Porteous WK, James AM, Sheard PW, Porteous CM, Packer MA, Hyslop SJ, Melton JV, Pang CY, Wei YH, Murphy MP. Bioenergetic consequences of accumulating the common 4977-bp mitochondrial DNA deletion. Eur. J. Biochem. 1998;257:192–201. doi: 10.1046/j.1432-1327.1998.2570192.x. [DOI] [PubMed] [Google Scholar]
- 27.Inoue K, Nakada K, Ogura A, Isobe K, Goto Y, Nonaka I, Hayashi JI. Generation of mice with mitochondrial dysfunction by introducing mouse mtDNA carrying a deletion into zygotes. Nat. Genet. 2000;26:176–181. doi: 10.1038/82826. [DOI] [PubMed] [Google Scholar]
- 28.Nakada K, Ono T, Hayashi J. A novel defense system of mitochondria in mice and human subjects for preventing expression of mitochondrial dysfunction by pathogenic mutant mtDNAs. Mitochondrion. 2002;2:59–70. doi: 10.1016/s1567-7249(02)00007-7. [DOI] [PubMed] [Google Scholar]
- 29.Lim PS, Ma YS, Cheng YM, Chai H, Lee CF, Chen TL, Wei YH. Mitochondrial DNA mutations and oxidative damage in skeletal muscle of patients with chronic uremia. J. Biomed. Sci. 2002;9:549–560. doi: 10.1159/000064728. [DOI] [PubMed] [Google Scholar]
- 30.Jou MJ, Peng TI, Wu HY, Wei YH. Enhanced Generation of Mitochondrial Reactive Oxygen Species in Cybrids Containing 4977-bp Mitochondrial DNA Deletion. Ann. N. Y. Acad. Sci. 2005;1042:221–228. doi: 10.1196/annals.1338.024. [DOI] [PubMed] [Google Scholar]
- 31.Wei YH, Lee CF, Lee HC, Ma YS, Wang CW, Lu CY, Pang CY. Increases of mitochondrial mass and mitochondrial genome in association with enhanced oxidative stress in human cells harboring 4,977 BP-deleted mitochondrial DNA. Ann. N. Y. Acad. Sci. 2001;928:97–112. doi: 10.1111/j.1749-6632.2001.tb05640.x. [DOI] [PubMed] [Google Scholar]
- 32.Lu CY, Lee HC, Fahn HJ, Wei YH. Oxidative damage elicited by imbalance of free radical scavenging enzymes is associated with large-scale mtDNA deletions in aging human skin. Mutat. Res. 1999;423:11–21. doi: 10.1016/s0027-5107(98)00220-6. [DOI] [PubMed] [Google Scholar]
- 33.Santorelli FM, Barmada MA, Pons R, Zhang LL, DiMauro S. Leigh-type neuropathology in Pearson syndrome associated with impaired ATP production and a novel mtDNA deletion. Neurology. 1996;47:1320–1323. doi: 10.1212/wnl.47.5.1320. [DOI] [PubMed] [Google Scholar]
- 34.Attardi G, Schatz G. Biogenesis of mitochondria. Annu. Rev. Cell. Biol. 1988;4:289–333. doi: 10.1146/annurev.cb.04.110188.001445. [DOI] [PubMed] [Google Scholar]
- 35.Gibson BW. The human mitochondrial proteome: oxidative stress, protein modifications and oxidative phosphorylation. Int. J. Biochem. Cell. Biol. 2005;37:927–934. doi: 10.1016/j.biocel.2004.11.013. [DOI] [PubMed] [Google Scholar]
- 36.Chinnery PF, Schon EA. Mitochondria. J. Neurol. Neurosurg. Psychiatry. 2003;74:1188–1199. doi: 10.1136/jnnp.74.9.1188. [DOI] [PMC free article] [PubMed] [Google Scholar]
- 37.Bossy-Wetzel E, Green DR. Apoptosis: checkpoint at the mitochondrial frontier. Mutat. Res. 1999;434:243–251. doi: 10.1016/s0921-8777(99)00032-4. [DOI] [PubMed] [Google Scholar]
- 38.King MP, Attardi G. Human cells lacking mtDNA: repopulation with exogenous mitochondria by complementation. Science. 1989;246:500–503. doi: 10.1126/science.2814477. [DOI] [PubMed] [Google Scholar]
- 39.Carelli V, Vergani L, Bernazzi B, Zampieron C, Bucchi L, Valentino M, Rengo C, Torroni A, Martinuzzi A. Respiratory function in cybrid cell lines carrying European mtDNA haplogroups: implications for Leber's hereditary optic neuropathy. Biochim. Biophys. Acta. 2002;1588:7–14. doi: 10.1016/s0925-4439(02)00097-2. [DOI] [PubMed] [Google Scholar]
- 40.Danielson SR, Carelli V, Tan G, Martinuzzi A, Schapira AH, Savontaus ML, Cortopassi GA. Isolation of transcriptomal changes attributable to LHON mutations and the cybridization process. Brain. 2005;128:1026–1037. doi: 10.1093/brain/awh447. [DOI] [PubMed] [Google Scholar]
- 41.Schadt EE, Li C, Ellis B, Wong WH. Feature extraction and normalization algorithms for high-density oligonucleotide gene expression array data. J. Cell. Biochem. Suppl. 2001;37:120–125. doi: 10.1002/jcb.10073. [DOI] [PubMed] [Google Scholar]
- 42.Khatri P, Draghici S, Ostermeier GC, Krawetz SA. Profiling gene expression using onto-express. Genomics. 2002;79:266–270. doi: 10.1006/geno.2002.6698. [DOI] [PubMed] [Google Scholar]
- 43.Slocum RH, Cummings JG. Amino acid analysis of physiological samples. In: Hommes FA, editor. Techniques in diagnostic human biochemical genetics: a laboratory manual. Wiley-Liss Inc.; Somerset, NJ: 1991. pp. 87–126. [Google Scholar]
- 44.Cortopassi G, Danielson S, Alemi M, Tong W, Carelli V, Martinuzzi A, Marzuki S, Majamaa K, Wong A. Mitochondrial disease activates transcripts of the unfolded protein response and cell cycle and inhibits vesicular secretion and oligodendrocyte-specific transcripts. Mitochondrion. 2006 doi: 10.1016/j.mito.2006.05.002. In press. [DOI] [PubMed] [Google Scholar]
- 45.Li F, Wang Y, Zeller KI, Potter JJ, Wonsey DR, O'Donnell KA, Kim JW, Yustein JT, Lee LA, Dang CV. Myc stimulates nuclearly encoded mitochondrial genes and mitochondrial biogenesis. Mol. Cell. Biol. 2005;25:6225–6234. doi: 10.1128/MCB.25.14.6225-6234.2005. [DOI] [PMC free article] [PubMed] [Google Scholar]
- 46.Miceli MV, Jazwinski SM. Common and cell type-specific responses of human cells to mitochondrial dysfunction. Exp. Cell. Res. 2005;302:270–280. doi: 10.1016/j.yexcr.2004.09.006. [DOI] [PubMed] [Google Scholar]
- 47.Wonsey DR, Follettie MT. Loss of the forkhead transcription factor FoxM1 causes centrosome amplification and mitotic catastrophe. Cancer Res. 2005;65:5181–5189. doi: 10.1158/0008-5472.CAN-04-4059. [DOI] [PubMed] [Google Scholar]
- 48.Vabulas RM, Hartl FU. Protein synthesis upon acute nutrient restriction relies on proteasome function. Science. 2005;310:1960–1963. doi: 10.1126/science.1121925. [DOI] [PubMed] [Google Scholar]
- 49.Klionsky DJ, Emr SD. Autophagy as a regulated pathway of cellular degradation. Science. 2000;290:1717–1721. doi: 10.1126/science.290.5497.1717. [DOI] [PMC free article] [PubMed] [Google Scholar]
- 50.Mizushima N, Yoshimori T, Ohsumi Y. Role of the Apg12 conjugation system in mammalian autophagy. Int. J. Biochem. Cell. Biol. 2003;35:553–561. doi: 10.1016/s1357-2725(02)00343-6. [DOI] [PubMed] [Google Scholar]
- 51.Kadowaki M, Kanazawa T. Amino acids as regulators of proteolysis. J. Nutr. 2003;133:2052S–2056S. doi: 10.1093/jn/133.6.2052S. [DOI] [PubMed] [Google Scholar]
- 52.Lindsley JE, Rutter J. Nutrient sensing and metabolic decisions. Comp. Biochem. Physiol. B. Biochem. Mol. Biol. 2004;139:543–559. doi: 10.1016/j.cbpc.2004.06.014. [DOI] [PubMed] [Google Scholar]
- 53.Darsow T, Rieder SE, Emr SD. A multispecificity syntaxin homologue, Vam3p, essential for autophagic and biosynthetic protein transport to the vacuole. J. Cell. Biol. 1997;138:517–529. doi: 10.1083/jcb.138.3.517. [DOI] [PMC free article] [PubMed] [Google Scholar]
- 54.Simonsen A, Bremnes B, Ronning E, Aasland R, Stenmark H. Syntaxin-16, a putative Golgi t-SNARE. Eur. J. Cell. Biol. 1998;75:223–231. doi: 10.1016/S0171-9335(98)80116-7. [DOI] [PubMed] [Google Scholar]
- 55.Wang Y, Tai G, Lu L, Johannes L, Hong W, Luen Tang B. Trans-Golgi network syntaxin 10 functions distinctly from syntaxins 6 and 16. Mol. Membr. Biol. 2005;22:313–325. doi: 10.1080/09687860500143829. [DOI] [PubMed] [Google Scholar]
- 56.Gellerich FN, Deschauer M, Chen Y, Muller T, Neudecker S, Zierz S. Mitochondrial respiratory rates and activities of respiratory chain complexes correlate linearly with heteroplasmy of deleted mtDNA without threshold and independently of deletion size. Biochim. Biophys. Acta. 2002;1556:41–52. doi: 10.1016/s0005-2728(02)00305-5. [DOI] [PubMed] [Google Scholar]
- 57.Jacobs HT. Disorders of mitochondrial protein synthesis. Hum. Mol. Genet. 2003;12:R293–301. doi: 10.1093/hmg/ddg285. Spec No 2. [DOI] [PubMed] [Google Scholar]
- 58.Mita S, Schmidt B, Schon EA, DiMauro S, Bonilla E. Detection of “deleted” mitochondrial genomes in cytochrome-c oxidase-deficient muscle fibers of a patient with Kearns-Sayre syndrome. Proc. Natl. Acad. Sci. U S A. 1989;86:9509–9513. doi: 10.1073/pnas.86.23.9509. [DOI] [PMC free article] [PubMed] [Google Scholar]
- 59.Rollins S, Prayson RA, McMahon JT, Cohen BH. Diagnostic yield muscle biopsy in patients with clinical evidence of mitochondrial cytopathy. Am. J. Clin. Pathol. 2001;116:326–330. doi: 10.1309/WATB-W4QV-NA53-B9MY. [DOI] [PubMed] [Google Scholar]
- 60.McFarland R, Taylor RW, Turnbull DM. The neurology of mitochondrial DNA disease. Lancet Neurol. 2002;1:343–351. doi: 10.1016/s1474-4422(02)00159-x. [DOI] [PubMed] [Google Scholar]
- 61.Zeviani M, Amati P, Comi G, Fratta G, Mariotti C, Tiranti V. Searching for genes affecting the structural integrity of the mitochondrial genome. Biochim. Biophys. Acta. 1995;1271:153–158. doi: 10.1016/0925-4439(95)00022-v. [DOI] [PubMed] [Google Scholar]
- 62.Wonsey DR, Zeller KI, Dang CV. The c-Myc target gene PRDX3 is required for mitochondrial homeostasis and neoplastic transformation. Proc. Natl. Acad. Sci. U S A. 2002;99:6649–6654. doi: 10.1073/pnas.102523299. [DOI] [PMC free article] [PubMed] [Google Scholar]
- 63.DiMauro S, Schon EA. Mitochondrial respiratory-chain diseases. N. Engl. J. Med. 2003;348:2656–2668. doi: 10.1056/NEJMra022567. [DOI] [PubMed] [Google Scholar]
- 64.Nakase H, Moraes CT, Rizzuto R, Lombes A, DiMauro S, Schon EA. Transcription and translation of deleted mitochondrial genomes in Kearns-Sayre syndrome: implications for pathogenesis. Am. J. Hum. Genet. 1990;46:418–427. [PMC free article] [PubMed] [Google Scholar]
- 65.Sudoyo H, Marzuki S, Byrne E, Mastaglia F. Phenotypic expression of mtDNA heteroplasmy in the skeletal muscle of patients with oculomyopathy: defect in mitochondrial protein synthesis. J. Neurol. Sci. 1993;117:83–91. doi: 10.1016/0022-510x(93)90159-v. [DOI] [PubMed] [Google Scholar]
- 66.Powell SR, Wang P, Divald A, Teichberg S, Haridas V, McCloskey TW, Davies KJ, Katzeff H. Aggregates of oxidized proteins (lipofuscin) induce apoptosis through proteasome inhibition and dysregulation of proapoptotic proteins. Free Radic. Biol. Med. 2005;38:1093–1101. doi: 10.1016/j.freeradbiomed.2005.01.003. [DOI] [PubMed] [Google Scholar]
- 67.Grune T, Jung T, Merker K, Davies KJ. Decreased proteolysis caused by protein aggregates, inclusion bodies, plaques, lipofuscin, ceroid, and ‘aggresomes’ during oxidative stress, aging, and disease. Int. J. Biochem. Cell. Biol. 2004;36:2519–2530. doi: 10.1016/j.biocel.2004.04.020. [DOI] [PubMed] [Google Scholar]
- 68.Davies KJ, Shringarpure R. Preferential degradation of oxidized proteins by the 20S proteasome may be inhibited in aging and in inflammatory neuromuscular diseases. Neurology. 2006;66:S93–S96. doi: 10.1212/01.wnl.0000192308.43151.63. [DOI] [PubMed] [Google Scholar]
- 69.Betarbet R, Canet-Aviles RM, Sherer TB, Mastroberardino PG, McLendon C, Kim JH, Lund S, Na HM, Taylor G, Bence NF, Kopito R, Seo BB, Yagi T, Yagi A, Klinefelter G, Cookson MR, Greenamyre JT. Intersecting pathways to neurodegeneration in Parkinson's disease: Effects of the pesticide rotenone on DJ-1, alpha-synuclein, and the ubiquitin-proteasome system. Neurobiol. Dis. 2006;22:404–420. doi: 10.1016/j.nbd.2005.12.003. [DOI] [PubMed] [Google Scholar]
- 70.Shamoto-Nagai M, Maruyama W, Kato Y, Isobe K, Tanaka M, Naoi M, Osawa T. An inhibitor of mitochondrial complex I, rotenone, inactivates proteasome by oxidative modification and induces aggregation of oxidized proteins in SH-SY5Y cells. J. Neurosci. Res. 2003;74:589–597. doi: 10.1002/jnr.10777. [DOI] [PubMed] [Google Scholar]
- 71.Iwata A, Riley BE, Johnston JA, Kopito RR. HDAC6 and microtubules are required for autophagic degradation of aggregated huntingtin. J. Biol. Chem. 2005;280:40282–40292. doi: 10.1074/jbc.M508786200. [DOI] [PubMed] [Google Scholar]
- 72.Sullivan PG, Dragicevic NB, Deng JH, Bai Y, Dimayuga E, Ding Q, Chen Q, Bruce-Keller AJ, Keller JN. Proteasome inhibition alters neural mitochondrial homeostasis and mitochondria turnover. J. Biol. Chem. 2004;279:20699–20707. doi: 10.1074/jbc.M313579200. [DOI] [PubMed] [Google Scholar]
- 73.Shorer H, Amar N, Meerson A, Elazar Z. Modulation of N-ethylmaleimide-sensitive factor activity upon amino acid deprivation. J. Biol. Chem. 2005;280:16219–16226. doi: 10.1074/jbc.M500554200. [DOI] [PubMed] [Google Scholar]
- 74.Reggiori F, Wang CW, Nair U, Shintani T, Abeliovich H, Klionsky DJ. Early stages of the secretory pathway, but not endosomes, are required for Cvt vesicle and autophagosome assembly in Saccharomyces cerevisiae. Mol. Biol. Cell. 2004;15:2189–2204. doi: 10.1091/mbc.E03-07-0479. [DOI] [PMC free article] [PubMed] [Google Scholar]
- 75.Ishihara N, Hamasaki M, Yokota S, Suzuki K, Kamada Y, Kihara A, Yoshimori T, Noda T, Ohsumi Y. Autophagosome requires specific early Sec proteins for its formation and NSF/SNARE for vacuolar fusion. Mol. Biol. Cell. 2001;12:3690–702. doi: 10.1091/mbc.12.11.3690. [DOI] [PMC free article] [PubMed] [Google Scholar]
- 76.Cherkasova VA, Hinnebusch AG. Translational control by TOR and TAP42 through dephosphorylation of eIF2alpha kinase. GCN2 Genes Dev. 2003;17:859–872. doi: 10.1101/gad.1069003. [DOI] [PMC free article] [PubMed] [Google Scholar]
- 77.Wek SA, Zhu S, Wek RC. The histidyl-tRNA synthetase-related sequence in the eIF-2 alpha protein kinase GCN2 interacts with tRNA and is required for activation in response to starvation for different amino acids. Mol. Cell. Biol. 1995;15:4497–4506. doi: 10.1128/mcb.15.8.4497. [DOI] [PMC free article] [PubMed] [Google Scholar]
- 78.Kimball SR. Regulation of translation initiation by amino acids in eukaryotic cells. Prog. Mol. Subcell. Biol. 2001;26:155–184. doi: 10.1007/978-3-642-56688-2_6. [DOI] [PubMed] [Google Scholar]
- 79.James AM, Sheard PW, Wei YH, Murphy MP. Decreased ATP synthesis is phenotypically expressed during increased energy demand in fibroblasts containing mitochondrial tRNA mutations. Eur. J. Biochem. 1999;259:462–469. doi: 10.1046/j.1432-1327.1999.00066.x. [DOI] [PubMed] [Google Scholar]
- 80.Kemp BE, Mitchelhill KI, Stapleton D, Michell BJ, Chen ZP, Witters LA. Dealing with energy demand: the AMP-activated protein kinase. Trends Biochem. Sci. 1999;24:22–25. doi: 10.1016/s0968-0004(98)01340-1. [DOI] [PubMed] [Google Scholar]
- 81.Bolster DR, Crozier SJ, Kimball SR, Jefferson LS. AMP-activated protein kinase suppresses protein synthesis in rat skeletal muscle through down-regulated mammalian target of rapamycin (mTOR) signaling. J. Biol. Chem. 2002;277:23977–23980. doi: 10.1074/jbc.C200171200. [DOI] [PubMed] [Google Scholar]
- 82.Jefferson LS, Kimball SR. Amino acids as regulators of gene expression at the level of mRNA translation. J. Nutr. 2003;133:2046S–2051S. doi: 10.1093/jn/133.6.2046S. [DOI] [PubMed] [Google Scholar]
- 83.Anthony JC, Yoshizawa F, Anthony TG, Vary TC, Jefferson LS, Kimball SR. Leucine stimulates translation initiation in skeletal muscle of postabsorptive rats via a rapamycin-sensitive pathway. J. Nutr. 2000;130:2413–2419. doi: 10.1093/jn/130.10.2413. [DOI] [PubMed] [Google Scholar]
- 84.Anthony JC, Anthony TG, Layman DK. Leucine supplementation enhances skeletal muscle recovery in rats following exercise. J. Nutr. 1999;129:1102–1106. doi: 10.1093/jn/129.6.1102. [DOI] [PubMed] [Google Scholar]
- 85.Charrueau C, Blonde-Cynober F, Coudray-Lucas C, Poupon R, Chaumeil JC, Hannoun L, Cynober L. Prevention of proteolysis in cold-stored rat liver by addition of amino acids to the preservation solution. J. Gastroenterol. Hepatol. 2000;15:1199–1204. doi: 10.1046/j.1440-1746.2000.02310.x. [DOI] [PubMed] [Google Scholar]