Abstract
We investigate the mechanical strength of adhesion and the dynamics of detachment of the membrane from the cytoskeleton of red blood cells (RBCs). Using hydrodynamical flows, we extract membrane tethers from RBCs locally attached to the tip of a microneedle. We monitor their extrusion and retraction dynamics versus flow velocity (i.e., extrusion force) over successive extrusion-retraction cycles. Membrane tether extrusion is carried out on healthy RBCs and ATP-depleted or -inhibited RBCs. For healthy RBCs, extrusion is slow, constant in velocity, and reproducible through several extrusion-retraction cycles. For ATP-depleted or -inhibited cells, extrusion dynamics exhibit an aging phenomenon through extrusion-retraction cycles: because the extruded membrane is not able to retract properly onto the cell body, each subsequent extrusion exhibits a loss of resistance to tether growth over the tether length extruded at the previous cycle. In contrast, the additionally extruded tether length follows healthy dynamics. The extrusion velocity  depends on the extrusion force f according to a nonlinear fashion. We interpret this result with a model that includes the dynamical feature of membrane-cytoskeleton association. Tether extrusion leads to a radial membrane flow from the cell body toward the tether. In a distal permeation regime, the flow passes through the integral proteins bound to the cytoskeleton without affecting their binding dynamics. In a proximal sliding regime, where membrane radial velocity is higher, integral proteins can be torn out, leading to the sliding of the membrane over the cytoskeleton. Extrusion dynamics are governed by the more dissipative permeation regime: this leads to an increase of the membrane tension and a narrowing of the tether, which explains the power law behavior of
  Our main result is that ATP is necessary for the extruded membrane to retract onto the cell body. Under ATP depletion or inhibition conditions, the aging of the RBC after extrusion is interpreted as a perturbation of membrane-cytoskeleton linkage dynamics.
INTRODUCTION
Membrane mechanical properties of living cells provide remarkable features to achieve crucial functions, such as adhesion, motility, and intra/extracellular communication. This versatility resides in the association of a fluid lipid bilayer with an elastic, and often dynamic, network of proteins: the cytoskeleton.
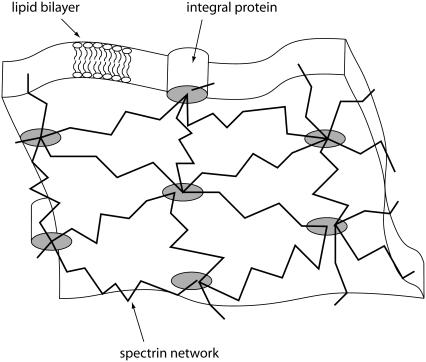
Red blood cells (RBCs) have been a good candidate for membrane mechanics studies for many reasons. First of all, they are very simple cells, devoid of nucleus or any organelles: they are pictured as soft bags, made of a lipid bilayer linked to a cortical cytoskeleton, used to transport hemoglobin. Moreover, important progress has been achieved in the structural characterization of the RBC skeleton (1–5). It is organized as a roughly hexagonal lattice underlying the membrane, made of flexible spectrin filaments linked together by short stiff actin protofilaments, band 4.1 proteins, and tropomyosin. This network is linked via band 4.1 proteins or ankyrins to integral proteins embedded in the lipid membrane, the main ones being sialoglycoproteins and band 3 proteins (Fig. 1). These links are dynamics and characterized by their dissociation and association rates, koff ∼ min and kon ∼ ms, respectively. Because kon ≫ koff, the integral proteins are seen to be bound to the cytoskeletal nodes. This structure, specific to the RBCs, provides peculiar mechanical properties: they are able to stand very high shear rates, up to 1000 s−1, when traveling through capillaries thinner than their own size. Nevertheless, it allows us to study the mechanical behavior of an archetypal fluid membrane linked to a cortical elastic network via discrete attachment points: specific integral membrane proteins.
FIGURE 1.
Typical sketch of the RBC membrane, seen from the cytoplasmic side (see text for details).
Since the pioneering work of Hochmuth et al. (6) on RBCs, different membrane tether extrusion (MTE) techniques (among which extrusion by flow, mechanical or optical tweezers, etc.) have been applied on various cell types such as RBCs (7), neutrophils (8,9), neurons (10,11), and outer hair cells (12) and also on lipid vesicles (13–16). It is now well established from previous works on RBCs (17–19) that the formation of a membrane tether involves the detachment of the underlying cytoskeleton and subsequently allows the measurement of the membrane-cytoskeleton static adhesion energy (19,20). This has been generalized to other cell types. Here, we extrude membrane tethers from RBCs using a hydrodynamic technique. The cell is anchored at the tip of a microneedle and submitted to a liquid flow in a microchannel. As the Stokes friction force carries the cell away, a membrane tether attached to the tip of the needle is extruded from the cell body. Varying the flow velocity, this hydrodynamic extrusion allows extruding tethers in a broad range of forces without the need for a force transducer (13–16).
Our aim here is to understand the mechanisms involved in tether extrusion from cells and the role of ATP in RBCs' membrane mechanics. ATP is an omnipresent molecule that plays a role in various active processes in the cell. In the RBC, it is responsible for the asymmetric distribution of phospholipids between the two leaflets of the membrane (21), which is involved in cell shape maintenance and membrane stability (resistance to destruction under long-lasting load) (22,23). ATP is also involved in phosphorylation of various skeletal and membranous proteins, which regulates membrane stability but does not directly shape changes (24,25). Additionally, ATP has been shown to play an important role on membrane and bare cytoskeleton fluctuations solely by its action on the nodes of the cytoskeletal network (26–28), which has been explained by their ATP-dependent dissociation (29).
Nevertheless, though ATP depletion eventually leads to shape changes, intracellular ATP level is not directly related to cell morphology and ATP depletion does not lead to significant changes in important mechanical parameters of the cell membrane, such as its shear modulus, elastic area compressibility, or surface viscosity (23,30,31).
Our results bring the experimental evidence for ATP-dependent tether extrusion dynamics. In normal conditions, tether extrusion on the same RBC is reproducible and the extrusion velocity depends on the extrusion force with a power law, as observed on different cell types before (32). Under ATP depletion or inhibition conditions, we show here that the extruded membrane is not able to retract onto the cell body, which allows locally facilitated subsequent extrusions. This is consistent with the role of ATP on membrane-cytoskeleton links dynamics.
MATERIALS AND METHODS
Red blood cells
Fresh RBCs were obtained from healthy donors by finger prick. They were washed three times with phosphate-buffered-saline (PBS) 300 mOsm to discard leukocytes and plasma proteins. Then, they were suspended in PBS 300 mOsm to get discocytes, or osmotically swollen in PBS 150 mOsm to get spherocytes, at a final concentration of 5 × 10⁶ cells/mL. RBCs were used within a few hours after withdrawal.
ATP depletion was obtained by incubation of RBCs in PBS 300 mOsm complemented with inosine 10 mM and iodoacetamide 6 mM during 90 min at 37°C (28). Iodoacetamide is a powerful inhibitor of glyceraldehyde-3-phosphate dehydrogenase and inosine, an efficient substrate for ATP. The first one inhibits the glycolytic ATP production whereas the second consumes it. This leads to irreversible reduction of the intracellular ATP to a level of 1–5 μM in <1 h at 37°C (33). After this treatment, a significant proportion of cells had lost their pure discoidal shape.
ATP inhibition was obtained by incubation of RBCs in PBS 300 mOsm complemented with 30 μM vanadate (trisodium orthovanadate) during 15 min at room temperature before manipulation in the same medium. Orthovanadate is a known inhibitor of ATPases and phosphotyrosine phosphatases. After this treatment, shapes changes were moderated.
MTE technique
During the past decades, different strategies have been adopted to extrude tethers from cells. We can distinguish two main cases. In the first one, the tether is extruded by a bead, locally attached to the cell body, that is pulled away at constant velocity by a mechanical or an optical tweezer while the cell is maintained by suction in a micropipette (7,19,20). In the second case, the cell only is sparsely adhered on a substrate (6,17) or anchored at the tip of a microneedle (our case) and is pulled away by hydrodynamic flow in a channel.
The differences of the second approach compared with the first are the following:
Neither the extrusion velocity nor the membrane tension of the object are imposed by the setup; both of them are free to adapt during tether extrusion and retraction. In contrast, a tweezer imposes the length and velocity of the tether while a micropipette generally sets the membrane tension of the aspirated cell.
The Stokes friction exerted on the whole cell body and applied at the cell-tether neck directly equals the extrusion force. In contrast, an optical tweezer measures the force exerted at the other end of the tether, which equals the extrusion force at the cell-tether neck under the assumption that force transduction through the tether is instantaneous. Another advantage is that hydrodynamic extrusion may be applied on an assembly of cells for parallel measurements since no force transducer is needed.
The Stokes friction on a RBC is given by
 |
(1) |
where η = 10−3 Pa s is the outer medium viscosity, U the flow velocity,  the velocity of the cell, R its larger radius, and K′ a form factor. By taking 6π as a prefactor in Eq. 1, the cell is considered as a rigid body, as it has been shown successful in the case of giant vesicles (14–16): there is no global fluid recirculation inside the cell since the fluid membrane has a shell-like structure. Unless preswollen, the RBC is assumed to shape as an oblate revolution ellipsoid with a large radius R = 4 μm, a small radius r = 1 μm = R/β, and the form factor given by (34)
 |
(2) |
We find K′ ≃ 0.7. This means that compared with a spherical object of radius R, the Stokes friction force on a RBC is 30% lower.
Additionally, as we will see below, the extrusion velocity  is much smaller than the flow velocity U, so that the friction force is only determined by U.
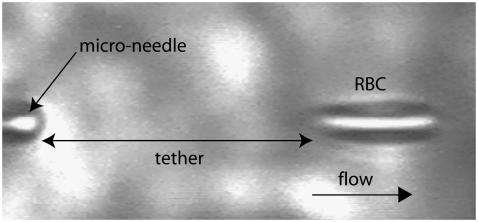
Microneedles were made from glass rods using a horizontal laser pipette puller (model No. P-2000, Sutter Instrument, Novato, CA) and by breaking off the tips with a microforge at the desired diameter (1–3 μm). Tips were immersed in a 0.1% w/v polylysine solution (Sigma Diagnostics, St. Louis, MO) during a few minutes before use, which allowed the cell to stick on the needle thanks to nonspecific interactions. The flow chamber was made from a channel-shaped piece of PDMS sheet (Sylgard 184, Dow Corning, Midland, MI) between two clean glass cover slides. The channel (section ∼150 × 103 mm2, length ∼1 cm) was filled with PBS (300 or 150 mOsm, η = 10−3 Pa s). Cells were suspended in a reservoir connected to one end of the channel, where the microneedle was introduced. The other end of the channel was connected to a syringe that pumped the liquid at a given velocity, virtually up to U ∼ 2000 μm/s. The practical range of forces explored is f ≃ 50–200 pN. All experiments were made at room temperature. Tether extrusion dynamics were monitored in transmission microscopy with a CCD camera (Cohu, San Diego, CA) and recorded with a VCR (Fig. 2). Sequences of interest were digitized and analyzed using Scion Image Software with homemade macros.
FIGURE 2.
Videomicrograph of a tether extrusion from a RBC by hydrodynamic flow.
RESULTS
Extrusion and retraction dynamics on healthy RBCs
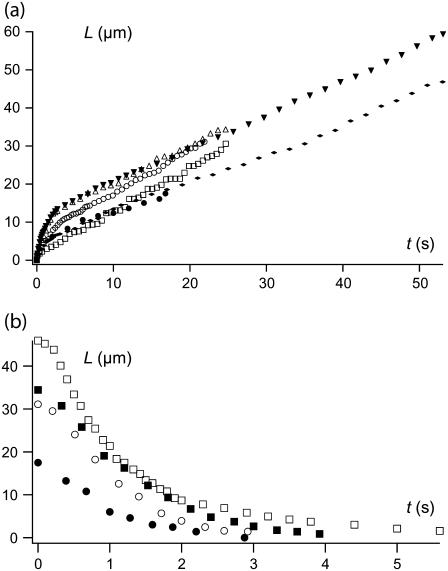
When a sufficient step of flow velocity is applied, the cell body is carried away by the flow but remains anchored to the tip of the microneedle by a thin, invisible, membrane tether. The dynamics of extrusion are shown on Fig. 3 a. After a short nonsystematic transient regime, the extrusion velocity is very low, lying between 0.03 and 3 μm/s as a function of the extrusion force. The extrusion velocity remains constant until the extraction is arbitrarily stopped to observe the retraction (or when the anchoring point breaks). The maximum lengths reached lie at ∼80 μm. The RBC retracts to its initial position, reincorporating the tether with a decreasing velocity (Fig. 3 b). With an estimation of the tether radius of rt ≃ 25 nm (20), the tether represents a membrane surface area lying at ∼12 μm2. This is not negligible compared to an estimate of the apparent surface area of 140 μm2 for the whole cell body (35,36). However, the constant extrusion velocity clearly shows that the hidden membrane reservoir that provides tether surface is able to stand such tether lengths without any significant increase of membrane tension, which is radically different from a vesicle under the same conditions: its membrane tension increases with tether-lengthening up to a stationary length, where the membrane tension balances the extrusion force (14). The absence of dependence between extrusion velocity and cell membrane tension was also observed on pipette-aspirated swollen RBCs, where no effect of imposed membrane tension could be seen on tether extrusion dynamics (19).
FIGURE 3.
(a) Extrusion dynamics of successive tethers from the same RBC at a flow velocity 1080 μm/s. Each symbol corresponds to one extrusion. After a short nonsystematic transient regime, extrusion velocity is low and constant. (b) Retraction dynamics of successive tethers from the same RBC. Each symbol correspond to one retraction.
As many cycles as possible of extrusion-retraction are successively applied on every cell, up to five in general (Fig. 3 a). Extrusion follows the previous retraction within a second, with no time for the cell to rest. Extrusion velocities are somewhat scattered and the existence of a short transient regime is sometimes observed. Nevertheless, no monotonous variation of the extrusion velocity is observed through the successive cycles, meaning no ageing phenomenon at this timescale.
ATP depletion or inhibition
Same extrusion-retraction cycles are applied on ATP-depleted (iodoacetamide + inosine treatment) or -inhibited (vanadate treatment) RBCs. The first extrusion shows no difference with healthy RBCs: after a nonsystematic transient regime, the extrusion velocity is low and constant. Subsequent extrusion cycles show differences with the healthy RBC case.
Extrusion follows two distinct steps:
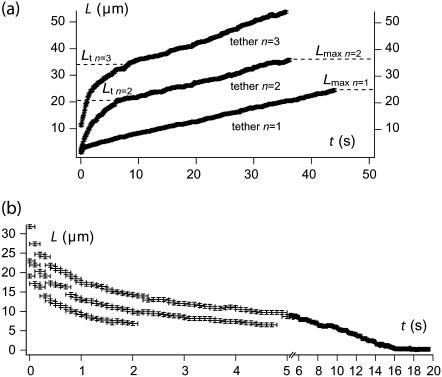
Up to a length Lt: the RBC is rapidly carried away by the flow, showing weak resistance to membrane extrusion. Beyond Lt, the tether growth velocity slows down to reach the stationary value of the previous extrusion cycle (Fig. 4 a).
Tether retraction often drastically slows down before complete tether reincorporation (Fig. 4 b). Then, the cell body either slowly recovers its initial position, remains in its actual position or derives in the channel, apparently detached from its anchoring point.
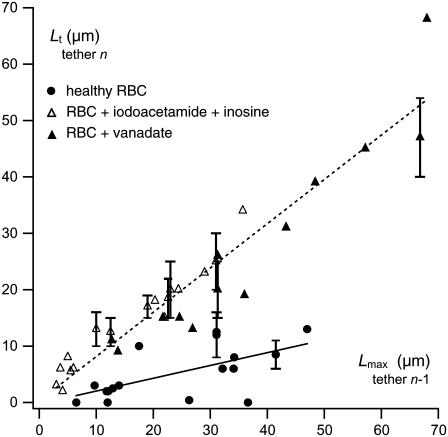
The two-step extrusion behavior is a remarkable difference from healthy RBCs. The transition length Lt for the cycle n is plotted as a function of the maximum length Lmax reached at the previous extrusion cycle n − 1 in Fig. 5. In comparison, the length Lt for healthy RBCs, as defined by the beginning of the constant extrusion velocity regime after the short transient regime (when observed), is plotted as a function of the maximum length Lmax of the previous tether. For ATP-depleted or -inhibited cells, we observe a strong correlation between Lt and Lmax and they are nearly equal (Lt ≃ Lmax). On the other hand, for healthy cells, Lt and Lmax are not, or very weakly, correlated and Lt remains small. In other words, the membrane surface that is seen to be strongly affected by ATP depletion or inhibition, and does not rebind to the cytoskeleton, corresponds to the surface that has been pulled out by previous extrusion. In contrast, for healthy cells, the amount of extruded membrane surface at cycle n − 1 has no significant influence on the extrusion dynamics of cycle n.
FIGURE 4.
(a) Successive tether extrusion dynamics from the same ATP-depleted RBC at a flow velocity 900 μm/s. Resistance to tether extrusion is progressively lost, as characterized by the increase of Lt from one cycle to the next one. (b) Retraction dynamics of a tether from the same ATP-depleted RBC. Retraction slows down before complete reincorporation of the tether. In rare cases, additional waiting allows the tether to be reincorporated very slowly in the cell body.
FIGURE 5.
Correlation between maximum tether length Lmax at cycle n − 1 and regime transition length Lt at cycle n as defined on Fig. 4 a for ATP-depleted/inhibited RBCs compared to healthy RBCs. Each data point corresponds to a pair of successive extrusions. In a few cases, the transition between the two regimes is softer than usual so that the length Lt cannot be defined precisely. In these cases, an error bar is added, representing this imprecision. ATP-depleted/inhibited data corresponds to 30 extrusion pairs obtained on 11 different cells and healthy RBCs data corresponds to 17 extrusion pairs obtained on 11 different cells. ATP-depleted/inhibited cells data are fitted with a dotted line of slope 0.79 ± 0.05, healthy cells data are fitted with a solid line of slope 0.23 ± 0.07. These fits mean that Lt and Lmax are significantly closer to each other but also more correlated for ATP-depleted/inhibited RBCs than for healthy RBCs.
Under ATP depletion or inhibition, retraction is perturbed so that the tether does not completely reincorporate the cell body within the typical 5 s observed for healthy cells. Waiting for additional slower reincorporation usually results in the loss of the cell that detaches from the tether. Thus, estimating the effect of the resting time between extrusions on the possible recovery of healthy dynamics is difficult. In one case, we were able to wait for complete reincorporation after 20 s but no recovery was observed.
The important features of the extrusion behavior under ATP depletion or inhibition are that 1), the perturbation of the dynamics is localized over a delimited surface area of the membrane; and 2), this surface area is determined by the mechanical solicitation applied on the cell. For these reasons, it is unlikely that this behavior is a result of the ATP-dependent modification of the properties of the membrane fluid component only. Indeed, if this was the case, we would expect that tether extrusion would affect all the membrane, by diffusion, and the subsequent extrusion dynamics would not only be modified over the previously extruded membrane surface area. In contrast, the localization of the perturbed surface implies a nonfluid component of the cell, which is affected by the combination of ATP depletion or inhibition and tether extrusion, namely the cytoskeleton.
It has been evidenced in earlier works that ATP depletion or inhibition affects the cytoskeleton and is subsequently responsible for changes in cytoskeleton and membrane fluctuations (26,28). The molecular target for ATP implied in these fluctuations is the complex made of short actin filaments, proteins 4.1, and other proteins, located at the nodes of the spectrin network and linked with the glycoproteins embedded in the membrane. The mechanism proposed to account for the ATP-dependent fluctuations of the cytoskeleton and the membrane is the dynamical association and dissociation of these transient nodes (29).
Evidence for unbinding of integral proteins from the cytoskeleton have also been shown in mechanically deformed cells: sickled RBCs (37) and RBC vesiculation (38). Here, we show that ATP is necessary for the recovery of RBCs mechanical properties after tether extrusion. This suggests that MTE is a way to probe integral proteins unbinding dynamics. The way ATP metabolism perturbation affects the extrusion dynamics will be discussed in the light of an enhanced model for tether extrusion.
Extrusion velocity-extrusion force relation
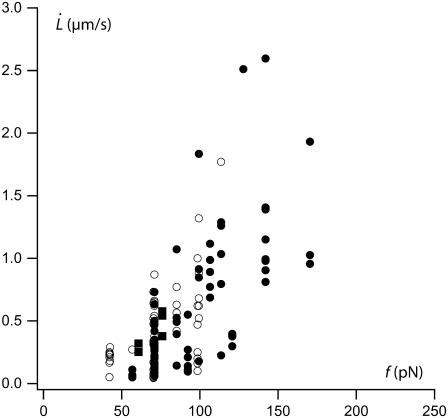
Extrusion velocity  is plotted as a function of extrusion force f in Fig. 6. Extrusion force and velocity ranges are the same for healthy, preswollen or ATP-depleted RBCs (as measured after Lt).
FIGURE 6.
Tether extrusion velocity as a function of extrusion force. (Solid circles) Healthy RBCs (73 extrusions on 44 cells); (open circles) ATP-depleted RBCs (55 extrusions on 25 cells); and (solid squares) osmotically swollen RBCs (five extrusions on three cells).
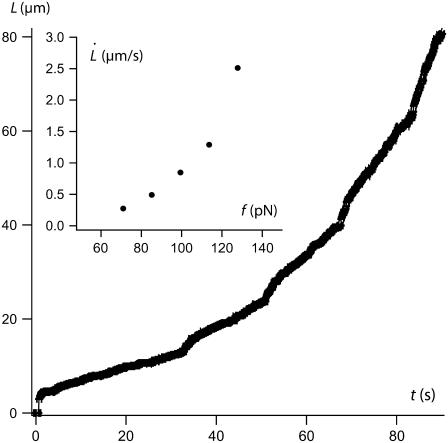
As previously observed before (20), there is an important scattering for data obtained among the whole population of probed cells. Hidden by this scattering, a nonlinear dependence of extrusion velocity as a function of extrusion force is, however, evidenced by increasing the extrusion force step by step on a single tether, as shown in Fig. 7. This nonlinear behavior has already been evidenced on neutrophils on large velocity-force ranges (40) but is not described by Hochmuth's prevalent model for tether extrusion (11). We have previously proposed a generalization of Hochmuth's model for large velocity-force ranges by taking into account the thinning of the tether due to the increase of membrane tension induced by membrane-cytoskeleton friction (32). This model takes into account the dynamic features of membrane-cytoskeleton nodes association. In the next section, we first remind the main results of our previous model. Then, we discuss the high extrusion velocity regime where the forced dissociation of cytoskeletal nodes from the membrane is expected to occur.
FIGURE 7.
Extrusion dynamics with increasing steps of extrusion force on a single cell. (Inset) Tether extrusion velocity as a function of extrusion force. A nonlinear behavior is evidenced.
THEORETICAL BACKGROUND
Statics of tether extrusion
Let us consider a fluid membrane of bending modulus κ and tension σ, attached to the underlying cytoskeleton with a static adhesion energy per unit area W0. We first recall the main features of the thermodynamic limit of tether extrusion at a velocity 
The energy F of a membrane tether of length L and radius rt detached from the underlying cytoskeleton is
 |
(3) |
The first term is the curvature energy when the initially quasi-planar membrane is curved into the tether, the second term represents the excess surface energy to increase the tether length, and the third term takes into account the static membrane-cytoskeleton adhesion energy W0. Here is neglected the compression of the cytoskeleton due to the loss of cell-body membrane. The compression of the cytoskeleton would scale as a tension in Eq. 3 that would increase as a function of tether length. However, as shown by the experimental results, extrusion velocity is constant in the range of explored tether lengths, whereas an increase of membrane tension due to cytoskeleton compression would lead to a decrease in extrusion velocity as the tether grows. The reason is that RBCs have a large excess of membrane area and that cytoskeleton detaches from the membrane when the tether is extruded. Though tether growth can consume up to 10% of membrane surface, the cytoskeleton is not compressed by 10%. This would require very long tethers to significantly compress the spectrin cytoskeleton. In contrast, the elasticity of the cytoskeleton may be assayed by cell suction into a micropipette (39). In that case, both membrane and cytoskeleton are aspirated within the pipette, which directly implies extension of the cytoskeleton.
F is a function of the length and the radius of the tether. If we choose as independent parameters its length L and volume  we can write
 |
(4) |
The force f0 = (∂F/∂L)Ω derived from Eq. 3 is
 |
(5) |
The effective membrane tension in the tether is then σt = σ + W0.
The pressure in the tether p = − (∂F/∂Ω)L, derived from Eq. 3 is
 |
(6) |
To eliminate rt, we assume fast equilibrium between the Laplace pressure in the cell body: pbody = 2σ/R and the pressure p in the tether. Since pbody ≃ 0, Eq. 6 leads to the classical expression for the tether radius (11,41,42):
 |
(7) |
Finally, from Eqs. 5 and 7, one finds
 |
(8) |
This expression, established in Hochmuth et al. (11), is currently used to extract the static adhesion energy W0.
Dynamics of tether extrusion
Let us consider a membrane in which are embedded integral proteins dynamically bound to the underlying cytoskeleton of mesh size ξ. The surface density of bound integral proteins is ν ∼ ξ−2 (Fig. 1).
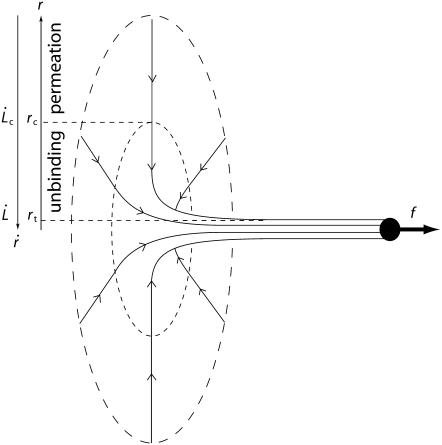
When a tether is formed at a constant velocity  the work of extrusion includes curvature energy, surface energy, and static adhesion energy as well as viscous losses. At low velocity, the dissipation is entirely controlled by the membrane flow through the unperturbed integral proteins (32). At high velocity, we show here that the membrane flow toward the tether exhibits two regimes of viscous dissipation, pictured in Fig. 8:
Distal permeation regime. Far from the tether, the membrane velocity is low. The lipids flow through the integral protein network.
Proximal sliding regime. Near the tether, the velocity becomes large and integral proteins can be torn out from the cytoskeleton by the membrane flow.
FIGURE 8.
Schematic view of tether extrusion from a cell membrane: the lipid bilayer flows from the cell body toward the tether. Length and velocity scales are detailed in the text.
Distal permeation regime
Due to the lipid conservation, the velocity of the fluid membrane at a radial distance r from the tether axis is  The bilayer permeates through the integral protein network, also dragging a thin sheet of cytosol through the underlying cytoskeleton. The friction force of the membrane flow per unit area in a two-dimensional network is given by the Darcy law
  where ηe (Pa s m) is a surface viscosity taking into account both pure bilayer and underlying cytosol flows contributions (32).
The corresponding dissipation occurs over a surface delimited by the size of the cell R and a critical radial distance rc where  is the critical radial velocity of the fluid membrane below which the permeation regime applies, as discussed in the next section:
 |
(9) |
Note that this expression is similar to the one derived by Hochmuth (11) where the viscous drag between the membrane and the cytoskeleton was characterized by a friction coefficient called slip-viscosity ηsc (Pa s/m). Here, the membrane viscosity ηe is simply related to ηsc by ηsc = νηe and allows us to emphasize on the density of membrane-cytoskeleton links.
Distal/proximal regimes crossover
As shown by Evans (43), the most probable rupture force φ for an individual molecular bond is related to its dissociation velocity  as
as  where a ∼ 1 nm is the maximal bond length beyond which the complex dissociates, and V1 = V0 exp(– B/(kBT)) is the dissociation velocity under no load. With B ∼ 20 kBT as a standard activation energy and V0 ∼ 10 m/s as a typical thermal velocity, we obtain V1 ∼ 0.01 μm/s.
The friction force per integral protein fv/ν increases linearly with the membrane flow velocity  whereas the tearout force φ increases as ln
  Because the friction force is applied over the whole cell surface by the membrane flow, where the stochastic process of single bond association-dissociation is averaged on an large assembly of nodes, we can derive a force threshold φc at which the mean rupture force equals the friction force:
 |
(10) |
This defines the critical extrusion velocity  and the corresponding radial distance rc. Below
  the integral proteins are globally seen by the flowing membrane to be immobilized with the cytoskeleton; in other words, membrane-cytoskeleton bonds dissociation and association rates, koff and kon, are unperturbed by the flow. Above
  the dissociation rate is imposed by the membrane flow velocity,
  where zb is the working distance of the pulling force.
Proximal sliding regime
For  over a membrane surface delimited by rt and rc, the tension gradient is deduced from the energy loss per unit time and area
  which is the product of the work of the tearout force and the dissociation rate. It leads to
 |
(11) |
Note that  as soon as
  The increase of membrane tension between rt and rc is
 |
(12) |
which can be approximated by
 |
(13) |
where φc is given by Eq. 10.
Membrane peeling
At the cell-tether neck, the integral proteins are torn out from the cytoskeleton by a force  and carried into the tether with the membrane. This gives rise to a final peeling work:
 |
(14) |
General expression of the extrusion force
The general expression for the tension in the tether is
 |
(15) |
Let us estimate the contributions of Δσs and Wd.
According to Eq. 10, we have
 |
(16) |
Equation 16 shows that the two contributions are comparable, but since R ≫ rc, Δσs is smaller than Δσp (by a factor of ∼5). It shows that sliding is less dissipative than permeation.
At high velocities, the contribution of the peeling work  is negligible compared to
  According to Eq. 14, we have
 |
(17) |
For rigid bonds,  This shows that the peeling work is negligible in this case, since zb < rt and, by definition of
  For soft bonds, the peeling work may be dominant if zb > rt (see Appendix for details).
Consequently, even if integral proteins slide with the membrane against the cytoskeleton within the surface delimited by rc, the permeation between R and rc still governs the dynamics of tether extrusion (Fig. 8). The sliding regime only affects the dynamics by reducing the permeation area.
Then, the extrusion force rewrites as
 |
(18) |
Additionally, the increase of tension induces a thinning of the tether radius, according to Eq. 7:
 |
(19) |
Then, the general expression for the dynamic extrusion force is
 |
(20) |
where f0 is the static extrusion force (Eq. 8). Along with the knowledge of structural parameters of membrane and cytoskeleton such as the bending modulus κ and the density of binders ν, this allows for the estimation of the surface viscosity ηe, the static extrusion force f0, and subsequently the static membrane-cytoskeleton energy W0, from  data sets.
In the limit where the extrusion force f is significantly higher than the static force f0, Eq. 20 rewrites as
 |
(21) |
As discussed in our previous work (32), we find a simple power law that describes tether extrusion on various cell types over a wide range of tether extrusion velocities. Additionally, we show here that extrusion dynamics are not modified by the proximal sliding regime.
ANALYSIS AND DISCUSSION
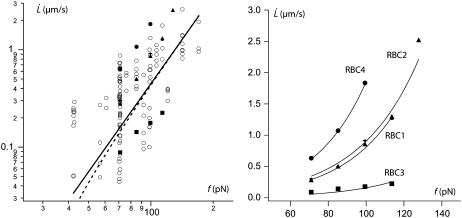
For the RBC, we know the values for the bending modulus κ = 50 kBT = 2 × 10⁻¹⁹ J (44). The density of cytoskeleton nodes lies at ν ≃ 5 × 102μm−2. We take ln(R/rc) ∼ 5 as an estimate of the logarithmic factor. Fig. 9 represents  experimental data, in log scale from all RBCs and in linear scale from four individual cells upon which increasing velocity steps extrusion was carried out. Data are fitted with Eq. 21 or Eq. 20 with f0 = 25 pN. The values for the floating parameter ηe are reported in Table 1.
FIGURE 9.
Membrane permeation model versus experiments. (Left) Log plot of  data for all RBCs. (In black) Four individual RBCs shown on the right. Data are fitted with Eq. 21 (solid line) or Eq. 20 with f0 = 25 pN (dotted line). (Right) Linear plot of
  for four individual RBCs. Data are fitted with Eq. 20 with f0 = 25 pN.
TABLE 1.
Surface viscosities ηe and critical velocities  obtained from the experimental
  data with the tether extrusion model dominated by the permeation regime
As shown by the similar values of ηe with both fits, the data do not deviate far enough from the power law to allow the precise determination of f0. It is thus inappropriate to extrapolate the dynamic measurements  to infer the static force f0 and subsequently, the adhesion energy W0. Nevertheless, the static force f0 may be determined by static extrusion experiments with micropipette-tweezer apparatus (20,45). Here, we have chosen the value f0 = 25 pN determined for unswollen RBCs (45). However, choosing f0 = 50 pN, as determined for swollen RBCs (20), would not have significantly changed the value of ηe.
The  data are somewhat scattered, as are the values for ηe; nevertheless, data obtained on single cells (RBCs 1–4) show two important features:
The power law is valid for each cell, which means that, regardless of the values for the physical parameters of the model, the permeation model holds and the extrusion mechanism is the same.
However, the scatter between cells means that the physical parameters involved in the permeation, namely the density of binders ν, the surface viscosity ηe, and the bending modulus κ, are likely to vary from one cell to another.
The origin of these variations may be due to cell age and history, which are known for RBCs to alter their mechanical properties (46).
From the membrane viscosity, it is possible now to estimate with Eq. 10 the critical velocity  above which bonds are torn out by the flow: the values are reported in Table 1. It appears that usual extrusion velocities spread above this threshold, thus integral proteins are very likely to be torn out by the membrane flow near the tether.
The  data obtained on ATP depleted or inhibited cells for the first extrusion or above the transition length Lt are not significantly different from those obtained on healthy cells (Fig. 6). Thus, the mechanical parameters of freshly extruded membrane are not affected by ATP metabolism perturbation. In the light of our model, this means that the bending modulus κ, the density of bound nodes ν, and the surface viscosity ηe are not significantly different with or without intracellular ATP. This is consistent with earlier observations on RBCs' membrane mechanics (23,30,31).
Nevertheless, ATP depletion or inhibition affects extrusion and retraction by preventing complete retraction and facilitating subsequent extrusion (Fig. 4). In other words, a lack of ATP locally perturbs the exchange of membrane between the cell body and the tether. Since the fluid bilayer properties are not significantly different with or without ATP, the cytoskeleton is expected to play a key role. In particular, ATP inhibition by vanadate affects predominantly its ATPase activity, which is a property of the actin of the nodes, and to a lesser extent the phosphorylation of membrane and cytoskeleton (28). Additionally, actin ATPase activity has been proposed to rule the cytoskeletal nodes dissociation to explain the effects of ATP depletion and inhibition on RBCs membrane fluctuations (29).
We propose the following mechanism for extrusion: in healthy conditions, integral proteins continuously unbind and rebind onto the cytoskeleton. The unbinding rate is koff within the permeation zone and k→ within the sliding zone. The binding rate is in any case kon, larger than the unbinding rate. The extrusion dynamics are governed by the permeation regime, which is more dissipative than the sliding regime. During retraction, ATP-dependent cytoskeletal node dynamics makes them available for rebinding onto the free membrane proteins from the tether. The association of free integral proteins and cytoskeletal nodes is the force that drives tether retraction, at least partially. Rebinding is energetically favorable but has to be catalyzed by ATP-dependent processes that dissociate existing nodes. After an extrusion-retraction cycle, the cytoskeletal rearrangement allows the cell to recover a similar state as before and extrusion is reproducible.
Under ATP inhibition or depletion, experimental results suggest that cytoskeletal node dynamics are frozen. In agreement with previous work (29), we propose that the lack of ATP keeps the bond proteins in a structural state where the barrier energy for dissociation B is high. Subsequently, their association and dissociation rates are decreased, though the ratio kon/koff remains constant. With or without ATP, the overall amount of effective links between the membrane and the cytoskeleton ν remains unchanged; thus, ATP depletion or inhibition has no influence on the first extrusion, which is governed by lipid permeation through the integral proteins. In contrast, once the tether extruded, frozen links are not able to unbind and rebind fast enough for the cytoskeleton to reorganize and to absorb the free membrane surface coming back from the tether. There is no driving force for tether retraction but a residual contribution probably due to membrane tension, which only allows for partial retraction. This results in an unbound membrane reservoir, the size of which depends upon the length of extruded tether. Subsequent extrusion first draws membrane from this reservoir until it is empty, then additional membrane is provided by permeation through the immobilized integral proteins. Consequently, extrusion is facilitated over the length previously extracted, as shown on Figs. 4 and 5, and then driven again by permeation as in the healthy case.
Eventually, this suggests an explanation for the fast and short transient regime observed at the beginning of extrusion for healthy RBCs: this may be seen as the signature of a residual and transient cytoskeleton-unbound membrane reservoir.
Further experiments may be addressed to confirm the role of actin ATPase and node dissociation on tether extrusion and retraction dynamics. The DNase I is known to inhibit the ATPase activity by binding on the pointed end of the actin, which is also connected to protein 4.1 (28). However, DNase I does not permeate through membranes. Inhibitor penetration requires the use of RBCs' ghosts, which in turn may affect other membrane properties and change tether extrusion dynamics.
CONCLUSION
We have extruded membrane tethers from healthy and ATP-depleted or -inhibited RBCs. We find that their behavior is identical for the extrusion of the first tether. The nonlinear relationship between the extrusion force and the extrusion velocity is interpreted by a model taking into account the thinning of the tether radius due to membrane permeation through integral proteins bound to the cytoskeleton. We also show that the membrane flow can tear out integral proteins from the cytoskeleton near the tether neck, although this does not affect the dynamics.
Additional extrusions on the same cell exhibit drastic differences between healthy and ATP-depleted or -inhibited RBCs. For healthy cells, the extruded membrane reincorporates in the cell body, which is followed by reproducible extrusion-retraction cycles, whereas for ATP-depleted or -inhibited cells, the extruded membrane is not able to reincorporate properly, which is followed by faster extrusion over the previously extruded tether length.
It is known that integral proteins-cytoskeleton association and dissociation dynamics are ATP-dependent; we now bring experimental evidence of the need of functional cytoskeletal rearrangements for RBC mechanical properties recovery after tether extrusion. We propose that membrane-tether extrusion and retraction from RBCs in physiological conditions are accompanied by the unbinding and rebinding of the integral proteins, whereas under ATP depletion or inhibition conditions, cytoskeletal nodes are frozen and cytoskeleton rearrangement drastically reduced.
This shows that even for the simplest cell, membrane physical properties that are often considered as passive are actually controlled by the cell metabolism. Other common eukaryotic cells are even more complex than RBCs, thus their membrane properties are even more likely to be actively controlled. Preliminary experiments on a fibroblast cell line have shown that extrusion velocity, and subsequently membrane-cytoskeleton adhesion, depends on the time interval between successive extrusions.
Acknowledgments
We thank N. Gov, D. Cuvelier, P. Nassoy, and E. Karatekin for critical suggestions on experiments and manuscript, and E. Tabdanov, S. Dufour, and J.-P. Thiery for fruitful discussions on membrane-cytoskeleton interactions.
This work was supported by a grant (No. JR/MLD/MDV-P05/4) from the Association pour la Recherche sur le Cancer to N.B.
APPENDIX: FLEXIBLE BONDS
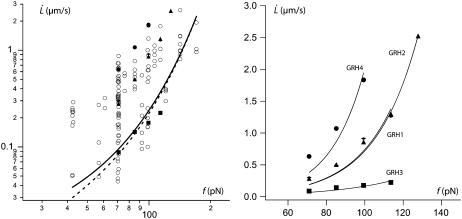
We may consider the membrane-cytoskeleton bonds to be flexible or the local stretching of the cytoskeleton network near the tether to contribute to the membrane peeling. In both cases, the tearout force of a single bond is exerted over a length zb which is, in the limit of linear response, proportional to the force zb = φ/κf, where κf is a spring constant. The peeling work then rewrites as
 |
(22) |
If we consider that  the extrusion force and the tether radius rewrite as
 |
(23) |
 |
(24) |
The extrusion force depends on the extrusion velocity as
 |
(25) |
Fig. 10 represents  data points fitted with Eq. 22, V1 = 0.01 μm/s and f0 = 0 or f0 = 25 pN. The floating parameter κf for f0 = 25 pN is given in Table 2.
FIGURE 10.
Soft bond unbinding model versus experiments. (Left) Log plot of  data for all RBCs. (In black) Four individual RBCs shown on the right. Data are fitted with Eq. 25 with f0 = 0 (dotted line) or f0 = 25 pN (solid line). (Right) Linear plot of
  for four individual RBCs. Data are fitted with Eq. 25 with f0 = 25 pN.
TABLE 2.
Cytoskeleton spring constant κf and regime threshold parameter (Wd/Δσp)max obtained from the experimental  data with the tether extrusion model assuming flexible bonds between membrane and cytoskeleton
| Cell | κf × 104 (N/m) | (Wd/Δσp)max |
|---|---|---|
| RBC1 | 2.5 ± 0.1 | 0.69 |
| RBC2 | 2.46 ± 0.03 | 0.63 |
| RBC3 | 1.0 ± 0.1 | 1.11 |
| RBC4 | 3.8 ± 0.2 | 0.62 |
| all | 1.3 ± 0.1 | 0.85 |
Is the inequality Wd/Δσp ≫ 1 satisfied? We rewrite Eq. 17, replacing Wd by Eq. 22, the radius rt by Eq. 24 and since we do not know the factor ηe in Δσp, we use the relation given by Eq. 10. We get
 |
(26) |
Since we are in the peeling regime,  and the
  -dependent factor is maximized for
  the smallest experimental value of
  We also take the maximum value for the
  -dependent factor. With these values and the value of κf deduced from the fit of data by Eq. 25, we get an upper estimation for Wd/Δσp, given in Table 2. The above-mentioned hypothesis is not fulfilled in most cases, and even for RBC3, we get a ratio close to 1 whereas the hypothesis is Wd/Δσp ≫ 1. Thus, even if bonds are soft, they do not play a significant role in extrusion dynamics for RBCs. The values of κf given above are very approximative although the order of magnitude is reasonable compared to the spring constant of a spectrin filament.
Nevertheless, this analysis may provide an alternative model for tether extrusion dynamics on other systems. In such a case, this would allow the estimation of the cytoskeleton elasticity and the activation energy of a membrane-cytoskeleton link.
Editor: Akihiro Kusumi.
References
- 1.Hainfeld, J., and T. Steck. 1977. The sub-membrane reticulum of the human erythrocyte: a scanning electron microscope study. J. Supramol. Struct. 6:301–311. [DOI] [PubMed] [Google Scholar]
- 2.Lux, S. 1979. Dissecting the erythrocyte membrane cytoskeleton. Nature. 281:426–429. [DOI] [PubMed] [Google Scholar]
- 3.Gratzer, W. 1981. The erythrocyte membrane and its cytoskeleton. Biochem. J. 198:1–8. [DOI] [PMC free article] [PubMed] [Google Scholar]
- 4.Byers, T., and D. Branton. 1985. Visualizations of the protein association in the erythrocyte membrane skeleton. Proc. Natl. Acad. Sci. USA. 82:6153–6157. [DOI] [PMC free article] [PubMed] [Google Scholar]
- 5.Liu, S.-C., L. Derick, and J. Palek. 1987. Visualization of the hexagonal lattice in the erythrocyte membrane skeleton. J. Cell Biol. 104:527–536. [DOI] [PMC free article] [PubMed] [Google Scholar]
- 6.Hochmuth, R. M., N. Mohandas, and P. L. Blackshear. 1973. Measurement of the elastic modulus for red cell membrane using a fluid mechanical technique. Biophys. J. 13:747–762. [DOI] [PMC free article] [PubMed] [Google Scholar]
- 7.Hochmuth, R. M., H. C. Wiles, E. A. Evans, and J. T. McTown. 1982. Extensional flow of erythrocyte membrane from cell body to elastic tether: II. Experiment. Biophys. J. 39:83–89. [DOI] [PMC free article] [PubMed] [Google Scholar]
- 8.Shao, J.-Y., and R. M. Hochmuth. 1996. Micropipette suction for measuring picoNewton forces of adhesion and tether formation from neutrophil membranes. Biophys. J. 71:2892–2901. [DOI] [PMC free article] [PubMed] [Google Scholar]
- 9.Shao, J.-Y., and J. Xu. 2002. A modified micropipette aspiration technique and its application to tether formation from human neutrophils. J. Biomech. Eng. 124:388–396. [DOI] [PubMed] [Google Scholar]
- 10.Dai, J., and M. Sheetz. 1995. Mechanical properties of neuronal growth cone membrane studied by tether formation with optical tweezers. Biophys. J. 68:988–996. [DOI] [PMC free article] [PubMed] [Google Scholar]
- 11.Hochmuth, R. M., J.-Y. Shao, J. Dai, and M. P. Sheetz. 1996. Deformation and flow of membrane into tethers extracted from neuronal growth cones. Biophys. J. 70:358–369. [DOI] [PMC free article] [PubMed] [Google Scholar]
- 12.Li, Z., B. Anvari, M. Takashima, P. Brecht, J. H. Torres, and W. E. Brownell. 2002. Membrane tether formation from outer hair cells with optical tweezers. Biophys. J. 82:1386–1395. [DOI] [PMC free article] [PubMed] [Google Scholar]
- 13.Waugh, R. 1982. Surface viscosity measurements from large bilayer vesicle tether formation: II. Experiments. Biophys. J. 38:29–37. [DOI] [PMC free article] [PubMed] [Google Scholar]
- 14.Borghi, N., O. Rossier, and F. Brochard-Wyart. 2003. Hydrodynamic extrusion of tubes from giant vesicles. Europhys. Lett. 64:837–843. [Google Scholar]
- 15.Borghi, N., E. Karatekin, I. Derényi, and F. Brochard-Wyart. 2004. Proceedings of the International School of Physics “Enrico Fermi”, Vol. CLV. F. Mallamace and H. E. Stanley, editors. IOS Press, Amsterdam.
- 16.Borghi, N., S. Kremer, V. Askovic, and F. Brochard-Wyart. 2006. Tube extrusion from permeabilized giant vesicles. Europhys. Lett. 75:666–672. [Google Scholar]
- 17.Waugh, R. 1982. Temperature dependence of the yield shear resultant and the plastic viscosity coefficient of erythrocyte membrane. Biophys. J. 39:273–278. [DOI] [PMC free article] [PubMed] [Google Scholar]
- 18.Berk, D., and R. Hochmuth. 1992. Lateral mobility of integral proteins in red blood cell tethers. Biophys. J. 61:9–18. [DOI] [PMC free article] [PubMed] [Google Scholar]
- 19.Waugh, R., and R. Bauserman. 1995. Physical measurement of bilayer-skeletal separation forces. Ann. Biomed. Eng. 23:308–321. [DOI] [PubMed] [Google Scholar]
- 20.Hwang, W. C., and R. E. Waugh. 1997. Energy of dissociation of lipid bilayer from the membrane skeleton of red blood cells. Biophys. J. 72:2669–2678. [DOI] [PMC free article] [PubMed] [Google Scholar]
- 21.Seigneuret, M., and P. Devaux. 1984. ATP-dependent asymmetric distribution of spin-labeled phospholipids in the erythrocyte membrane: relation to shape changes. Proc. Natl. Acad. Sci. USA. 81:3751–3755. [DOI] [PMC free article] [PubMed] [Google Scholar]
- 22.Sheetz, M., and S. Singer. 1974. Biological membranes as bilayer couples. A molecular mechanism of drug-erythrocyte interactions. Proc. Natl. Acad. Sci. USA. 71:4457–4461. [DOI] [PMC free article] [PubMed] [Google Scholar]
- 23.Manno, S., Y. Takakuwa, and N. Mohandas. 2002. Identification of a functional role for lipid asymmetry in biological membranes: phosphatidylserine-skeletal protein interactions modulate membrane stability. Proc. Natl. Acad. Sci. USA. 99:1943–1948. [DOI] [PMC free article] [PubMed] [Google Scholar]
- 24.Patel, V., and G. Fairbanks. 1986. Relationship of major phosphorylation reactions and MgATPase activities to ATP-dependent shape change of human erythrocyte membranes. J. Biol. Chem. 261:3170–3177. [PubMed] [Google Scholar]
- 25.Manno, S., Y. Takakuwa, K. Nagao, and N. Mohandas. 1995. Modulation of erythrocyte membrane mechanical function by β-spectrin phosphorylation and dephosphorylation. J. Biol. Chem. 270:5659–5665. [DOI] [PubMed] [Google Scholar]
- 26.Levin, S., and R. Korenstein. 1991. Membrane fluctuations in erythrocytes are linked to MgATP-dependent dynamic assembly of the membrane skeleton. Biophys. J. 60:733–737. [DOI] [PMC free article] [PubMed] [Google Scholar]
- 27.Tuvia, S., A. Almagor, A. Bitler, S. Levin, R. Korenstein, and S. Yedgar. 1997. Cell membrane fluctuations are regulated by medium macroviscosity: evidence for a metabolic driving force. Proc. Natl. Acad. Sci. USA. 94:5045–5049. [DOI] [PMC free article] [PubMed] [Google Scholar]
- 28.Tuvia, S., S. Levin, A. Bitler, and R. Korenstein. 1998. Mechanical fluctuations of the membrane-skeleton are dependent on F-actin ATPase in human erythrocytes. J. Cell Biol. 141:1551–1561. [DOI] [PMC free article] [PubMed] [Google Scholar]
- 29.Gov, N. S., and S. A. Safran. 2005. Red blood cell membrane fluctuations and shape controlled by ATP-induced cytoskeletal defects. Biophys. J. 88:1859–1874. [DOI] [PMC free article] [PubMed] [Google Scholar]
- 30.Feo, C., and N. Mohandas. 1977. Clarification of role of ATP in red-cell morphology and function. Nature. 265:166–168. [DOI] [PubMed] [Google Scholar]
- 31.Meiselman, H., E. Evans, and R. Hochmuth. 1978. Membrane mechanical properties of ATP-depleted human erythrocytes. Blood. 52:499–503. [PubMed] [Google Scholar]
- 32.Brochard-Wyart, F., N. Borghi, D. Cuvelier, and P. Nassoy. 2006. Hydrodynamic narrowing of tubes extruded from cells. Proc. Natl. Acad. Sci. USA. 103:7660–7663. [DOI] [PMC free article] [PubMed] [Google Scholar]
- 33.Lew, V., and J. Gracia-Sancho. 1989. Measurement and control of intracellular calcium in intact red cells. Methods Enzymol. 173:100–112. [DOI] [PubMed] [Google Scholar]
- 34.Happel, J., and H. Brenner. 1983. Low Reynolds Number Hydrodynamics. M. Nijhoff, editor. Kluwer, Dordrecht, The Netherlands.
- 35.Skalak, R., and S. Chien. 1987. Handbook of Bioengineering. McGraw-Hill Book Company, New York.
- 36.Fung, Y. C. 1993. Biomechanics. Mechanical Properties of Living Tissues. Springer Verlag, New York.
- 37.Liu, S.-C., L. Derick, S. Zhai, and J. Palek. 1991. Uncoupling of the spectrin-based skeleton from the lipid bilayer in sickled red cells. Science. 252:574–576. [DOI] [PubMed] [Google Scholar]
- 38.Knowles, D., L. Tilley, N. Mohandas, and J. Chasis. 1997. Erythrocyte membrane vesiculation: model for the molecular mechanism of protein sorting. Proc. Natl. Acad. Sci. USA. 94:12969–12974. [DOI] [PMC free article] [PubMed] [Google Scholar]
- 39.Discher, D. E., N. Mohandas, and E. A. Evans. 1994. Molecular maps of red cell deformation: hidden elasticity and in situ connectivity. Science. 266:1032–1035. [DOI] [PubMed] [Google Scholar]
- 40.Heinrich, V., A. Leung, and E. Evans. 2005. Nano-to-micro scale dynamics of P-selectin detachment from leukocyte interfaces: II. Tether flow terminated by P-selectin dissociation from PSGL-1. Biophys. J. 88:2299–2308. [DOI] [PMC free article] [PubMed] [Google Scholar]
- 41.Waugh, R., J. Song, S. Svetina, and B. Žekš. 1992. Local and nonlocal curvature elasticity in bilayer membranes by tether formation from lecithin vesicles. Biophys. J. 61:974–982. [DOI] [PMC free article] [PubMed] [Google Scholar]
- 42.Evans, E., and A. Yeung. 1994. Hidden dynamics in rapid changes of bilayer shape. Chem. Phys. Lipids. 73:39–56. [Google Scholar]
- 43.Evans, E. 2001. Probing the relation between force-lifetime and chemistry in single molecular bonds. Annu. Rev. Biophys. Biomol. Struct. 30:105–128. [DOI] [PubMed] [Google Scholar]
- 44.Evans, E. 1983. Bending elastic modulus of red blood cell membrane derived from buckling instability in micropipette aspiration tests. Biophys. J. 43:27–30. [DOI] [PMC free article] [PubMed] [Google Scholar]
- 45.Cuvelier, D. 2005. Cellular adhesion and membrane tubes: some dynamic, mechanical and rheological aspects. PhD Thesis. Université Pierre and Marie Curie, Paris, France.
- 46.Nash, G. B., and H. J. Meiselman. 1983. Red cell and ghost viscoelasticity. Effects of hemoglobin concentration and in vivo aging. Biophys. J. 43:63–73. [DOI] [PMC free article] [PubMed] [Google Scholar]


