

Abstract
Cells undergoing apoptosis are characterized by decreased cell size due to changes in intracellular ion concentration and rapid, aquaporin (AQP)-dependent water movement out of the cell, events required for the activation of pro-apoptotic enzymes. The current study demonstrates AQP 8 and 9 expression is significantly decreased in hepatocellular carcinoma (HCC) versus normal liver. Isolation of hepatic tumor cells (H4IIE) and hepatocytes confirmed a lack of water movement across the H4IIE cell membrane via AQPs and identified an inherent resistance of H4IIE cells to apoptotic stimuli. In contrast, hepatocytes rapidly responded to osmotic challenge through AQP-dependent water movement and underwent cell death following apoptotic stimulation.
IINDEXING TERMS (KEY WORDS): Apoptosis, Aquaporin, Hepatocellular Carcinoma, Apoptotic volume decrease
Introduction
Apoptosis is a conserved cellular process required for diverse biological functions and is differentiated from necrotic cell death by specific, highly conserved morphological and biochemical features [1, 2]. Of these, one of the earliest morphological events is pronounced cell shrinkage termed the apoptotic volume decrease (AVD) [3]. During the AVD intracellular ion concentrations are altered following inhibition of Na+/K+ ATPase in conjunction with a transient Na+ accumulation followed by the extrusion of both Na+ and K+ ions from the cell [4]. Decreased intracellular K+ is in turn required for the activation of the apoptotic caspase cascade and optimal nuclease activity [5, 6]. Changes in ion concentration in apoptotic cells also creates an osmotic gradient for water to follow resulting in the characteristic cell shrinkage.
Water crosses the plasma membrane in one of two ways; directly through the lipid bilayer (a slow, unregulated process) or via protein water channels termed aquaporins (AQPs). Since the discovery of AQPs, 13 mammalian homologs (AQPs 0–12) have been identified and are important during rapid water movement in cells [7, 8]. In hepatocytes AQP 0, 8 and 9 isoforms have been identified and have been shown to be important in the regulation of bile synthesis, secretion and modification [8–12]. Normally AQPs 0 and 8 are constitutively expressed and primarily located intracellularly while AQP 9 is constitutively expressed and locates predominantly to the basolateral membrane [8, 10–13]. Following stimulation AQP 8 translocates to the canalicular membrane which, in conjunction with basolateral AQP 9 expression, provides a conduit for transcellular water movement during bile synthesis [10, 11].
Previous studies from our laboratory demonstrate that water movement during the AVD is mediated primarily via AQPs and that plasma membrane water permeability directly affects the rate of apoptotic progression [14]. Specifically, inhibition of AQP-dependent water movement inhibits the AVD and downstream apoptotic cascades while AQP over-expression increases plasma membrane water permeability and the rate of apoptosis [14]. In addition to increased mitogenesis, transformed cells are characterized by dedifferentiation and decreased physiological function as compared to the original cell. Following transformation hepatic tumor cells lack 3-dimensional cell orientation and fail, to varying degrees, to perform the normal physiological functions of hepatocytes including the synthesis and secretion of bile. These findings led us to hypothesize that diminished AQP expression in transformed hepatic cells, in addition to decreasing the cells ability to participate in bile production, may confer increased resistance of these cells to apoptotic stimulation through a failure to undergo the AVD.
The aims of the current studies were to identify changes in expression and function of AQPs in animal models of HCC (as compared to normal liver) and determine whether AQP expression mediates differences in responsiveness to apoptotic stimuli.
Experimental Procedures
Animals
Male ACI rats (Harlan Inc., Indianapolis, IN, 175–225g) and male C57BL/6 mice (Jackson labs, Bar Harbor, MA) were used in these studies. All experiments were approved by the Institutional Animal Care and Use Committee.
Materials
MEMα cell culture medium and fetal bovine serum (FBS) were purchased from Biosource International (Camarillo, CA). An antibody specific against AQP 0 was purchased from Alpha Diagnostics (San Antonio, TX). Antibodies against AQP 8 and AQP 9 were raised and characterized in our laboratory as previously [14]. TRIzol and Superscript™ first strand synthesis kit were purchased from Invitrogen Life Technologies (Carlsbad, CA). One Step RT-PCR kits were purchased from Qiagen (Valencia, CA). RT Primers were synthesized by IDT (Coralville, IA). DEVD-afc was purchased from Kamiya Biomedical Co (Seattle, WA) and TGFβ was purchased from Upstate Biotechnology (Lake Placid, NY).
Cell Culture and Rat Model of HCC
Fresh hepatocytes were isolated from adult rats using a modification of the two-step perfusion technique as previously described [15]. The rat H4IIE hepatoma cell line was cultured in MEMα medium supplemented with FBS (10%) as previously [15]. For in vivo studies, cultured H4IIE cells (∼1×10⁶ cells) were inoculated directly into the right hepatic lobe of ACI rats resulting in reproducible tumor mass formation 14–16 days post-inoculation [15]. Sham liver tissue was established by the injection of PBS alone (0.1mls).
Immunohistochemistry
Following sacrifice normal liver (sham), normal liver from HCC animals (NL) and HCC tissue was resected, immersion-fixed in 10% (v/v) phosphate buffered paraformaldehyde, dehydrated with serial ethanol cycles and embedded in paraffin. Paraffin embedded tissue was cut into 5μm sections, mounted on slides and deparaffinized. Sections were processed for heat-induced antigen retrieval prior to sequential blocking with avidin and biotin. Sections were next incubated with anti-AQP 8 or 9 (1:500 dilution), washed in PBS and incubated with secondary antibody (goat anti-rabbit IgG, 1:200 dilution, 30 minutes 25°C) followed by tertiary antibody (streptavidin-HRP, 1:1000 dilution, 30 minutes, RT). Sections were exposed to AEC substrate (7 minutes), washed in PBS and mounted with glass coverslips.
Reverse transcription PCR (RT-PCR)
Total RNA was isolated using Trizol reagent and mRNA was isolated using an OligoTex mRNA Mini Kit. Levels of AQP mRNA were detected using a One Step RT-PCR kit as per the manufacturers protocol (Qiagen). RT-PCR was performed using primers specific against rat AQP 0, 8 and 9 using a Touchdown PCR at 24 cycles/sample. Densitometric analysis was performed using the EDAS 290 system (Kodak, Rochester, NY) and corrected for loading using a house keeper gene (β2M).
Preparation of cell lysates and immunoblotting
Samples were collected in ice-cold lysis buffer, sonicated and stored at −80°C prior to analysis as previously described [16]. Total protein concentrations in sample lysates were determined using a BCA assay and samples corrected for total protein concentration prior to loading. Following resolution using 12.5% SDS-PAGE samples were transferred to nitrocellulose and equal transfer determined using Ponceau S stain (0.1% v/v) [16]. Membranes were then exposed to antisera specific against AQP 0, 8 or 9 by placing membranes in a sealed pouch with 10mls of primary antibody at a dilution of 1:1000 on an orbital rotating platform overnight (4°C). Membranes were washed (x3) with TTBS and incubated with the secondary antibody solution (horseradish peroxidase conjugated IgG diluted in TTBS, 1:5,000–7,500) at room temperature (90 minutes). Membranes were finally washed in TTBS prior to detection with ECL detection system and film exposure. Signal intensity (optical integrated volume) was analyzed using the EDAS 290 system and corrected for equal protein loading/transfer using Ponceau S membrane stains [16].
Cell Swelling Analysis
To assess basal cell membrane water permeability hepatocytes and H4IIE cells were isolated from in vivo, re-suspended in culture medium (1×10⁶ cells/ml), incubated at 37°C (15 minutes) and initial cell size distribution analyzed by flow cytometry. Water was then added to adjust the osmolarity to 210mOsM and, following incubation (30 seconds) cell size distribution re-measured and cell size histograms overlaid for comparison. To determine whether responsiveness to osmotic challenge was due to AQP-mediated water movement, parallel experiments were performed in which freshly isolated cells were pre-treated with the non-specific AQP inhibitor HgCl2 (100μM) for 15 minutes. At the end of this period cell size distribution was measured and water was added to adjust osmolarity (210mOsM) and, following incubation (30 seconds) cell size distribution re-measured and cell size histograms overlaid for comprior to osmotic challenge [14].
Caspase Activity
Isolated H4IIE cells and hepatocytes were allowed to adhere in culture for 4 hours using DMEM with 10% (v/v) FBS (HSM), washed with PBS and stimulated to undergo apoptosis. Cells were treated with HSM, serum free medium (SFM) or SFM and TGFβ1 (10ng/ml) for 24 hours. Control cells (t=0) were incubated in HSM (4 hours) and lysates harvested. Caspase-3-like protease activity was the measured by fluorometric assay [5].
Terminal Deoxynucleotidyl Transferase Mediated dUTP Nick End Labeling (TUNEL) Assay
The TUNEL assay was performed according to the manufacturers protocol (Promega Corp, Madison, WI). Briefly, paraffin sections were cleared in hemo-D for 5 minutes and rehydrated in descending grades of ethanol, with an incubation in 0.5% NaCl solution and a final incubation in PBS. DNA was linearized with an incubation of Proteinase K (10 minutes) and labeled with the Tdt Enzyme and Nucleotide Mix as per manufacturers instructions for 1 hour at room temperature in a dark humidified chamber. Slides were then counterstained with propidium iodide. Negative control sections replaced TdT enzyme with water and were processed in an identical manner.
DEN murine model of progressive HCC development
Fifteen-day-old male C57/B6C3H mice received a single DEN injection (5mg/kg, i.p.) as previously described [17]. Animals were euthanized at 10 months and livers removed, examined and fixed for histological analysis [17].
Results
Decreased AQP Expression in HCC versus Normal Liver
Immunohistological examination of AQP expression in normal liver (NL) demonstrated the presence of AQP 8 and 9 (Figure 1a). Consistent with previous reports, AQP 8 was predominantly located intracellularly while AQP 9 was localized on the plasma membrane (Figure 1a) [8–10]. Experiments performed using an antibody against AQP 0 demonstrated the unsuitability of this antibody for PFA-fixed tissue immunohistochemistry (data not shown). To further address the expression of AQPs in HCC and normal liver we analyzed AQP 0–9 mRNA and protein expression in HCC and NL specimens and isolated HCC cells and hepatocytes. These studies demonstrated no detectable levels of AQPs 1–7 in normal liver or HCC specimens as assessed by RT-PCR and immunohistochemistry (Supplemental data). Analysis of AQP 0, 8 and 9 expression demonstrated detectable though significantly decreased AQP 8 and 9 mRNA expression in HCC samples versus NL (Figure 1b, n=4 per group, p<0.05). In contrast AQP 0 mRNA expression was not significantly different between HCC and NL tissue (Figure 1b). To confirm changes in AQP mRNA expression were cell specific we next analyzed expression in isolated hepatocytes and H4IIE cells. These data confirmed decreased AQP 8 and 9 mRNA expression in H4IIE cells versus hepatocytes and no significant differences in AQP 0 (Figure 1b, n=4 per experiment).
Figure 1. Altered Aquaporin Expression in Hepatocellular Carcinoma in vivo.

(a). Representative immunohistochemical images of normal liver (NL, x200) and hepatocellular carcinoma (HCC) tissue and surrounding histologically normal liver (NL) (x20 and x400) from the H4IIE model of HCC probed with antibodies specific against AQP 8 (left) or AQP 9 (right). (b). Representative RT-PCR analysis of AQP 0, 8 and 9 mRNA expression in histologically normal liver (NL) and HCC specimens (HCC) and freshly isolated hepatocytes (Hep) and H4IIE cells. Cumulative densitometric analysis was performed and corrected for equal loading using β2M (housekeeping gene (HK)) and data expressed as optical integrated volume (arbitrary units, n=4 separate experiments, *p<0.05 HCC versus NL, # p<0.05 Hep versus H4IIE). c) Representative immunoblot analysis of samples prepared from normal liver resected from sham operated animals (Sh), normal liver resected from HCC burdened animals (NL) and HCC tissue (HCC) using antibodies specific against AQP 0, 8 or 9. Cumulative densitometric analysis was performed and corrected for equal loading using Ponceau S staining of membranes following transfer and data expressed as optical integrated volume in arbitrary units (n=5 per group, *p<0.05 HCC versus NL and Sh).
Immunoblot analysis was next performed and demonstrated significantly increased AQP 0 expression in HCC samples as compared to both normal liver from tumor-burdened animals or sham operated animals (Figure 1c, n=5 per group, p<0.05) with no significant differences in AQP 0 expression being detected between sham and NL (Figure 1c). In contrast, AQP 8 and 9 expression, while not detectable in HCC samples by immunohistochemical analysis (Figure 1a), was detected in HCC samples by Western blot analysis (Figure 1c). While this discrepancy was not analyzed further in the current studies, one possible explanation may be that the antibodies against AQP 8 and 9 were raised against the N-terminus of the protein which, due to possible intracellular/mitochondrial AQP 8 and 9 localization in HCC, caused a failure in detection. In contrast, Western blot analysis was performed against whole cell lysates (RIPA buffer). Densitometric analysis of Western blot data demonstrated significantly decreased AQP 8 and 9 in HCC versus NL and sham (Figure 1c, n=5 per group, p<0.05). No significant differences in AQP 8 or 9 were detected between normal liver from tumor burdened and liver from sham operated animals (Figure 1c, n=5 per group).
Plasma membrane water permeability is AQP-dependent in hepatocytes and compromised in HCC cells
In hepatocyte cell populations significant cell swelling was measured 30 seconds after hypotonic osmotic challenge (Figure 2a (upper panel), representative of n=3 separate experiments performed in quadruplicate, p<0.05). In parallel experiments, incubation of hepatocytes with HgCl2 (100μM, 15 minutes) demonstrated cells failed to respond to hypotonic challenge (Figure 2a (lower panel), representative of n=3 separate experiments). Of note, in freshly isolated hepatocytes two cell peaks were routinely measured, an effect that was not observed when hepatocytes were analyzed in the presence of HgCl2 (Figure 2a). Given that the cell population was determined as >95% hepatocytes following isolation we believe that these differences may be due to changes in hepatocyte cell size that occur via AQP-dependent water movement as a result of the isolation and/or purification processes. In this instance hepatocytes that undergo pretreatment with HgCl2 are unable for water movement to occur resulting in a more consistent/uniform cell size. In contrast, analysis of freshly isolated H4IIE cells demonstrated a single peak of cells which, when placed in hypotonic solution failed to significantly swell (Figure 2b, representative of n=3 experiments).
Figure 2. Normal and transformed hepatic cells demonstrate different cell membrane water permeabilities.

a) Representative flow cytometry analysis of cell size distribution in freshly isolated hepatocytes in normotonic (black) and hypotonic (grey line overlay) solutions (upper panel). Representative cell swelling analysis of freshly isolated hepatocytes in normotonic (black) and hypotonic (grey line overlay) solutions in the presence of the non-specific AQP channel blocker HgCl2 (100μM, lower panel). b) Representative cell swelling analysis of freshly isolated H4IIE cells in normotonic (black) and hypotonic (grey line overlay) solutions.
Hepatocytes but not HCC cells respond to apoptotic stimuli
Measurement of caspase-3 activity as an indicator of apoptotic progression demonstrated that stimulation of hepatocytes with TGFβ (10ng/ml, 24 hours) led to significantly increased Caspase-3 activity versus untreated (Figure 3a, n=4 per experiment, p<0.05 versus T0). In contrast serum withdrawal (24 hours) failed to significantly increase Caspase-3 activity in H4IIE (Figure 3a, n=4 per group) while treatment with TGF-β (10ng/ml, 24 hours) led to elevated, though not significant, increases in caspase-3 activity versus HSM control (Figure 3a, n=4 per group). In all instances, Caspase-3 activity was significantly lower in H4IIE cells versus hepatocytes following apoptotic stimulation (Figure 3a, n=4 per experiment, p<0.05 versus T0). To determine the level of cell death in vivo we next performed a TUNEL assay on hepatic tissue resected from tumor burdened animals. These data demonstrate increased nuclear staining (propidium iodide) in the HCC region due to increased cell number and lack of structural organization within the tumor. In these sections a relative absence of TUNEL positive cells was detected in histologically NL and HCC tissue (Figure 3c) while a clear “border” of cells in which DNA strand breakage has occurred (TUNEL positive; T+) was detected at the HCC-NL interface (Figure 3b).
Figure 3. Increased resistance to apoptosis in HCC cells as compared to hepatocytes.
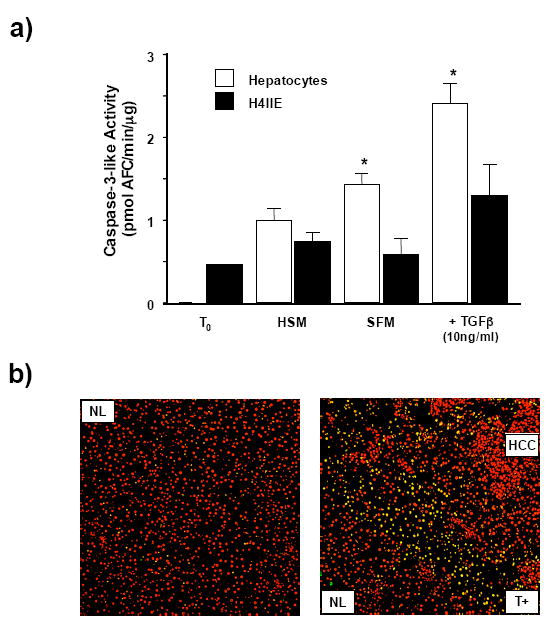
a) Caspase-3 activity was measured as an indicator of apoptotic status in freshly isolated cells (T0), cells placed in high serum (10% (v/v) FBS) media (HSM) or stimulated to undergo apoptosis by either growth factor withdrawal (SFM, 24 hours) or treatment with TGFβ (10ng/ml, 24 hours). Results are expressed as mean caspase-3 activity levels (pmol AFC/min/μg, +/− SEM, n=4 independent experiments repeated in duplicate, *p<0.05 H4IIE versus hepatocytes). b) Cell death was assessed by DNA strand breakage using a TUNEL assay in sham operated liver (left hand panel; NL) and resected HCC tissue (right hand panel). Cell nuclei are detected as red and cells with DNA strand breakage as green. Image overlay results in cells undergoing cell death (TUNEL positive (T+)) appearing as yellow bodies.
Decreased AQP expression is not unique to the H4IIE model of HCC
The rat model of HCC depends on transformed cell inoculation into the parenchyma and raises the possibility that our findings are an aberration unique to the H4IIE cell line. To address this we analyzed AQP 8 and 9 expression in a progressive mouse model (neonatal DEN) of HCC development. Unlike the rat model, several antibodies specific against AQP 8 failed to detect levels of expression significantly different from background in either NL or HCC in this model (data not shown). However, analysis of AQP 9 expression demonstrated membrane localization in hepatocytes from control animals (Figure 4). In addition, AQP 9 distribution within the hepatic lobules was not uniform, greater expression/membrane localization being detected in zone 3 than that of zone 1 and 2 (Figure 4). Analysis of tissue from DEN injected animals demonstrated that, while normal liver retained high degrees of membrane localized AQP 9 expression, HCC regions failed to express AQP 9 in any of the samples analyzed (Figure 4).
Figure 4. Altered AQP expression in HCC is not unique to the H4IIE HCC model.
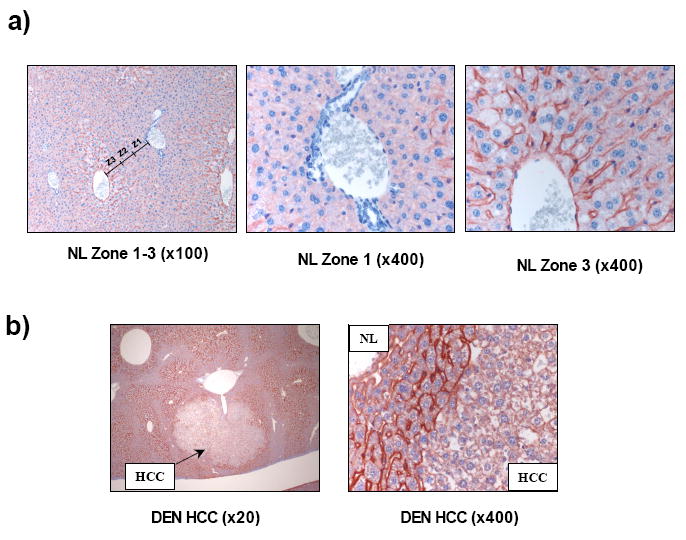
(a). Representative immunohistochemical images of normal mouse liver tissue probed with an antibody specific against AQP 9 (x100 magnification). Approximate representative hepatic lobule zones are labeled Z1, Z2 and Z3 (left panel). Increased magnification (x400) of zones 1 and 3 demonstrate increased Z3 (right panel) staining versus Z1 (center panel). (b) Representative immunohistochemical images of HCC tissue and surrounding normal liver tissue from a mouse-DEN model of HCC probed with anti-AQP 9 antibody (x20 and x400 magnification).
Elevated AQP expression in HCC cells increases responsiveness to apoptotic stimuli
We next sought to over express AQP 8 or 9 in HCC cells to confirm a central role for AQP expression during the AVD and apoptotic progression. However, prior to performing transfections, we observed that following H4IIE cell isolation and prolonged culture in the in vitro environment both AQP 8 and 9 expression was significantly increased versus freshly isolated HCC cells (Figure 5a). Furthermore, osmotic challenge of cultured H4IIE cells demonstrated rapid, AQP-dependent water movement (Figure 5b). Finally, stimulation of cultured HCC cells to undergo apoptosis (TGFβ or serum withdrawal) led to significantly increased apoptotic responsiveness versus freshly isolated H4IIE cells (Figure 5c).
Figure 5. Isolation and culture of HCC cells leads to increased aquaporin expression and responsiveness to apoptotic stimuli.
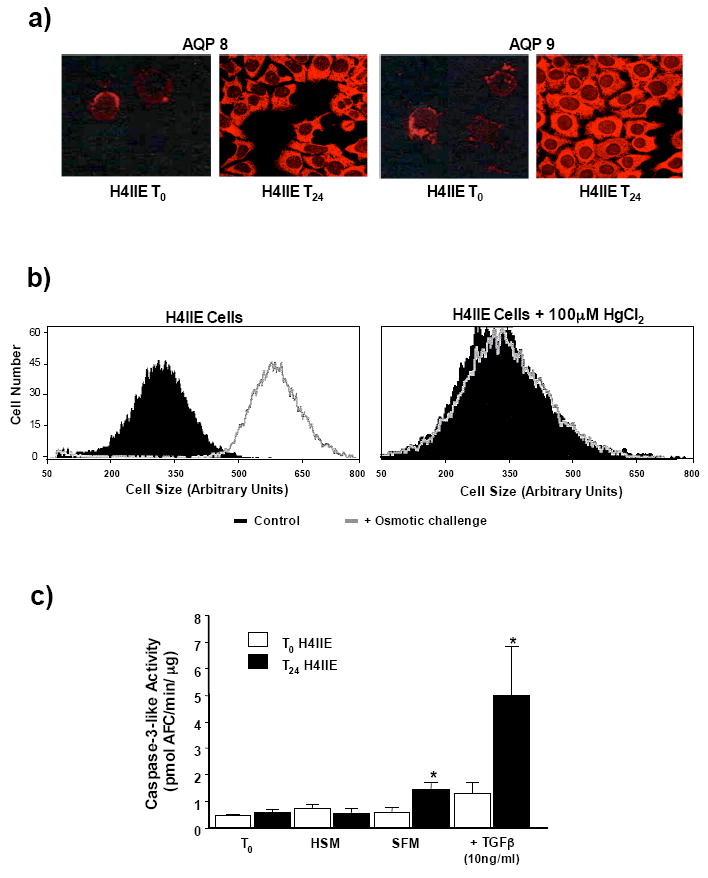
a) Representative immunofluorescent histochemical analysis of AQP 8 and 9 expression in freshly isolated H4IIE (T0) cells (upper panels) and isolated H4IIE cells following 24 hour culture in high serum media (T24, lower panels). b) Representative FACS analysis of cell size distribution of cultured (>24 hours) H4IIE cells in normotonic (black) and hypotonic (grey line overlay) solutions (upper panel). Representative FACS analysis of cell size distribution of cultured H4IIE cells in normotonic (black) and hypotonic (grey line overlay) solutions following pretreatment (15 minutes) with HgCl2 (100μM). c) Caspase-3 activity in HCC cells either directly following isolation (T0) or following 24 hour culture (T24). Cells were untreated, placed in high serum (10% FBS (v/v)) media (HSM) or stimulated to undergo apoptosis by either growth factor withdrawal (SFM) or treatment with TGFβ (10ng/ml). Results are expressed as mean caspase-3 activity level (pmol AFC/min/μg +/− SEM, n=4 independent experiments repeated in duplicate, *p<0.05 freshly isolated H4IIE versus 24 hour culture H4IIE).
Discussion
Hepatocellular carcinoma (HCC) accounts for approximately 85% of primary malignant tumors of the liver [18, 19]. Globally, HCC is the fifth most common malignancy and the third most common cause of cancer related death accounting for 600,000–1,000,000 deaths/year [18–21]. Unlike many other common malignancies HCC is somewhat unusual in that it does not demonstrate familial patterns, development occurring largely within the realms of known environmental risk factors. Of these factors exposure to viral hepatitis and/or aflatoxin and chronic alcohol abuse are the most common [20, 22, 23]. At present surgical resection or complete hepatic transplant remains the most effective treatment for HCC [19, 24]. However, the insidious nature of HCC (leading to late detection and metastasis) coupled with the lack of transplantable organs greatly limits the therapeutic options available resulting in an average survival time of less than a year for HCC patients following diagnosis [19, 20, 24, 25].
In common with other tumors HCC is characterized by an unbalancing of mechanisms that regulate proliferation and apoptosis. The apoptotic process is a highly conserved mechanism of controlled cell deletion [1–3]. Following initial apoptotic stimulation, whether endogenous or exogenous, changes in intracellular ion concentration are required for the activation of enzymes required during the apoptotic process [5, 26]. Changes in intracellular ion concentration leads to water loss from the cell and the characteristic cell shrinkage termed the apoptotic volume decrease (AVD) [2, 3]. Previous studies demonstrate loss of water from the cell during the AVD is critical to the progression of apoptosis and that water loss in apoptotic cells occurs via AQP water channels, inhibition of which abrogates the apoptotic response [14]. Conversely, over expression of AQPs increases the rate of apoptosis [14]. In the current study we report that AQP 8 and 9 expression is significantly lower in models of HCC when compared to normal liver and that these cells demonstrate diminished responsiveness to osmotic challenge and apoptotic stimulation as compared to hepatocytes. The use of Hg2+ to selectively block AQP-mediated water movement confirms water movement following osmotic challenge in hepatocytes is AQP-dependent. Collectively these data support the concept that in order for cell apoptosis to be initiated and proceed, AQP-dependent AVD is a necessary step. These studies led us to hypothesize that transfection of H4IIE cells with AQP 8 and/or 9 would lead to increased plasma membrane water permeability and renewed susceptibility to apoptotic stimulation. However, in preparation of performing these studies we observed that following isolation and culture of H4IIE cells from the in vivo environment increased AQP 8 and 9 expression occurred. Analysis of these cultured cells demonstrated a greatly enhanced ability to transport water across the plasma membrane via an AQP-dependent mechanism and significantly more responsiveness to apoptotic stimuli. While these data support our contention that diminished AQP expression may be a critical factor in resistance of hepatic tumor cells to normal apoptotic stimuli in the in vivo setting, they also raise several interesting points of discussion.
Our studies to date have focused extensively on the role of AQPs in the plasma membrane and their role during the AVD and the early events associated with apoptosis [6, 14]. In addition to regulating plasma membrane permeability recently emerging evidence suggests a role for AQPs located in the mitochondrial membrane during the apoptotic process [27–29]. While a central role for the mitochondria during apoptotic events is well established, these data suggest that mitochondrial swelling in a variety of tissues, including the liver, may be due in part to the presence of AQPs on the inner mitochondrial membrane and the presence of these AQPs may be important during apoptotic events [27, 28]. In contrast, Yang and colleagues have recently challenged the functional significance of AQPs in mitochondria [30]. In light of these studies our data raise the interesting question as to the potential role of mitochondrial versus plasma membrane AQPs during apoptosis. Our observations clearly show that in freshly isolated tumor cells decreased AQP expression is associated with lack of responsiveness to osmotic challenge corresponding to decreased apoptotic responsiveness. In this instance it is possible that the AQP 8 and 9 detected in HCC samples may be present in the mitochondria as opposed to the plasma membrane and apoptotic events, both cytoplasmic and mitochondrial, can not be activated due to the inability of cells to undergo the initial AVD. Interestingly, increased AQP 0 expression in HCC samples was detected yet did not alter membrane permeability or apoptotic responsiveness leaving the role of AQP 0 uncertain in both normal and transformed hepatic cells.
In addition to potential differences in the functional roles of AQPs due to sub-cellular localization our data show AQP 8 and 9 expression increases following tumor cell removal from the in vivo environment. At present it is uncertain what mediates decreased AQP expression in transformed hepatic cells to begin with and, why it should change so dramatically following isolation and culture. In the normal hepatocyte AQPs 0 and 8 are (predominantly) located intracellularly with AQP 9 localized to the basolateral membrane [9, 10, 12, 13, 31]. Following stimulation AQP 8 inserts into the canalicular membrane and, coupled with basolateral AQP 9, forms a conduit for rapid water movement during bile synthesis [10, 12, 13, 31, 32]. In contrast to the normal liver, HCC is characterized by decreased trabecular structure and cell orientation and diminished physiological function [19]. As such, one possible explanation of the differences in AQP expression in HCC may be that the absence of normal hepatic architecture in the tumor leads to diminished AQP 8 and 9 expression as these cells are no longer capable of participating in bile production [19].
While altered AQP expression in HCC may result from failure to perform normal functions other explanations must also be considered. Intracellular cAMP ([cAMP]i) is a ubiquitous intracellular second messenger that is synthesized from ATP by adenylyl cyclase (AC), and is (predominantly) under the dual regulation of stimulatory (Gs) and inhibitory (Gi) guanine nucleotide regulatory proteins (G-proteins) [33]. Previous reports from our laboratory report increased Gi-protein expression in human and animal models of HCC [15, 34]. Defined, sequential changes in Gi/Gs-protein expression/cAMP levels are also critical during hepatic regeneration following surgical ablation [35, 36]. While hepatic regeneration following hepatectomy is a dramatic physiological response, micro-hepatic regeneration is also critical in normal (and abnormal) liver function, especially during the onset and progression of cirrhosis [36]. In studies by Gradilone et al, stimulation of Gs-linked glucagon receptors led to canalicular membrane insertion of AQP 8 in hepatocytes [32]. In addition to regulating AQP insertion, evidence also exists that cAMP responsive elements (CREs) exist in the promoter region of several AQP isoforms [37, 38]. In this instance, decreased [cAMP]i-PKA activity (either through increased Gi or decreased Gs expression/activity) may result in decreased AQP expression due to diminished CRE expression/activity. Given this evidence, it is tempting to speculate that perturbations in [cAMP]i occurring at the cell level may alter AQP expression and/or insertion into the plasma membrane resulting in failure of the hepatocyte to synthesize bile. Should this imbalance remain the hepatocyte should be marked for apoptotic deletion and replacement. However, our data suggest that the inability to synthesize and/or insert AQPs into the plasma membrane confers inherent resistance to apoptotic stimuli. As such, AQPs may play a role during hepatocyte transformation in the setting of disease states inducing cirrhosis in which normal signaling is compromised.
The in vivo tumor demonstrates considerably less organization compared to the normal hepatic lobule architecture. Despite this observation, the tumor must also be considered to have a distinct microenvironment when compared to the liver demonstrating an independent vasculature, altered synthesis of cytokines and growth factors and different responsiveness to circulating, paracrine and autocrine stimuli [19]. As such it seems likely that removal of tumor cells from the hepatic environment to a two dimensional, non-vascularized in vitro environment, in which cell-cell contact is reduced, leads to further adaptation and change. While the mechanisms that drive these changes remain to be investigated, it is of significance to note the dramatic change in response to fundamental cellular processes such as apoptotic stimulation due, at least in part, to changes in AQP expression. These observations may in turn have far reaching implications in our understanding as to how cancerous cells respond differently to apoptotic agents in vitro versus in vivo. Finally, TUNEL analysis of in vivo tissue demonstrates a wave of dying cells at the tumor-normal liver margin. The TUNEL assay is incapable of distinguishing between cells undergoing apoptosis versus necrosis. As such the possibility exists that these dying cells are tumor cells that are distal from the developing tumor vasculature and cannot acquire the necessary nutrients or oxygen to survive and/or divide. Conversely, these cells may represent hepatocytes that are undergoing apoptosis in response to factors synthesized and released by tumor cells that demonstrate inherent apoptotic resistance due to decreased membrane AQP insertion and the inability to undergo the AVD.
In conclusion, the current study demonstrates HCC is associated with decreased AQP 8 and 9 expression and plasma membrane water permeability that correspond to a failure of HCC cells to respond to apoptotic stimulation. Given the highly conserved nature, and essential role, of the AVD during the initiation and progression of apoptosis, these data suggest a role for AQPs in conferring inherent resistance to apoptosis in HCC. These data are further supported by the isolation and culture of HCC cells that leads to increased AQP 8 and 9 expression, plasma membrane water permeability and susceptibility to apoptotic stimuli. At present, it is uncertain what underlying mechanism(s) cause the decrease in AQP 8/9 expression in transformed cells in vivo or regulate increased AQP 8/9 expression following isolation culture. However, the re-emergence of apoptotic responsiveness following culture and AQP expression makes identifying points at which AQP expression and/or insertion are regulated during transformation and/or HCC progression potential targets as a means of “reprogramming” HCC cells to be responsive to apoptotic stimuli. Finally, the demonstration that isolation and culture of cells dramatically alters AQP expression/responsiveness to apoptotic stimulation may also have significant implications in our understanding of why cells respond differently to apoptotic stimulation in vitro and in vivo.
Supplementary Material
Footnotes
Financial Support: This work was supported in part by a grant from the National Institutes of Health (NIH) CA90895 (IM)
Publisher's Disclaimer: This is a PDF file of an unedited manuscript that has been accepted for publication. As a service to our customers we are providing this early version of the manuscript. The manuscript will undergo copyediting, typesetting, and review of the resulting proof before it is published in its final citable form. Please note that during the production process errors may be discovered which could affect the content, and all legal disclaimers that apply to the journal pertain.
References
- 1.Bortner CD, Cidlowski JA. The role of apoptotic volume decrease and ionic homeostasis in the activation and repression of apoptosis. Pflugers Arch. 2004;448:313–318. doi: 10.1007/s00424-004-1266-5. [DOI] [PubMed] [Google Scholar]
- 2.Hung RW, Chow AW. Dissecting the “end game”: clinical relevance, molecular mechanisms and laboratory assessment of apoptosis. Clin Invest Med. 2004;27:324–344. [PubMed] [Google Scholar]
- 3.Maeno E, Ishizaki Y, Kanaseki T, Hazama A, Okada Y. Normotonic cell shrinkage because of disordered volume regulation is an early prerequisite to apoptosis. Proc Natl Acad Sci U S A. 2000;97:9487–9492. doi: 10.1073/pnas.140216197. [DOI] [PMC free article] [PubMed] [Google Scholar]
- 4.Bortner CD, Cidlowski JA. Caspase independent/dependent regulation of K(+), cell shrinkage, and mitochondrial membrane potential during lymphocyte apoptosis. J Biol Chem. 1999;274:21953–21962. doi: 10.1074/jbc.274.31.21953. [DOI] [PubMed] [Google Scholar]
- 5.Hughes FM, Jr, Bortner CD, Purdy GD, Cidlowski JA. Intracellular K+ suppresses the activation of apoptosis in lymphocytes. J Biol Chem. 1997;272:30567–30576. doi: 10.1074/jbc.272.48.30567. [DOI] [PubMed] [Google Scholar]
- 6.Hughes FM, Jr, Cidlowski JA. Potassium is a critical regulator of apoptotic enzymes in vitro and in vivo. Adv Enzyme Regul. 1999;39:157–171. doi: 10.1016/s0065-2571(98)00010-7. [DOI] [PubMed] [Google Scholar]
- 7.King LS, Kozono D, Agre P. From structure to disease: the evolving tale of aquaporin biology. Nat Rev Mol Cell Biol. 2004;5:687–698. doi: 10.1038/nrm1469. [DOI] [PubMed] [Google Scholar]
- 8.Masyuk AI, Larusso NF. Aquaporins in the hepatobiliary system. Hepatology. 2006;43:S75–81. doi: 10.1002/hep.20996. [DOI] [PubMed] [Google Scholar]
- 9.Calamita G, Mazzone A, Bizzoca A, Cavalier A, Cassano G, Thomas D, Svelto M. Expression and immunolocalization of the aquaporin-8 water channel in rat gastrointestinal tract. Eur J Cell Biol. 2001;80:711–719. doi: 10.1078/0171-9335-00210. [DOI] [PubMed] [Google Scholar]
- 10.Huebert RC, Splinter PL, Garcia F, Marinelli RA, LaRusso NF. Expression and localization of aquaporin water channels in rat hepatocytes. Evidence for a role in canalicular bile secretion. J Biol Chem. 2002;277:22710–22717. doi: 10.1074/jbc.M202394200. [DOI] [PubMed] [Google Scholar]
- 11.Marinelli RA, Gradilone SA, Carreras FI, Calamita G, Lehmann GL. Liver aquaporins: significance in canalicular and ductal bile formation. Ann Hepatol. 2004;3:130–136. [PubMed] [Google Scholar]
- 12.Portincasa P, Moschetta A, Mazzone A, Palasciano G, Svelto M, Calamita G. Water handling and aquaporins in bile formation: recent advances and research trends. J Hepatol. 2003;39:864–874. doi: 10.1016/s0168-8278(03)00294-0. [DOI] [PubMed] [Google Scholar]
- 13.Gradilone SA, Tietz PS, Splinter PL, Marinelli RA, LaRusso NF. Expression and subcellular localization of aquaporin water channels in the polarized hepatocyte cell line, WIF-B. BMC Physiol. 2005;5:13. doi: 10.1186/1472-6793-5-13. [DOI] [PMC free article] [PubMed] [Google Scholar]
- 14.Jablonski EM, Webb AN, McConnell NA, Riley MC, Hughes FM., Jr Plasma membrane aquaporin activity can affect the rate of apoptosis but is inhibited after apoptotic volume decrease. Am J Physiol Cell Physiol. 2004;286:C975–985. doi: 10.1152/ajpcell.00180.2003. [DOI] [PubMed] [Google Scholar]
- 15.McKillop IH, Wu Y, Cahill PA, Sitzmann JV. Altered expression of inhibitory guanine nucleotide regulatory proteins (Gi-proteins) in experimental hepatocellular carcinoma. J Cell Physiol. 1998;175:295–304. doi: 10.1002/(SICI)1097-4652(199806)175:3<295::AID-JCP7>3.0.CO;2-J. [DOI] [PubMed] [Google Scholar]
- 16.McKillop IH, Schmidt CM, Cahill PA, Sitzmann JV. Inhibitory guanine nucleotide regulatory protein activation of mitogen-activated protein kinase in experimental hepatocellular carcinoma in vitro. Eur J Gastroenterol Hepatol. 1999;11:761–768. doi: 10.1097/00042737-199907000-00014. [DOI] [PubMed] [Google Scholar]
- 17.Pierce RH, Vail ME, Ralph L, Campbell JS, Fausto N. Bcl-2 expression inhibits liver carcinogenesis and delays the development of proliferating foci. Am J Pathol. 2002;160:1555–1560. doi: 10.1016/S0002-9440(10)61101-7. [DOI] [PMC free article] [PubMed] [Google Scholar]
- 18.Kew MC. Epidemiology of hepatocellular carcinoma. Toxicology. 2002;181–182:35–38. doi: 10.1016/s0300-483x(02)00251-2. [DOI] [PubMed] [Google Scholar]
- 19.Okuda K. Hepatocellular carcinoma—history, current status and perspectives. Dig Liver Dis. 2002;34:613–616. doi: 10.1016/s1590-8658(02)80200-6. [DOI] [PubMed] [Google Scholar]
- 20.Bergsland EK, Venook AP. Hepatocellular carcinoma. Curr Opin Oncol. 2000;12:357–361. doi: 10.1097/00001622-200007000-00013. [DOI] [PubMed] [Google Scholar]
- 21.Parkin DM, Bray F, Ferlay J, Pisani P. Estimating the world cancer burden: Globocan 2000. Int J Cancer. 2001;94:153–156. doi: 10.1002/ijc.1440. [DOI] [PubMed] [Google Scholar]
- 22.Bosch FX, Ribes J, Cleries R, Diaz M. Epidemiology of hepatocellular carcinoma. Clin Liver Dis. 2005;9:191–211. v. doi: 10.1016/j.cld.2004.12.009. [DOI] [PubMed] [Google Scholar]
- 23.McKillop IH, Schrum LW. Alcohol and liver cancer. Alcohol. 2005;35:195–203. doi: 10.1016/j.alcohol.2005.04.004. [DOI] [PubMed] [Google Scholar]
- 24.Befeler AS, Di Bisceglie AM. Hepatocellular carcinoma: diagnosis and treatment. Gastroenterology. 2002;122:1609–1619. doi: 10.1053/gast.2002.33411. [DOI] [PubMed] [Google Scholar]
- 25.Davis GL, Albright JE, Cook SF, Rosenberg DM. Projecting future complications of chronic hepatitis C in the United States. Liver Transpl. 2003;9:331–338. doi: 10.1053/jlts.2003.50073. [DOI] [PubMed] [Google Scholar]
- 26.Bortner CD, Hughes FM, Jr, Cidlowski JA. A primary role for K+ and Na+ efflux in the activation of apoptosis. J Biol Chem. 1997;272:32436–32442. doi: 10.1074/jbc.272.51.32436. [DOI] [PubMed] [Google Scholar]
- 27.Lee WK, Thevenod F. A role for mitochondrial aquaporins in cellular life-and-death decisions? Am J Physiol Cell Physiol. 2006;291:C195–202. doi: 10.1152/ajpcell.00641.2005. [DOI] [PubMed] [Google Scholar]
- 28.Calamita G, Ferri D, Gena P, Liquori GE, Cavalier A, Thomas D, Svelto M. The inner mitochondrial membrane has aquaporin-8 water channels and is highly permeable to water. J Biol Chem. 2005;280:17149–17153. doi: 10.1074/jbc.C400595200. [DOI] [PubMed] [Google Scholar]
- 29.Lee WK, Bork U, Gholamrezaei F, Thevenod F. Cd(2+)-induced cytochrome c release in apoptotic proximal tubule cells: role of mitochondrial permeability transition pore and Ca(2+) uniporter. Am J Physiol Renal Physiol. 2005;288:F27–39. doi: 10.1152/ajprenal.00224.2004. [DOI] [PubMed] [Google Scholar]
- 30.Yang B, Zhao D, Verkman AS. Evidence against functionally significant aquaporin expression in mitochondria. J Biol Chem. 2006;281:16202–16206. doi: 10.1074/jbc.M601864200. [DOI] [PubMed] [Google Scholar]
- 31.Garcia F, Kierbel A, Larocca MC, Gradilone SA, Splinter P, LaRusso NF, Marinelli RA. The water channel aquaporin-8 is mainly intracellular in rat hepatocytes, and its plasma membrane insertion is stimulated by cyclic AMP. J Biol Chem. 2001;276:12147–12152. doi: 10.1074/jbc.M009403200. [DOI] [PubMed] [Google Scholar]
- 32.Gradilone SA, Garcia F, Huebert RC, Tietz PS, Larocca MC, Kierbel A, Carreras FI, Larusso NF, Marinelli RA. Glucagon induces the plasma membrane insertion of functional aquaporin-8 water channels in isolated rat hepatocytes. Hepatology. 2003;37:1435–1441. doi: 10.1053/jhep.2003.50241. [DOI] [PubMed] [Google Scholar]
- 33.Dhanasekaran N, Heasley LE, Johnson GL. G protein-coupled receptor systems involved in cell growth and oncogenesis. Endocr Rev. 1995;16:259–270. doi: 10.1210/edrv-16-3-259. [DOI] [PubMed] [Google Scholar]
- 34.Schmidt CM, McKillop IH, Cahill PA, Sitzmann JV. Alterations in guanine nucleotide regulatory protein expression and activity in human hepatocellular carcinoma. Hepatology. 1997;26:1189–1194. doi: 10.1002/hep.510260516. [DOI] [PubMed] [Google Scholar]
- 35.Diehl AM, Yang SQ, Wolfgang D, Wand G. Differential expression of guanine nucleotide-binding proteins enhances cAMP synthesis in regenerating rat liver. J Clin Invest. 1992;89:1706–1712. doi: 10.1172/JCI115771. [DOI] [PMC free article] [PubMed] [Google Scholar]
- 36.Koniaris LG, McKillop IH, Schwartz SI, Zimmers TA. Liver regeneration. J Am Coll Surg. 2003;197:634–659. doi: 10.1016/S1072-7515(03)00374-0. [DOI] [PubMed] [Google Scholar]
- 37.Wang S, Chen J, Au KT, Ross MG. Expression of aquaporin 8 and its up-regulation by cyclic adenosine monophosphate in human WISH cells. Am J Obstet Gynecol. 2003;188:997–1001. doi: 10.1067/mob.2003.214. [DOI] [PubMed] [Google Scholar]
- 38.Yamamoto N, Sobue K, Fujita M, Katsuya H, Asai K. Differential regulation of aquaporin-5 and -9 expression in astrocytes by protein kinase A. Brain Res Mol Brain Res. 2002;104:96–102. doi: 10.1016/s0169-328x(02)00322-4. [DOI] [PubMed] [Google Scholar]
Associated Data
This section collects any data citations, data availability statements, or supplementary materials included in this article.