

Abstract
Objective
To compare ultrahigh-resolution optical coherence tomography (UHR OCT) with standard-resolution OCT for imaging macular diseases, develop baselines for interpreting OCT images, and identify situations where UHR OCT can provide additional information on disease morphology.
Design
Cross-sectional study.
Participants
One thousand two eyes of 555 patients with different macular diseases including macular hole, macular edema, central serous chorioretinopathy, age-related macular degeneration (AMD), choroidal neovascularization, epiretinal membrane, retinal pigment epithelium (RPE) detachment, and retinitis pigmentosa.
Methods
A UHR ophthalmic OCT system that achieves 3-μm axial image resolution was developed for imaging in the ophthalmology clinic. Comparative studies were performed with both UHR OCT and standard 10-μm-resolution OCT. Standard scanning protocols of 6 radial 6-mm scans through the fovea were obtained with both systems. Ultrahigh-resolution OCT and standard-resolution OCT images were correlated with standard ophthalmic examination techniques (dilated ophthalmoscopy, fluorescein angiography, indocyanine green angiograms) to assess morphological information contained in the images.
Main Outcome Measures
Ultrahigh-resolution and standard-resolution OCT images of macular pathologies.
Results
Correlations of UHR OCT images, standard-resolution images, fundus examination, and/or fluorescein angiography were demonstrated in full-thickness macular hole, central serous chorioretinopathy, macular edema, AMD, RPE detachment, epiretinal membrane, vitreal macular traction, and retinitis pigmentosa. Ultrahigh-resolution OCT and standard-resolution OCT exhibited comparable performance in differentiating thicker retinal layers, such as the retinal nerve fiber, inner and outer plexiform, and inner and outer nuclear. Ultrahigh-resolution OCT had improved performance differentiating finer structures or structures with lower contrast, such as the ganglion cell layer and external limiting membrane. Ultrahigh-resolution OCT confirmed the interpretation of features, such as the boundary between the photoreceptor inner and outer segments, which is also visible in standard-resolution OCT. The improved resolution of UHR OCT is especially advantageous in assessing photoreceptor morphology.
Conclusions
Ultrahigh-resolution OCT enhances the visualization of intraretinal architectural morphology relative to standard-resolution OCT. Ultrahigh-resolution OCT images can provide a baseline for defining the interpretation of standard-resolution images, thus enhancing the clinical utility of standard OCT imaging. In addition, UHR OCT can provide additional information on macular disease morphology that promises to improve understanding of disease progression and management.
Optical coherence tomography (OCT) is an emerging medical imaging technology that can perform high-resolution cross-sectional imaging of tissue morphology in situ and in real time. Optical coherence tomography imaging is analogous to ultrasound, except that it uses light instead of sound. Measurements are performed by directing a beam of light onto tissue and measuring the echo time delay and magnitude of reflected or backscattered light using low-coherence interferometry. Cross-sectional images are generated by scanning the optical beam in the transverse direction, thus yielding a 2-dimensional data set that can be displayed as a false-color or grayscale image.1 The ability of OCT to image tissue morphology in situ and in real time, without the need to excise and process specimens, has been termed optical biopsy and has numerous potential medical applications ranging from surgical guidance to cancer diagnosis.2
In ophthalmology, OCT enables noncontact, high-resolution, cross-sectional imaging of the retina and anterior eye.3–6 Optical coherence tomography enables the direct real-time imaging of retinal pathology that could not previously be visualized in vivo. Our group and others have performed cross-sectional and longitudinal studies of a wide range of ophthalmic diseases, including macular holes, glaucoma, age-related macular degeneration (AMD), macular edema, and diabetic retinopathy.4,5,7–19 In addition to enabling the visualization of retinal pathology, OCT also enables the quantitative measurement or morphometry of retinal architecture, such as retinal or retinal nerve fiber layer (RNFL) thickness. Retinal nerve fiber layer thickness is an important early diagnostic for glaucoma and is a metric for glaucoma progression.12,20 Quantitative information on retinal thickness can be used to assess macular edema, and data can be displayed in a false-color topographic map.7
Since the introduction of commercial OCT instrumentation for retinal imaging in 1996, OCT technology has undergone multiple generations of improvement. The introduction in 2002 of the third-generation commercial OCT instrument (StratusOCT, Carl Zeiss Meditec, Dublin, CA) represented a 4-fold increase in imaging speed compared with earlier instruments. The commercial ophthalmic StratusOCT system, with ~10-μm axial image resolution, provides detailed cross-sectional information on retinal pathology.21
We have recently developed new technology that extends the resolution of OCT even further with the demonstration ultrahigh-resolution (UHR) OCT.22,23 Using a state-of-the-art femtosecond laser as the light source for imaging, axial image resolutions of ~3 μm in the human eye and up to ~1 μm in animal eyes can be achieved. The enhanced imaging capabilities of UHR OCT have the potential to improve the visualization of intraretinal architectural morphology, such as the ganglion cell layer (GCL), photoreceptor layers, and retinal pigment epithelium (RPE). Many of these structures undergo pathologic changes in retinal disease, and therefore, UHR OCT can be a powerful tool for elucidating the pathology of retinal disease. A recent study using UHR OCT to image 56 eyes of 40 patients with different macular diseases found that UHR OCT can provide important diagnostic information on intraretinal morphologic features.24 Another study, focusing on macular hole pathology and repair, compared UHR OCT with standard-resolution OCT and showed that UHR OCT can improve the visualization of photoreceptor layer morphology in macular holes.25
In this work, we describe a comparative study imaging a cross section of macular pathologies with UHR OCT and standard-resolution OCT. We have developed a research UHR OCT system that can achieve axial image resolutions of ~3 μm and can perform imaging in the ophthalmology clinic. Studies were performed comparing UHR OCT with the commercially available standard-resolution StratusOCT, which has a ~10-μm axial image resolution. A cross section of patients with macular pathologies were imaged on the same visit using both standard OCT and UHR OCT. The objective of the study was twofold. First, because standard-resolution StratusOCT is becoming widely available as a diagnostic tool in many ophthalmic clinics, one objective was to utilize UHR OCT as a baseline to aid in and establish the interpretation of standard-resolution StratusOCT images. This information would be helpful for practitioners using StratusOCT in clinical practice. Second, because UHR OCT provides enhanced resolution, a complementary objective was to identify situations where this enhanced resolution might provide additional information on the pathogenesis or management of macular diseases when compared with standard-resolution imaging techniques.
Materials and Methods
A prototype UHR OCT system suitable for performing studies in the ophthalmology clinic has been developed. In OCT imaging, the axial image resolution is determined by the coherence length of the light source, which is inversely proportional to the optical bandwidth of the light source. As the imaging light source for the UHR OCT system, we used a femtosecond titanium–sapphire laser specially developed by our laboratory that can generate a ~125-nm bandwidth centered at a 815-nm wavelength. The femtosecond titanium–sapphire laser developed for this study is unique in that it operates with much lower pump power than commercially available titanium–sapphire lasers and, therefore, can be less expensive.26 The prototype UHR OCT system using this laser light source can achieve axial imaging resolutions of <3 μm, approximately 4 times finer than standard clinical OCT systems.
The fiber-optic interferometer and other optical components in the UHR OCT system were optimized to support the broad bandwidth of the laser light source to maintain the UHR throughout the OCT system. Optical elements were also used to balance dispersion between the sample and reference arms of the interferometer to maintain UHR performance. A high-speed, high-sensitivity, low-noise electronic detection system was built to achieve high–dynamic range and high-sensitivity UHR OCT imaging. A computer controls the scanning pattern of the OCT beam on the retina, acquires data, and generates an OCT image on the display in real time. The UHR OCT prototype system is based on a slit-lamp biomicroscope that has an integrated charged-coupled device camera to provide a video image of the fundus. The patient’s eye position was established by using either internal or external fixation targets. After scanning was completed, the UHR OCT images were corrected for axial motion by comparing successive axial scans to each other to detect and correct for any axial motion by the subject. These algorithms have been used in all of the previous prototype and commercial OCT systems.3 StratusOCT images are usually not corrected for axial motion because the commercial software exports only uncorrected raw images. Because the StratusOCT can acquire an image in 1.3 seconds, as compared with 4.3 seconds in the UHR OCT system, the axial motions in the StratusOCT images are usually not significant; however, we have also developed software to correct the raw StratusOCT images in cases where axial motion is substantial.
Optical coherence tomography imaging is performed within well-established safe retinal exposure limits established by the American National Standards Institute (ANSI) standard.27 The output of the femtosecond laser light source was coupled into a 100-m-long optic fiber before entering the OCT system to increase the pulse duration and reduce peak intensities. Because the laser operates at a 50-MHz repetition rate, the output can be considered as continuous wave, rather than pulsed. The ANSI standard for safe retinal exposure accounts for wavelength, duration, and multiple exposures of the same spot on the retina. Because the laser source used in this study generates broad-bandwidth light, the shortest wavelength will have the most stringent exposure limits according to the ANSI standard. For the wavelengths and scanning conditions used in this study, the ANSI standard for maximum permissible ocular exposure is 1 mW for 700-nm center wavelengths and 1.54 mW for 800-nm center wavelengths, assuming 30 consecutive scans in the same spot. For this study, UHR OCT imaging was performed using up to 750 μW of incident optical power in the OCT scanning beam.
The imaging study was performed using the standard-resolution commercially available StratusOCT and our UHR OCT prototype in the ophthalmology clinic of the New England Eye Center of the Tufts–New England Medical Center. The study was approved by the institutional review board committees of both the Massachusetts Institute of Technology and Tufts–New England Medical Center. Written informed consent was obtained from all of the subjects in this study before UHR OCT imaging was performed. The diagnosis of macular pathology was made using standard clinical methods, including fundus examination, fundus photography, and/or fluorescein angiography. A total of 1136 eyes of 626 patients have been imaged at the New England Eye Center. Of these, 555 patients had macular disease, and a total of 1002 eyes with macular disease were imaged. Selected cases representing a cross section of macular pathologies are presented here.
The StratusOCT image was generated using scans of 2-mm axial depth and 6 mm in the transverse direction. The StratusOCT image had ~10-μm axial and 20-μm transverse resolutions in tissue and consisted of 1024 axial pixels and 512 transverse pixels. The pixel spacing was 2 μm per pixel in the axial direction and 12 μm per pixel in the transverse direction. The UHR OCT image was generated using scans with a 1.5-mm axial depth and 6 mm in the transverse direction. The UHR OCT image had ~3-μm axial and 15- to 20-μm transverse resolutions in tissue and consisted of 3000 axial and 600 transverse pixels. The pixel spacing was 0.5 μm per pixel in the axial direction and 10 μm per pixel in the transverse direction. Due to the large axial scan range of the acquired OCT images, edge regions in both StratusOCT and UHR OCT images were cropped to aid the comparison of the retinal features. The standard StratusOCT imaging protocol was followed on both systems to make a direct comparison of the resulting images. The StratusOCT images were obtained as part of the patient’s standard clinical workup by an ophthalmic photographer trained in OCT imaging. The UHR OCT images were obtained by trained personnel skilled in the operation of the prototype UHR OCT system. To make an unbiased comparison of the 2 imaging systems, best efforts were made by the operators to acquire the highest-quality images on both OCT systems. Six 6-mm-long scans of the macula were acquired by orientation at different angles separated by 30° intervals. When indicated clinically, fundus photography and fluorescein angiography were acquired, and they allowed comparison of fundus features with features in the OCT images.
Results
We present a representative example of results from the following macular pathologies: full-thickness macular hole, central serous chorioretinopathy, macular edema, AMD (nonneovascular and neovascular), RPE detachment, epiretinal membrane, vitreomacular traction and retinitis pigmentosa, and chloroquine retinopathy.
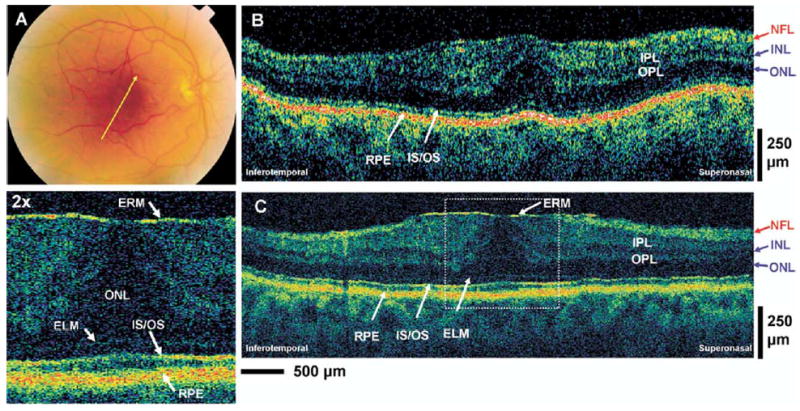
It is helpful to first consider an UHR OCT image in a normal retina to facilitate the interpretation of UHR OCT and standard-resolution OCT images. Figure 1A shows a horizontal UHR OCT image of the fovea as well as a ×2 enlargement of a portion of the image. This UHR OCT image was generated using a 1.5-mm axial depth scan and was 3 mm long in the transverse direction. This short transverse scan length yields a higher–pixel density image in the transverse direction than the standard 6-mm scan length.
Figure 1.
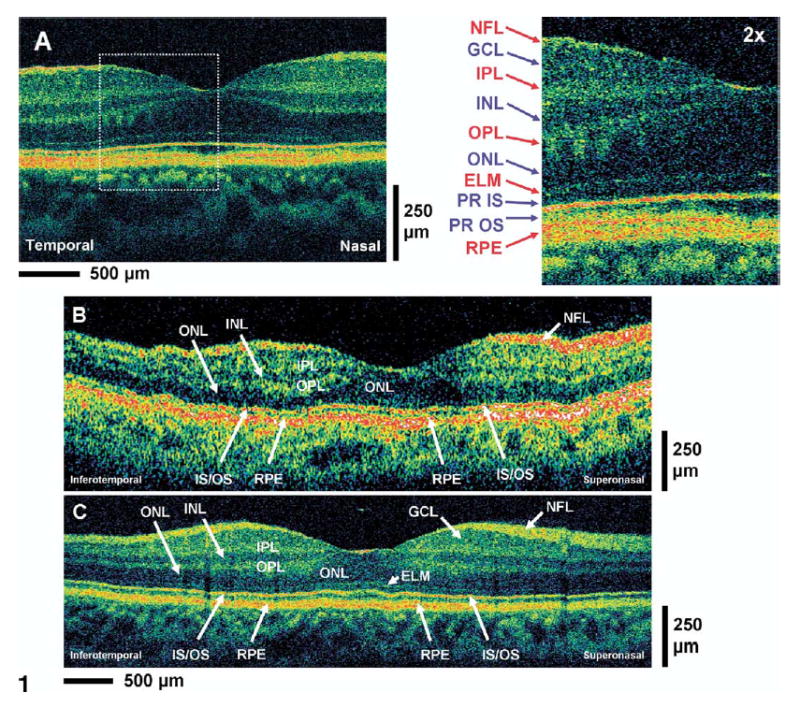
A, High-magnification ultrahigh-resolution optical coherence tomography (UHR, OCT) image of the normal human macula. An enlargement of the image demonstrates the ability to visualize intraretinal layers that can be correlated with intraretinal anatomy: nerve fiber layer (NFL), ganglion cell layer (GCL), inner plexiform layer (IPL), inner nuclear layer (INL), outer plexiform layer (OPL), outer nuclear layer (ONL), external limiting membrane (ELM), photoreceptor inner and outer segments (PR IS, PR OS), retinal pigment epithelium (RPE). Red labels indicate high-backscattering layers, blue labels, low-backscattering layers. B, C, Standard StratusOCT and UHR OCT images, respectively, of the normal human macula. Most of the major intraretinal layers can be visualized in the StratusOCT image, but the GCL and ELM are much better visualized in the UHR OCT image.
The architectural morphology of the intraretinal layers can be well differentiated in the UHR OCT image and correlates with the well-known morphology of the retina in the foveal and parafoveal regions.28 In general, the nerve fiber layer (NFL) and the plexiform layers seem to be more optically backscattering than the nuclear layers and are seen as red or white false color in OCT images.29 Animal studies have been performed comparing UHR OCT imaging to retinal histology from the pig and monkey, and intraretinal features visualized in UHR OCT have good correspondence to the intraretinal features of retinal histology obtained from animals.30,31 The first highly backscattering layer is the NFL. The 3 low-backscattering intraretinal layers are the GCL, inner nuclear layer (INL), and outer nuclear layer (ONL) and are seen as blue or black false color in OCT images. These nuclear layers are adjacent to the optically backscattering layers of the inner plexiform layer (IPL) and outer plexiform layer (OPL). The external limiting membrane (ELM) corresponds to the thin backscattering layer below the ONL. The junction between the photoreceptor inner segment (IS) and outer segment (OS) corresponds to the thin highly backscattering layer below the ELM. The reflection arising from this junction of the IS and OS may be the result of the abrupt boundary between the structures of the ISs and the highly organized OSs, which contains stacks of membranous disc that are rich in the visual pigment rhodopsin.32 This interpretation is supported in the OCT image by the increase in photoreceptor OS thickness in the foveal region that corresponds to the well-known increase in the length of the outer cone segments in this region. Outer segment thickness measurements (from ~20 μm in the parafovea to ~40 μm in the foveola) obtained from the UHR OCT image also agree well with recently published OS thickness measurements obtained from monkey and human retinal histology.32 This interpretation of the IS and OS layers is also consistent with UHR OCT findings from recent animal imaging studies.30,31 In the current study, the position of the backreflecting layers in the outer retina of UHR OCT images from cases such as macular hole (patient 1) and central serous chorioretinopathy (patient 2) further supports this interpretation of the position of the junction between the IS and OS (IS/OS). This interpretation corrects an error in our previous publication, in which the IS/OS was incorrectly identified as the RPE.23 The melanin-containing RPE very strongly backscatters and is visualized in the OCT image below the photoreceptor OS. The vascular choriocapillaris and chroidal structures are visualized as the optically backscattering structure underneath the RPE. These vascular structures scatter highly and limit the penetration of light and the imaging depth of OCT for deeper structures.
Figure 1B, C shows representative StratusOCT and UHR OCT cross-sectional images of the macula of a normal subject. Due to the long 6-mm transverse scan of the OCT images, different vertical and horizontal scaling has been utilized to display the OCT images to enhance viewing of retinal structures in the longitudinal direction. A single refractive index was assumed for all retinal layers because the exact difference in refractive index between the retinal layers is not known. Comparison of the standard-resolution OCT image (Fig 1B) with the UHR OCT image (Fig 1C) of the normal human macula shows that most major intraretinal layers such as the NFL, IPL, INL, OPL, ONL, and RPE can be visualized well in the standard-resolution OCT image. The GCL poorly backscatters and may not be as clearly visualized in the standard-resolution OCT image. The thin layer corresponding to the ELM is also not as easily visualized in the standard-resolution OCT image. However, in the foveal region, in which the distance between the ELM and RPE is larger, the ELM can sometimes be differentiated in the standard-resolution OCT image. The IS/OS highly backscatters and can be visualized in both OCT images. The RPE also highly backscatters and is visualized in both OCT images. The identification of structures such as the GCL, ELM, RPE, and IS/OS in the standard-resolution OCT image can be facilitated by using the UHR OCT image as a baseline for determining the relative locations of these layers.
Selected Case Reports
Patient 1: Full-Thickness Macular Hole
A 64-year-old woman with 20/50 vision in her left eye was diagnosed with a stage III macular hole upon clinical examination (Fig 2A). The standard-resolution StratusOCT and UHR OCT macular images in Figure 2B, C clearly visualized a full-thickness macular hole. Cystic structures associated with the macular hole are present and appear localized in the ONL and INL of the parafoveal region. The UHR OCT enables enhanced visualization of the smaller cystic structures in the ONL. External to the macular hole, the sensory retina and all the intraretinal layers appear to be normal in both standard-resolution OCT and UHR OCT images. The improved resolution in the UHR OCT image enables improved visualization and identification of the ELM, which is not clearly seen in the standard-resolution image. By following the highly backreflecting IS/OS, junction signal from the parafoveal area to the macular hole region, the UHR OCT image shows the photoreceptor OS lifting away from its normal anatomical position against the RPE layer but staying intact and connected to the rest of the sensory retina. In the region of the macular hole, there is a reduction in the normally highly backreflecting signal coming from the IS/OS that may be caused by the misalignment of this junction away from the direction of the incoming OCT beam.25 The standard-resolution OCT image does not clearly demonstrate the preservation of the photoreceptor OS in the region of the macular hole.
Figure 2.

Patient 1. A, Fundus photograph depicting a stage III macular hole and the direction of optical coherence tomography (OCT) scans. B, C, StratusOCT and ultrahigh-resolution (UHR) OCT images, respectively, of a patient with a stage III macular hole. An enlargement of the UHR OCT image demonstrates the preservation of the photoreceptor outer segment (PR OS) that has been lifted away from the retinal pigment epithelium (RPE) in the region of the macular hole. ELM = external limiting membrane; GCL = ganglion cell layer; INL = inner nuclear layer; IPL = inner plexiform layer; IS/OS = junction between the PR inner segment and OS; NFL = nerve fiber layer; ONL = outer nuclear layer; OPL = outer plexiform layer.
Patient 2: Central Serous Chorioretinopathy
A 50-year-old man with 20/20 vision in his left eye was diagnosed with central serous chorioretinopathy. Figure 3A is a late-phase fluorescein angiography fundus photograph depicting several hyperfluorescent spots, suggesting compromise of Bruch’s membrane and leakage into the subretinal space. Figure 3B, C shows standard-resolution OCT and UHR OCT images taken across the predominant hyperfluorescent area. Both OCT images clearly show the serous detachment of the sensory retina; however, all the intraretinal layers in the sensory retina appear to be intact. In addition, the UHR OCT image indicates the intact appearance of the ELM and IS/OS photoreceptor layers. The highly backreflecting line in the outer boundary of the detached retina appears to be the IS/OS. In the elevated retina, there also appears to be a highly backscattering region immediately underneath the normally sharp boundary of the IS/OS signal. This structure may be the disc membranes of the OSs, which abnormally proliferate when they are not in contact with the RPE. As expected, the RPE does not appear to be detached in both standard-resolution and UHR OCT images.
Figure 3.
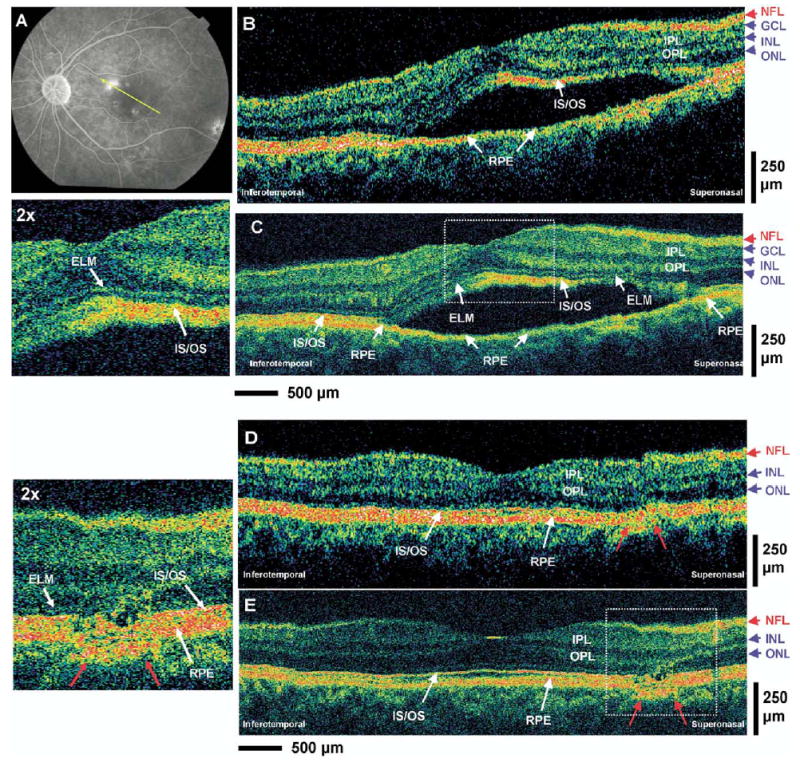
Patient 2. A, Late-phase fluorescein angiogram depicting the lesion of central serous chorioretinopathy and the direction of optical coherence tomography (OCT) scans. B, C, StratusOCT and ultrahigh-resolution (UHR) OCT images, respectively, of a patient with central serous chorioretinopathy. An enlargement of the UHR OCT image demonstrates the preservation of the photoreceptor inner segment (IS) and outer segment (OS) in the sensory retina that has separated away from the retinal pigment epithelium (RPE). D, E, StratusOCT and UHR OCT images, respectively, of the same patient after 2 months. The residual disruption of the RPE layer and the ISs and OSs of the photoreceptors (red arrows) can be clearly visualized in the enlargement of the UHR OCT image. ELM = external limiting membrane; GCL = ganglion cell layer; INL = inner nuclear layer; IPL = inner plexiform layer; IS/OS = junction between the IS and OS; NFL = nerve fiber layer; ONL = outer nuclear layer; OPL = outer plexiform layer.
Figure 4 (available at http://aaojournal.org) shows standard-resolution OCT and UHR OCT images of the same fundus location after approximately 1 month. Both OCT images show partial resolution of the central serous chorioretinopathy with decreased serous fluid accumulation under the sensory retina (yellow arrow). A disruption of the RPE layer in the superior–nasal region of the macula (red arrows) is seen much more clearly in the UHR OCT image. Figure 3D, E shows standard-resolution OCT and UHR OCT images taken at the same fundus location after approximately 2 months. Both images reveal complete recovery and disappearance of the subretinal serous fluid as well as normal appearance of all intraretinal layers. This is consistent with the recovery associated with the resolution of central serous chorioretinopathy. The UHR OCT image indicates more clearly than standard-resolution OCT a residual lesion in the RPE layers near the superior–nasal region of the macula (red arrows). An associated disruption of the ONL and photoreceptor IS and OS can also be visualized in this area in the UHR OCT image; these layers appear to be drawn towards the RPE abnormality because the ONL appears to be thinner in the region of the RPE disruption. The defect in the RPE, which corresponds to the region of dominant hyperfluorescence in the fluorescence angiogram, is the probable cause for serous leakage of fluid into the intraretinal space, and the UHR OCT image indicates that a lesion is still present even after resolution of the acute central serous chorioretinopathy.
Figure 4.

StratusOCT (A) and ultrahigh-resolution optical coherence tomography (OCT) (B) image of Figure 3’s patient after 1 month. Both images demonstrate the decreased serous fluid accumulation under the sensory retina (yellow arrow). The disruption of the retinal pigment epithelium (RPE) layer (red arrows) can be seen much more clearly in the UHR OCT image. ELM = external limiting membrane; GCL = ganglion cell layer; INL = inner nuclear layer; IPL = inner plexiform layer; IS/OS = junction between the photoreceptor (PR) inner segment and outer segment; NFL = nerve fiber layer; ONL = outer nuclear layer; OPL = outer plexiform layer.
Patient 3: Macular Edema
A 59-year-old woman with 20/50 vision in her left eye was diagnosed with cystoid macular edema (CME) and disc swelling upon clinical examination. Figure 5A is a late-phase fluorescein angiogram depicting dye leakage in the characteristic petaloid pattern in the macular region. Optical coherence tomography scans were taken in the orientation depicted in Figure 5A across the CME. Figure 5B, C shows standard OCT and UHR OCT images of the macular region. Both standard-resolution OCT and UHR OCT images clearly show the increase in retinal thickness due to the macular edema. The UHR OCT image can better differentiate finer retinal architectural morphology, such as the cystoid structures. Both standard-resolution OCT and UHR OCT show that the cystoid edema appears in the foveacentralis region, with the large (100–200 μm) cystoid structures localized mainly in the INL. The linear spanning structures in this region may represent Müller cells. Ultrahigh-resolution OCT shows smaller (~20–40 μm) cystoid structures, with sharply differentiated boundaries that appear to be present in the GCL (yellow arrow). These smaller lesions are difficult to visualize with standard-resolution OCT. The ONL appears to be thicker than normal in these images, and there is a small detachment of the photoreceptors from the RPE in the center of the fovea (red arrow). There is edema of the photoreceptor OS layers and, possibly, photoreceptor IS layers, with a corresponding change in thickness and increase in optical scattering (hyperscattering). The ELM is difficult to differentiate even in UHR OCT. In the parafoveal region, the architectural morphology of the NFL, INL, IPL, ONL, OPL, and RPE appears to be normal.
Figure 5.

Patient 3. A, Late-phase fluorescein angiogram depicting cystoid macular edema (CME) and the direction of optical coherence tomography (OCT) scans. B, C, StratusOCT and ultrahigh-resolution OCT images, respectively, of a patient with CME. A small cystoid structure (yellow arrow) can be seen in the UHR OCT image but not in the StratusOCT image. A small detachment of the outer segment (OS) from the retinal pigment epithelium (RPE) in the center of the fovea (red arrows) can be seen in the enlargement of the UHR OCT image. ELM = external limiting membrane; INL = inner nuclear layer; IPL = inner plexiform layer; IS/OS = junction between the IS and OS; NFL = nerve fiber layer; ONL = outer nuclear layer; OPL = outer plexiform layer.
Patient 4: Nonneovascular Age-Related Macular Degeneration
A 72-year-old woman with 20/25 vision in the left eye was diagnosed with nonneovascular AMD. Figure 6A is an early-phase fluorescein angiogram of the left eye depicting drusen and dye leakage associated with deterioration of the RPE and choriocapillaris. Optical coherence tomography images were taken in the orientation depicted in Figure 6A across the macular region. Figure 6B, C shows standard-resolution and UHR OCT images. Both OCT images show disruption of the RPE layer, which appears as an irregular and disrupted line in UHR OCT (Fig 6C), in sharp contrast to the characteristic smooth and straight RPE appearance of the normal eye (Fig 1). The irregularity in the RPE is from AMD-related pathology and not due to eye motion artifacts. This can be seen by comparing the contour of the RPE with the contour of the vitreoretinal interface. These RPE irregularities can be visualized with slightly better clarity in the UHR OCT image due to its higher resolution. The ELM can only be visualized in the UHR OCT image and appears to be intact. There are multiple small irregularities in the IS/OS manifest by what appears to be small bucklings (red arrows) of the highly optically scattering structure, which is interpreted as the RPE, in the region where the OSs would normally be present.
Figure 6.
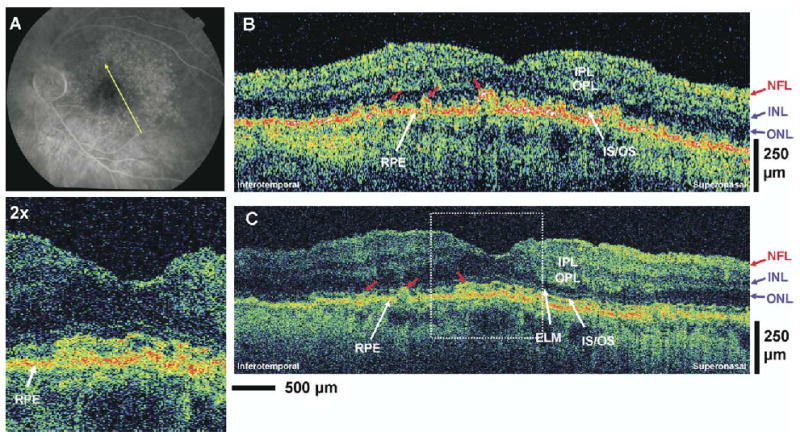
Patient 4. A, Early-phase fluorescein angiogram depicting nonneovascular age-related macular degeneration (AMD) and the direction of optical coherence tomography (OCT) scans. B, C, StratusOCT and ultrahigh-resolution OCT images, respectively, of a patient with nonneovascular AMD. Irregularities in the retinal pigment eithelium (RPE) and the inner segments (ISs) and outer segments (OSs) of the photoreceptors (red arrows) can be seen in the OCT images. ELM = external limiting membrane; INL = inner nuclear layer; IPL = inner plexiform layer; IS/OS = junction between the IS and OS; NFL = nerve fiber layer; ONL = outer nuclear layer; OPL = outer plexiform layer.
Patient 5: Neovascular Age-Related Macular Degeneration
A 55-year-old woman with 20/80 vision in the right eye was diagnosed with choroidal neovascularization. Figure 7A is a late-phase fluorescein angiogram depicting the hyperfluorescence of the new vessels near the foveal region of the right eye. Figure 7B, C shows standard-resolution OCT and UHR OCT macular images across the region of choroidal neovascularization. Both images clearly show the highly optically backscattering de novo vessels (choroidal neovascularization) extending above the RPE layer in the foveal region. The choroidal neovascularization produces a focal increase in retinal thickness and alters the normal contour of the foveal pit in this region. The architectural morphology of the intraretinal structures is more clearly differentiated in the UHR OCT image. It also shows disruptions in the RPE layer as well as the photoreceptor IS and OS near the region of the choroidal neovascularization. The IS/OS is not observable in the fovea, and neither is the ELM visible. Small irregularities in the RNFL and GCL with evidence of epiretinal membrane formation can also be observed in the UHR OCT image (red arrows) and the standard-resolution OCT image. Both standard-resolution OCT and UHR OCT images show the edema as well as the architecture of the IPL, OPL, INL, and ONL. The boundary between the GCL and the IPL is difficult to resolve in both images.
Figure 7.
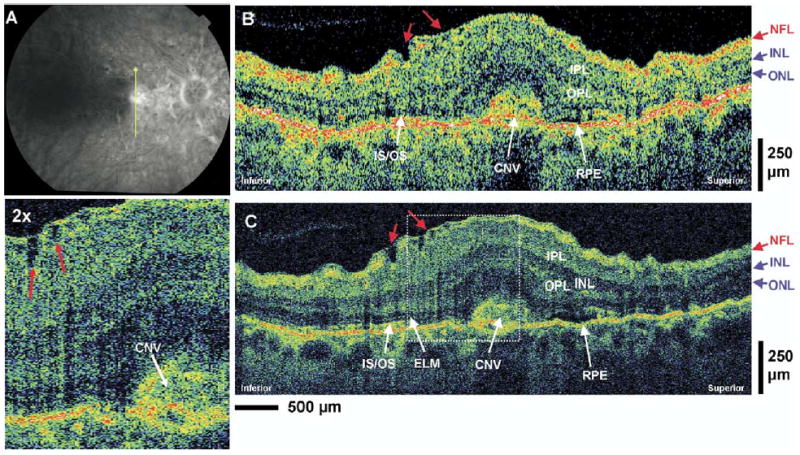
Patient 5. A, Late-phase fluorescein angiogram depicting choroidal neovascularization (CNV) and the direction of optical coherence tomography (OCT) scans. B, C, StratusOCT and ultrahigh-resolution (UHR) OCT images, respectively, of a patient with CNV. Small irregularities in the nerve fiber layer (NFL) and ganglion cell layer with evidence of epiretinal membrane formation (red arrows) can be observed in the UHR OCT image and its enlargement. ELM = external limiting membrane; INL = inner nuclear layer; IPL = inner plexiform layer; IS/OS = junction between the photoreceptor inner segment and outer segment; ONL = outer nuclear layer; OPL = outer plexiform layer.
Patient 6: Retinal Pigment Epithelium Detachment
A 77-year-old woman with 20/200 vision in her right eye was diagnosed with RPE detachment (Fig 8A). Figure 8B, C shows standard-resolution and UHR OCT images in the macular region. Both standard-resolution OCT and UHR OCT images show that the RPE appears to be detached in 2 regions (red arrows). The highly backscattering RPE layer can be seen to be separated from the underlying choroidal structures in these 2 regions. The UHR OCT image more clearly shows a very thin backscattering layer (red arrows) below the displaced RPE layer. The difference between standard-resolution OCT and UHR OCT in the visualization of this layer is more pronounced in the inferior–nasal region of the images. The anatomical position of this thin layer, underneath the detached RPE, suggests that it may be Bruch’s membrane. Finally, there is a marked loss of structure in the photoreceptor IS and OS that can be observed in both standard-resolution OCT and UHR OCT images.
Figure 8.

Patient 6. A, Late-phase fluorescein angiography depicting retinal pigment epithelium (RPE) detachment and the direction of optical coherence tomography (OCT) scans. B, C, StratusOCT and ultrahigh-resolution (UHR) OCT images of a patient with RPE detachment. The UHR OCT image more clearly shows a thin backscattering layer (red arrows) below the displaced RPE layer that is suggestive of being the Bruch’s membrane. INL = inner nuclear layer; IPL = inner plexiform layer; NFL = nerve fiber layer; ONL = outer nuclear layer; OPL = outer plexiform layer.
Patient 7: Epiretinal Membrane
An 81-year-old man with 20/25 vision in the right eye was diagnosed with epiretinal membrane. Figure 9A (available at http://aaojournal.org) is a fundus photograph of the right eye depicting the epiretinal membrane and the orientation of the OCT images. Figure 9B, C (available at http://aaojournal.org) shows the standard-resolution and UHR OCT images in the macular region. The epiretinal membrane can be seen in the UHR OCT image as the thin, highly reflective membrane at the vitreomacular interface. The epiretinal membrane appears to be applying traction, thus distorting the normal foveal pit appearance and increasing the retinal thickness in the foveal region. The epiretinal membrane is not clearly visualized in the standard-resolution OCT image; however, the effect of the epiretinal membrane causing a change in retinal thickness and foveal pit contour can readily be seen in the standard-resolution OCT image.
Figure 9.
Patient 7. A, Fundus photograph depicting the epiretinal membrane (ERM) and the direction of optical coherence tomography (OCT) scans. B, C, StratusOCT and ultrahigh-resolution (UHR) OCT images, respectively, of a patient with an ERM. The enlargement of the UHR OCT image clearly shows the thin, highly backreflecting epiretinal membrane that is not visualized in the StratusOCT image. ELM = external limiting membrane; INL = inner nuclear layer; IPL = inner plexiform layer; IS/OS = junction between the photoreceptor inner segment and outer segment; NFL = nerve fiber layer; ONL = outer nuclear layer; OPL = outer plexiform layer; RPE = retinal pigment epithelium.
Patient 8: Vitreomacular Traction
A 46-year-old woman with 20/40 vision in the left eye was diagnosed with vitreomacular traction (Fig 10A). Figure 10B, C shows standard-resolution and UHR OCT images in the macular region. Both images clearly show the posterior hyaloid vitreomacular traction causing a separation of the sensory retinal layers. The UHR OCT image shows that the separation occurs between the OPL and ONL. In both standard-resolution and UHR OCT images, distended structures (yellow arrows) spanning the separation in the sensory retina can be seen. The location of these structures suggests that they may be Müller cells, which remain connected to the retinal layers despite their physical separation. The UHR OCT image facilitates the visualization of these finer structures. The UHR OCT image shows clearly that the RPE, IS, OS, ELM, and ONL are intact despite the vitreomacular traction. This is also visible in the standard-resolution OCT image, although the architecture of the photoreceptor segments and ELM is less well demarcated. The UHR OCT image shows an area superior to the fovea that might be a separation of the OPL. There is a highly optically scattering layer adjacent to the ONL that might be a separated portion of the OPL (red arrow).
Figure 10.
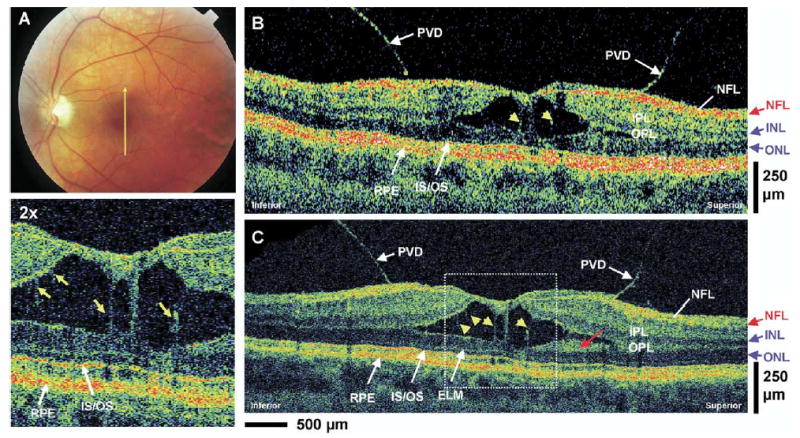
Patient 8. A, Fundus photograph depicting vitreomacular traction and the direction of optical coherence tomography (OCT) scans. B, C, StratusOCT and ultrahigh-resolution (UHR) OCT images, respectively, of a patient with vitreomacular traction. Posterior vitreous detachment (PVD) can clearly be visualized in both images. The enlargement of the UHR OCT image shows several distended structures (yellow arrows) spanning the separation of the sensory retina that are suggestive of Müller cells. A highly backscattering layer in the UHR OCT image that is adjacent to the outer nuclear layer (ONL) (red arrow) might be a portion of the outer plexiform layer (OPL). ELM = external limiting membrane; INL = inner nuclear layer; IPL = inner plexiform layer; IS/OS = junction between the photoreceptor inner segment and outer segment; NFL = nerve fiber layer.
Patient 9: Retinitis Pigmentosa
A 27-year-old woman with 20/25 vision in her right eye had an ocular history of retinitis pigmentosa (Fig 11A, B). Figure 11C, D shows standard-resolution and UHR OCT images in the macular region. Both images show that there is marked atrophy of the photoreceptor cells in the peripheral macula region. The ONL thickness appears normal in the foveal region, but the ONL becomes abnormally thin in the periphery of the macula. Other intraretinal layers such as the NFL, IPL, INL, and OPL appear relatively normal throughout the OCT images. A close examination of the UHR OCT image reveals that progressive thinning of the photoreceptor IS and OS also occurs outside of the foveal region (red arrows). The atrophy of the IS and OS prevents the highly backscattering IS/OS and the RPE layer from being clearly differentiated in the peripheral region of the macula. The progressive thinning of the IS and OS is not as clearly visualized in the standard-resolution OCT image because the ELM is not as clearly differentiated as in the UHR OCT image.
Figure 11.

Patient 9. A, B, Fundus photographs depicting the presence of pigments in the peripheral retina of a retinitis pigmentosa patient and the direction of optical coherence tomography (OCT) scans in the macular region. C, D, StratusOCT and ultrahigh-resolution (UHR) OCT images, respectively, of a patient with retinitis pigmentosa. In both images, the outer nuclear layer (ONL) thickness appears normal in the foveal region, but becomes abnormally thin in the periphery of the macula. A close examination of the UHR OCT image reveals the progressive thinning of the inner segments (ISs) and outer segments (OSs) of the photoreceptors outside of the foveal region (red arrows). An enlargement of the UHR OCT image of the retinitis pigmentosa patient clearly indicates the thinning of the ONL and photoreceptor segments when compared with an enlargement of the normal subject from Figure 1. ELM = external limiting membrane; GCL = ganglion cell layer; INL = inner nuclear layer; IPL = inner plexiform layer; IS/OS = junction between the photoreceptor IS and OS; NFL = nerve fiber layer; OPL = outer plexiform layer; RPE = retinal pigment epithelium.
Discussion
Ultrahigh-resolution OCT imaging of macular pathologies has been reported previously by Drexler et al.24 In that study, UHR OCT was used to image 56 eyes of 40 selected patients with different macular diseases, and it was found that UHR OCT can enhance visualization of intraretinal morphologic features and provide additional diagnostically important information.24 It was also demonstrated that UHR OCT can be used to evaluate the integrity of photoreceptor layers, their thickness changes, and their displacement.24 In this study, we performed a comparison between UHR OCT and the commercially available standard-resolution Stratus-OCT by imaging a cross section of macular disease pathologies in the ophthalmology clinic. Because we are comparing images from 2 separate OCT systems, efforts were made to achieve optimal patient fixation during the imaging sessions to acquire the retinal tomograms from the same locations on the fundus. Furthermore, analysis was performed only on image sets with similar OCT features that demonstrate good registration between the StratusOCT and UHR OCT systems. The goal of this study is to improve the understanding and interpretation of StratusOCT images and identify the possible advantages of UHR OCT imaging at detecting retinal pathologic features. Because UHR OCT can enhance the visualization of the photoreceptor cells in the outer retina, we have also included macular pathologies involving changes in the photoreceptor cells, such as retinitis pigmentosa, that were not reported in previous studies with UHR OCT.
In our study, both UHR OCT and standard-resolution OCT enable the real-time noninvasive visualization of all the major intraretinal layers in vivo. Ultrahigh- and standard-resolution OCTs exhibited comparable performances in differentiation of thicker intraretinal layers such as the RNFL, IPL, INL, OPL, and ONL, and both OCT images had excellent correlation with well-known retinal morphology. Compared with standard-resolution OCT, UHR OCT has an improved ability to visualize smaller structures such as the ELM, the photoreceptor IS and OS, and, possibly, Bruch’s membrane. Theses structures tend to be very thin or only weakly backscattering; therefore, they are difficult to visualize using standard-resolution OCT.
The highly scattering layer adjacent to the RPE appears to be the interface between the photoreceptor IS and OS, which is very strongly backscattering. The presence of a large reflection from the IS/OS was surprising, and this led to an incorrect interpretation of this feature as the RPE. This misinterpretation was introduced when the first in vivo OCT retinal imaging was performed in 1993.3,5 The origin of the high reflection from the IS/OS is not well understood. One possible explanation is that the OSs contain densely stacked disc membranes that have high refractive indices,32 and the change in the refractive index between the IS and OS causes the high reflection from this interface.24,25
The identification of the IS and OS in the UHR OCT images is further supported by recent studies of monkey and human retinas, using glutaraldehyde as a fixative, showing that the OS length is about 20 to 30 μm in the human foveola and only about 20% of the total retinal thickness.32 One must exercise caution in analyzing histological data regarding the lengths of the photoreceptor OSs, due to the possibility of postmortem changes caused by histological processing. An early study on the OS length in the adult human foveola obtained thickness measurements of 40 to 60 μm, and the OS seems to account for 40% of the total retinal thickness.33 However, a later study by the same author showed that the cone OSs are only 11 to 20 μm long, and the total length of the IS and OS at the parfovea region consists of only about 20% of the entire retinal thickness.34 The inconsistent results of these early studies attempting to measure OS lengths from the histological data may be contributed to the paraformaldehyde fixation of human eyes used in both of these studies. Formalin and paraformaldehyde used in early histological studies of the human eye are poor fixatives of the retina and, particularly, the OS.35 Fixation in glutaraldehyde and embedding in plastic would better facilitate the preservation of retinal morphology, including the OS.35 The more recent histological measurements using glutaraldehyde fixatives agree with the OS measurements obtained from UHR OCT images.32 In measurements obtained from Figure 1, the OS is ~40 μm thick in the foveola and accounts for 18% of the total retinal thickness. Therefore, the interpretation of the location of the IS and OS is well supported by histological data.
The identification in UHR OCT of the photoreceptor layers and interpretation of the fine structures in the outer retina are also confirmed by macular pathology cases in which the changes in retinal architectural morphology are well known. In the central serous chorioretinopathy case (Fig 3B, C), the RPE layer is not involved in the serous elevation of the sensory retina. The RPE can be seen in the OCT images as the highly backscattering layer at the bottom of the serous fluid accumulation. In contrast, the highly backscattering IS/OS can be visualized inside the elevated sensory retina in the affected region, as well as in its normal anatomical position in the unaffected adjacent macular region, in which there is no sensory retinal detachment. This finding further supports the interpretation that the first highly backscattering layer in the outer retina is the IS/OS and the second highly backscattering layer is the RPE.
The intensity of the normally highly backreflecting IS/OS also seems to depend on the orientation of the membranous discs in the OS.25 This finding is consistent with previous studies that demonstrated how photoreceptors can exhibit directional sensitive waveguiding properties.36–38 In their normal anatomical position apposed to the RPE, the membranous stacks lie perpendicular to the direction of the incoming OCT beam, and a highly backscattering signal is present at this junction (Fig 1). In the macular hole case (patient 1), this junction is highly backscattering in the region not affected by the full-thickness hole. In the region of the macular hole, the photoreceptor OS is detached and lifted away from the RPE. In this part of the OCT image, the membranous discs no longer lie perpendicular to the direction of the incoming OCT beam, and the IS/OS does not seem to backscatter highly in this region (Fig 2B, C). However, by following the highly backreflecting IS/OS from the peripheral macula into the region of the macular hole, the UHR OCT image (Fig 2C) reveals that the photoreceptor OSs are still preserved in the region of the macular hole, and the disappearance of the highly backreflecting signal does not imply that the photoreceptor segments are disrupted.25
The directional dependence of the OCT signal from the IS/OS is further demonstrated in the case of central serous chorioretinopathy (patient 2). With the serous elevation of the sensory retina (Fig 3B, C), the membranous discs in the inferotemporal region of the parafovea no longer lie perpendicular to the direction of the incoming OCT beam, and the IS/OS seems to exhibit low backscattering. In the fovea and the superior–nasal parafovea region of the retina, the OS of the elevated sensory retina appears to lie perpendicular to the direction of the incoming OCT beam, the highly backreflecting signal from the IS/OS is seen near the fovea, and the presence of the photoreceptor OS in the elevated retina can be detected. However, in the superior-nasal parafovea, the signal from the IS/OS seems to backscatter weakly, even though the OSs’ orientation is perpendicular to the incoming OCT beam. The lack of the IS/OS signal in this region of the elevated sensory retina may be caused by the disruption of the photoreceptor segments in this area, which corresponds to the predominant hyperfluorescence in the fluorescein angiogram (Fig 3A).
The pathological disruption of the RPE and photoreceptor cells in this region is more clearly indicated by UHR OCT as the central serous chorioretinopathy begins to resolve. In the OCT images of the patient taken at 1 month after the initial visit (Fig 4 [available at http://aaojournal.org]), the IS/OS of the superior–nasal parafovea seems to have high backreflection, possibly because the OS is once again perpendicular to the direction of the incoming OCT beam. The small serous accumulation of fluid (yellow arrow) still causes a small portion of the IS/OS to be misoriented and appear to backscatter weakly. In the superior–nasal parafovea, the IS/OS can be seen to be disrupted in both OCT images, and UHR OCT shows that the RPE is also disrupted (red arrows) in this region. In OCT images of the patient taken at 2 months after the initial visit (Fig 3D, E), there is a complete return of the highly backreflecting IS/OS throughout the macular scans as the OS returns to its normal anatomical position, perpendicular to the direction of the incoming OCT beam. Ultrahigh-resolution OCT imaging also reveals a localized disruption of the RPE layer in the superior–nasal parafovea, which is the probable cause of the accumulation of serous fluid that led to detachment of the sensory retina. The disruption in the RPE layer can damage the adjacent photoreceptor IS and OS, leading to a functional deficit in that region. Ultrahigh-resolution OCT and standard-resolution OCT imaging suggest a downward dragging of retinal elements to the area of the RPE disruption, whereas the architectural morphology of the elevated sensory retina in central serous chorioretinopathy remains intact and seems largely normal. This is consistent with the fact that patients usually have a favorable outcome, with recovery of visual acuity (VA), upon resolution of the condition.
Relative to standard-resolution OCT images, UHR OCT images were qualitatively superior in identifying small retinal features such as the ELM, IS/OS, epiretinal membrane, and other small pathologic changes in the retinal morphology. In the macular edema case, both standard-resolution OCT and UHR OCT images can show the abnormal elevation of the photoreceptor segments in the foveal region (Fig 5, red arrows) in addition to the cystoid edema that is mostly localized in the INL. However, the UHR OCT image can identify smaller pathologic structures (Fig 5C, yellow arrow) better than the standard-resolution OCT image. In the nonneovascular AMD case (Fig 6), UHR OCT can also identify the fine details of the RPE buckling and photoreceptor irregularity better than the standard-resolution OCT image. In the neovascular AMD case (Fig 7), UHR OCT can identify the epiretinal membrane formation (Fig 7C, red arrows) and the disruptions in the RPE and photoreceptor layers better than the StratusOCT image. In the RPE detachment case, the very thin backscattering layer (Fig 8, red arrows) underneath the elevated, highly scattering RPE is very suggestive of Bruch’s membrane. The UHR OCT image (Fig 8C) was able to visualize this thin layer more distinctly than the StratusOCT image (Fig 8B). In the epiretinal membrane case, the UHR OCT image (Fig 9C [available at http://aaojournal.org]) clearly identified the epiretinal membrane as the thin, highly reflective structure at the vitreomacular interface. The epiretinal membrane is not directly visualized in the StratusOCT image (Fig 9B [available at http://aaojournal.org]), although the abnormal effect of the membrane on the foveal pit contour and the increased thickness of the ONL in the fovea can be detected. Both OCT images show similar performances in identifying the intraretinal separation of the vitreomacular traction case (Fig 10B, C) and the preservation of the photoreceptor IS and OS. However, the UHR OCT image can identify finer retinal structures in the region of the intraretinal separation (Fig 10, yellow arrows).
Ultrahigh-resolution OCT has improved ability over standard-resolution OCT in visualizing the photoreceptor IS and OS and the photoreceptor integrity in a number of macular pathologies. The ability to visualize the detail of the photoreceptor morphology with UHR OCT may provide additional information that can help improve the understanding of the pathogenesis and management of various macular diseases. In the macular hole case (Fig 2), the preservation of the OS in the region of the full-thickness hole is visualized much more clearly in UHR OCT than in standard-resolution OCT. Ultrahigh-resolution OCT revealed that the photoreceptor IS and OS were intact in the region of the full-thickness hole, which may help to explain why reapposing the sensory retina back against the RPE through macular hole surgery can often restore VA.25 In the central serous chorioretinopathy case, the localized disruption of the photoreceptor layer and RPE is evident in the UHR OCT image after the resolution of the subretinal serous fluid accumulation (Fig 3E). In contrast, the standard-resolution OCT image (Fig 3D) of this region does not clearly indicate a disruption of the RPE layer due to the larger speckle size and lower axial resolution of the standard-resolution OCT image. The thinning of the ONL caused by the progressive atrophy of the rods and cones associated with retinitis pigmentosa (Fig 11) can be visualized directly in both standard-resolution and UHR OCT. However, UHR OCT reveals that the atrophy and thinning are also manifest in the photoreceptor IS and OS. The relatively normal appearance of the photoreceptor layers (ONL, IS, and OS) in the fovea of this patient may help to explain why the VA for this patient is 20/25 (patient 9).
The improved understanding of morphologic features visualized in UHR OCT images can be used to improve the interpretation of standard-resolution OCT images. In the RPE detachment case (Fig 8), direct visualization of the underlying Bruch’s membrane is possible with UHR OCT. Although the thin Bruch’s membrane structure is not readily visualized in the standard-resolution OCT image, the knowledge of its position in the UHR OCT image permits the interpretation of the faint reflection in the standard-resolution OCT image as Bruch’s membrane. These interpretations can then be applied to standard-resolution OCT images alone, without the need to perform UHR OCT, and can be used to enhance the diagnostic utility of standard-resolution OCT.
In this study, we employed a femtoscond titanium–sapphire laser specially developed by our laboratory as the light source to achieve ultrahigh axial image resolutions of ~3 μm. Femtosecond laser sources have excellent performance; however, they are expensive and can be difficult to operate in a clinical setting. Recently, superluminescent diode technology has improved dramatically in performance, and ultrahigh axial image resolutions of 3.1 μm in the eye have been demonstrated.39 These UHR OCT images approach the quality of images produced using femtosecond laser light sources. These superluminescent diode light sources are less expensive and more compact and robust than femtosecond lasers and, therefore, are likely to enable more widespread availability of UHR OCT imaging.
In summary, we performed the first comparison study on imaging macular pathology with UHR OCT and commercially available standard-resolution StratusOCT. Ultrahigh-resolution OCT has enhanced ability to visualize very fine intraretinal structures such as the ELM, IS/OS, and epiretinal membrane. The direct comparison of UHR OCT with standard-resolution OCT enables improved interpretation of standard-resolution OCT images and development of diagnostic criteria using standard-resolution OCT images alone. The enhanced resolution available with UHR OCT enables better visualization of intraretinal architectural morphology associated with retinal pathology. Improved visualization promises to better elucidate the structural changes that occur in disease pathogenesis, increase the sensitivity for earlier diagnosis, and improve monitoring of disease progression and response to treatment.
Acknowledgments
The authors gratefully acknowledge C. R. Baumal, T. R. Hedges III, C. Mattox, M. B. Raizman, E. Reichel, A. H. Rogers, O. S. Singh, and H. K. Wu of the New England Eye Center for providing patients for this study. They also thank A. Aguirre, S. Bourquin, R. Ghanta, P. Herz, and P. Hsiung for their participation in the development of UHR OCT imaging technology.
Footnotes
Results presented in part at: Association for Research in Vision and Ophthalmology meeting, May, 2003; Fort Lauderdale, Florida.
Supported in part by the National Institutes of Health, Bethesda, Maryland (contract nos.: R01-EY11289, R01-EY13178, P30-EY13078); National Science Foundation, Arlington, Virginia (grant no.: ECS-0119452); Air Force Office of Scientific Research, Arlington, Virginia (contract no.: F49620-98-1-0139); Medical Free Electron Laser Program, Air Force Office of Scientific Research, Arlington, Virginia (grant nos.: F49620-01-1-0186, FWF P14218-PSY, FWF Y159-PAT, CRAF-1999-70549); Massachusetts Lions Eye Research Fund Inc., New Bedford, Massachusetts; Eye and Ear Foundation, Pittsburgh, Pennsylvania; Research to Prevent Blindness, New York, New York; and Carl Zeiss Meditec, Dublin, California.
References
- 1.Huang D, Swanson EA, Lin CP, et al. Optical coherence tomography. Science. 1991;254(5035):1178–81. doi: 10.1126/science.1957169. [DOI] [PMC free article] [PubMed] [Google Scholar]
- 2.Fujimoto JG. Optical coherence tomography for ultrahigh resolution in vivo imaging. Nat Biotechnol. 2003;21:1361–7. doi: 10.1038/nbt892. [DOI] [PubMed] [Google Scholar]
- 3.Swanson EA, Izatt JA, Hee MR, et al. In vivo retinal imaging by optical coherence tomography. Optics Lett. 1993;18:1864–6. doi: 10.1364/ol.18.001864. [DOI] [PubMed] [Google Scholar]
- 4.Puliafito CA, Hee MR, Lin CP, et al. Imaging of macular diseases with optical coherence tomography. Ophthalmology. 1995;102:217–29. doi: 10.1016/s0161-6420(95)31032-9. [DOI] [PubMed] [Google Scholar]
- 5.Hee MR, Izatt JA, Swanson EA, et al. Optical coherence tomography of the human retina. Arch Ophthalmol. 1995;113:325–32. doi: 10.1001/archopht.1995.01100030081025. [DOI] [PubMed] [Google Scholar]
- 6.Izatt JA, Hee MR, Swanson EA, et al. Micrometer-scale resolution imaging of the anterior eye in vivo with optical coherence tomography. Arch Ophthalmol. 1994;112:1584–9. doi: 10.1001/archopht.1994.01090240090031. [DOI] [PubMed] [Google Scholar]
- 7.Hee MR, Puliafito CA, Wong C, et al. Quantitative assessment of macular edema with optical coherence tomography. Arch Ophthalmol. 1995;113:1019–29. doi: 10.1001/archopht.1995.01100080071031. [DOI] [PubMed] [Google Scholar]
- 8.Hee MR, Puliafito CA, Wong C, et al. Optical coherence tomography of macular holes. Ophthalmology. 1995;102:748–56. doi: 10.1016/s0161-6420(95)30959-1. [DOI] [PubMed] [Google Scholar]
- 9.Hee MR, Puliafito CA, Wong C, et al. Optical coherence tomography of central serous chorioretinopathy. Am J Ophthalmol. 1995;120:65–74. doi: 10.1016/s0002-9394(14)73760-2. [DOI] [PubMed] [Google Scholar]
- 10.Hee MR, Baumal CR, Puliafito CA, et al. Optical coherence tomography of age-related macular degeneration and choroidal neovascularization. Ophthalmology. 1996;103:1260–70. doi: 10.1016/s0161-6420(96)30512-5. [DOI] [PubMed] [Google Scholar]
- 11.Schuman JS, Hee MR, Arya AV, et al. Optical coherence tomography: a new tool for glaucoma diagnosis. Curr Opin Ophthalmol. 1995;6:89–95. doi: 10.1097/00055735-199504000-00014. [DOI] [PubMed] [Google Scholar]
- 12.Schuman JS, Hee MR, Puliafito CA, et al. Quantification of nerve fiber layer thickness in normal and glaucomatous eyes using optical coherence tomography. Arch Ophthalmol. 1995;113:586–96. doi: 10.1001/archopht.1995.01100050054031. [DOI] [PubMed] [Google Scholar]
- 13.Schuman JS, Noecker RJ. Imaging of the optic nerve head and nerve fiber layer in glaucoma. Ophthalmol Clin North Am. 1995;8:259–79. [Google Scholar]
- 14.Gaudric A, Haouchine B, Massin P, et al. Macular hole formation: new data provided by optical coherence tomography. Arch Ophthalmol. 1999;117:744–51. doi: 10.1001/archopht.117.6.744. [DOI] [PubMed] [Google Scholar]
- 15.Chauhan DS, Antcliff RJ, Rai PA, et al. Papillofoveal traction in macular hole formation: the role of optical coherence tomography. Arch Ophthalmol. 2000;118:32–8. doi: 10.1001/archopht.118.1.32. [DOI] [PubMed] [Google Scholar]
- 16.Massin P, Allouch C, Haouchine B, et al. Optical coherence tomography of idiopathic macular epiretinal membranes before and after surgery. Am J Ophthalmol. 2000;130:732–9. doi: 10.1016/s0002-9394(00)00574-2. [DOI] [PubMed] [Google Scholar]
- 17.Massin P, Haouchine B, Gaudric A. Macular traction detachment and diabetic edema associated with posterior hyaloidal traction. Am J Ophthalmol. 2001;132:599–600. doi: 10.1016/s0002-9394(01)01015-7. [DOI] [PubMed] [Google Scholar]
- 18.Spaide RF, Wong D, Fisher Y, Goldbaum M. Correlation of vitreous attachment and foveal deformation in early macular hole states. Am J Ophthalmol. 2002;133:226–9. doi: 10.1016/s0002-9394(01)01377-0. [DOI] [PubMed] [Google Scholar]
- 19.Sanchez-Tocino H, Alvarez-Vidal A, Maldonado MJ, et al. Retinal thickness study with optical coherence tomography in patients with diabetes. Invest Ophthalmol Vis Sci. 2002;43:1588–94. [PubMed] [Google Scholar]
- 20.Bowd C, Zangwill LM, Berry CC, et al. Detecting early glaucoma by assessment of retinal nerve fiber layer thickness and visual function. Invest Ophthalmol Vis Sci. 2001;42:1993–2003. [PubMed] [Google Scholar]
- 21.Schuman JS, Puliafito CA, Fujimoto JG. Optical Coherence Tomography of Ocular Diseases. 2. Thorofare, NJ: SLACK Inc; 2004. [Google Scholar]
- 22.Drexler W, Morgner U, Kärtner FX, et al. In vivo ultrahigh resolution optical coherence tomography. Optics Lett. 1999;24:1221–3. doi: 10.1364/ol.24.001221. [DOI] [PubMed] [Google Scholar]
- 23.Drexler W, Morgner U, Ghanta RK, et al. Ultrahigh resolution ophthalmic optical coherence tomography. Nat Med. 2001;7:502–7. doi: 10.1038/86589. [DOI] [PMC free article] [PubMed] [Google Scholar]
- 24.Drexler W, Sattmann H, Hermann B, et al. Enhanced visualization of macular pathology with the use of ultrahigh-resolution optical coherence tomography. Arch Ophthalmol. 2003;121:695–706. doi: 10.1001/archopht.121.5.695. [DOI] [PubMed] [Google Scholar]
- 25.Ko TH, Fujimoto JG, Duker JS, et al. Comparison of ultra-high- and standard-resolution optical coherence tomography for imaging macular hole pathology and repair. Ophthalmology. 2004;111:2033–43. doi: 10.1016/j.ophtha.2004.05.021. [DOI] [PMC free article] [PubMed] [Google Scholar]
- 26.Kowalevicz AM, Schibli TR, Kaertner FX, Fujimoto JG. Ultralow-threshold Kerrlens mode-locked Ti:Al2O3 laser. Optics Lett. 2002;27:2037–9. doi: 10.1364/ol.27.002037. [DOI] [PubMed] [Google Scholar]
- 27.American National Standards Institute. Safe Use of Lasers. New York: American National Standards Institute; 1993. [Google Scholar]
- 28.Gass JDM. Stereoscopic Atlas of Macular Diseases: Diagnosis and Treatment. 3. Vol. 1. St. Louis: CV Mosby; 1987. [Google Scholar]
- 29.Toth CA, Narayan DG, Boppart SA, et al. A comparison of retinal morphology viewed by optical coherence tomography and by light microscopy. Arch Ophthalmol. 1997;115:1425–8. doi: 10.1001/archopht.1997.01100160595012. [DOI] [PubMed] [Google Scholar]
- 30.Gloesmann M, Hermann B, Schubert C, et al. Histologic correlation of pig retina radial stratification with ultrahigh-resolution optical coherence tomography. Invest Ophthalmol Vis Sci. 2003;44:1696–703. doi: 10.1167/iovs.02-0654. [DOI] [PubMed] [Google Scholar]
- 31.Anger EM, Unterhuber A, Hermann B, et al. Ultrahigh resolution optical coherence tomography of the monkey fovea. Identification of retinal sublayers by correlation with semithin histology sections. Exp Eye Res. 2004;78:1117–25. doi: 10.1016/j.exer.2004.01.011. [DOI] [PubMed] [Google Scholar]
- 32.Hoang QV, Linsenmeier RA, Chung CK, Curcio CA. Photoreceptor inner segments in monkey and human retina: mitochondrial density, optics, and regional variation. Vis Neurosci. 2002;19:395–407. doi: 10.1017/s0952523802194028. [DOI] [PubMed] [Google Scholar]
- 33.Yuodelis C, Hendrickson A. A qualitative and quantitative analysis of the human fovea during development. Vision Res. 1986;26:847–55. doi: 10.1016/0042-6989(86)90143-4. [DOI] [PubMed] [Google Scholar]
- 34.Hendrickson A, Drucker D. The development of parafoveal and mid-peripheral human retina. Behav Brain Res. 1992;49:21–31. doi: 10.1016/s0166-4328(05)80191-3. [DOI] [PubMed] [Google Scholar]
- 35.Huang JC, Voaden MJ, Zarbin MA, Marshall J. Morphologic preservation and variability of human donor retina. Curr Eye Res. 2000;20:231–41. [PubMed] [Google Scholar]
- 36.Enoch JM. Visualization of wave-guide modes in retinal receptors. Am J Ophthalmol. 1961;51:1107–18. doi: 10.1016/0002-9394(61)91800-1. [DOI] [PubMed] [Google Scholar]
- 37.Fankhauser F, Enoch J, Cibis P. Receptor orientation in retinal pathology. A first study Am J Ophthalmol. 1961;52:767–83. doi: 10.1016/0002-9394(61)90901-1. [DOI] [PubMed] [Google Scholar]
- 38.Winston R, Enoch JM. Retinal cone receptor as an ideal light collector. J Opt Soc Am. 1971;61:1120–2. doi: 10.1364/josa.61.001120. [DOI] [PubMed] [Google Scholar]
- 39.Ko TH, Adler DC, Fujimoto JG, et al. Ultrahigh resolution optical coherence tomography imaging with a broadband superluminescent diode light source. Optics Express. 2004;12:2112–9. doi: 10.1364/opex.12.002112. [DOI] [PubMed] [Google Scholar]