

Abstract
Purpose
To investigate quantitatively for the first time the relationship between light scattering and ultrastructure of semi-transparent scars resulting from penetrating wounds in rabbit cornea.
Methods
2 mm diameter penetrating wounds were made in the central cornea and allowed to heal for 3.6 to 4.5 years at which time the rabbits were sacrificed. The scar and cornea thickness outside the scar were measured using ultrasonic pachymetry. Corneas were excised immediately and their transmissivity was measured from 400 to 700 nm. The tissue was then prepared for TEM. TEM were analyzed to determine fibril positions and radii. Scattering was calculated using the direct summation of fields (DSF) method.
Results
Scar thickness averaged 0.26±0.04 mm and the scars were flat. Thickness outside the scars averaged 0.40±0.04 mm. Three scars were moderately transparent, five were less transparent, and one was much less transparent. The wavelength dependence of the measured total scattering cross-section was indicative of the presence of voids (lakes) in the collagen fibril distribution and lakes were evident in the TEM. The TEM showed enlarged fibrils and some showed bimodal distributions of fibril diameters. Calculated scattering was characteristic of that expected from regions containing lakes - a finding consistent with the scattering measurements.
Conclusions
Despite the long healing time these scars remained highly scattering. A combination of lakes, disordered fibril distributions, and a significant population of enlarged fibrils can explain the scattering. A possible cellular contribution cannot be ruled out.
INTRODUCTION
Charles Cintron and his co-workers adapted a model originally developed by Heydenreich1 to investigate healing of penetrating corneal wounds.2–4 This highly successful model consisted of removing a centrally located 2 mm diameter full thickness button. Such wounds heal by first forming a fibrin clot, after which cells invade and ultimately produce an avascular network of collagen fibrils.2–5 The model had advantages of simplicity, reproducibility of healing with minimal complications, and the production of scar tissue suitable for analysis.4 Interestingly, it was reported that the initially opaque scars ultimately became “transparent.” 2, 3 This and other biochemical observations led to the initial suggestion that rabbit cornea exhibited a capability for true regeneration of stromal tissue.3 However more extensive investigations showed that the regeneration was incomplete at the biochemical and ultrastructural level2 and the statement that the wounds became transparent was qualified to their becoming less opaque and sometimes transparent.5
Two primary physical factors lead to the transparency of normal corneas (a third factor, namely the thinness of the normal cornea, is less applicable to the scars which are the subject of the present investigation.).6 First, collagen fibrils in the stroma are weak scatterers because their radius is much smaller than the wavelength of visible light and their refractive index is close to that of their surroundings. Second, destructive interference among the fields scattered by different fibrils reduces the scattering from that which would occur if the fibrils scattered independently of one another. A quantity called the total scattering cross-section incorporates both of these effects.7–9 It can be determined (within a multiplicative constant) from measurements of transmissivity.6, 10, 11 The total scattering cross-section is proportional to a quantity known as the interference factor, which shows how much the scattering is reduced. It depends on the spatial distribution of the collagen fibrils about one another and, to a lesser extent, on the spatial distribution of fibril scattering strengths.9 The interference factor is central to most transparency theories.7, 12–16 It can be calculated from the fibrillar structures shown in transmission electron micrographs (TEM) and it provides a quantitative measure of the degree (or lack thereof) of fibrillar ordering.9 Alterations in the spatial distribution of fibrils that reduce destructive interference, or changes that cause the fibrils to scatter more efficiently, reduce transparency and, if severe, lead to corneal opacity. In normal cornea, keratocytes do not contribute significantly to light scattering except under the special condition of specular scattering, which occurs in reflective confocal microscope images.6, 11, 17, 18 Because at present there is no quantitative theory to describe scattering from corneal cells18 it is not possible to separate their possible contribution to reduced transmissivity in corneal wounds from that of the disrupted fibrillar matrix.
This paper, for the first time, relates experimental measurements of light scattering from healed penetrating wounds to the ultrastructure depicted in TEM of the wounds via calculations of the total scattering cross-section and the interference factor.
MATERIALS AND METHODS
i. Animals
In conducting the experiments we adhered to the ARVO Resolution on the Use of Animals in Research. Two millimeter diameter penetrating wounds in the central corneas of 5 New Zealand white rabbits were produced at different times in Dr. Charles Cintron’s laboratory at the Schepens Eye Research Institute as described previously 2–4 The rabbits were ultimately delivered to the Wilmer Eye Institute where they were housed until the time of the light scattering experiments (3.5–4.5 years after wounding).
Prior to being killed for light scattering measurements, rabbits were anesthetized with an intramuscular injection of xylazine and ketamine hydrochloride in the proportions: 60% of 20 mg/ml xylazine to 40% of 100 mg/ml ketamine by volume. They were killed by an overdose of Buthanasia administered in an ear vein and the eyes enucleated. The scar thickness and the thickness of the adjacent unwounded cornea were measured with an ultrasonic pachymeter and the scars were photographed. Corneas were then excised with a scleral ring and mounted as described previously.10 Corneas were bathed in BSS during the entire excision and mounting procedure. After mounting, the hydrostatic pressure across the cornea was raised to 18 mmHg and the mounted cornea was inserted in the scattering apparatus where it also was bathed in BSS. Transmission at 500 nm was monitored for 10 minutes before taking measurements to ensure the stability of the preparation. 10
ii. Transmission measurements
Transmission measurements were made in an apparatus similar to that described in Farrell et al.10 except for several improvements (primarily in the electronics). The improvements have not altered the optics which ensure that the incident and transmitted light beams have very low angular divergences and that the collection optics minimize the collection of forward scattered light.
The transmissivity, FT, at a wavelength λ is given by
| (1) |
where It is the irradiance of the light transmitted through the cornea, I0 is the irradiance of the light incident on the cornea, t is the thickness of the cornea, ρ is the number density of fibrils in a typical lamella, and σt (λ) is the total scattering cross-section. In order to account for cornea–to–cornea variations in scar thicknesses, we average the quantity –ln (FT (λ)/t = ρσt (λ). 6, 10, 11 In Results it is shown that the values of ρσt (λ) vary from scar to scar, but that they can be broken into three groups to facilitate discussion.
iii. Electron microscopy
Immediately following the scattering measurements, the mounted corneas were removed from the apparatus, and while still under pressure, phosphate buffered 1% glutaraldehyde 4% formaldehyde fixative was dripped on the anterior surface for seven minutes. At this point the cornea was sufficiently rigid to retain its shape when it was removed from the mount. Fixation was continued overnight followed by post-fixation in 1% phosphate buffered osmium tetroxide for two hours. Corneas were then dehydrated in a graded series of ethanol, stained with uranyl acetate in 100% ethanol, passed through two changes of propylene oxide and infiltrated in a 1:1 propylene oxide and resin mixture [modified Luft's medium (based on LX 112; Ladd Research Industries, Burlington, VT and Dodecenylsuccinic anhydride (DDSA)] overnight. The infiltration process was continued by immersing the samples in 100% resin mixture under vacuum for two hours. Samples were then polymerized overnight at 37°C and then at 58–66°C for two days. Ultra-thin sections were were doubly stained with tannic acid-uranyl acetate and lead citrate solutions. Tannic acid is an improved stain for elastin and collagen fibers.19 Samples were examined and photographed with a JEM 100B Transmission Electron Microscope.
iv. Image analysis and scattering calculations
Micrographs (magnification 64,800X) were scanned at 300 dpi on a UMAX PowerLook 1000 scanner. This resolution ensured that the smallest fibrils would be at least 8 pixels in diameter. 20 Image analysis was performed on a Macintosh computer using an augmented version of the public domain NIH Image program (developed at the U.S. National Institutes of Health and available on the Internet at http://rsb.info.nih.gov/nih-image/).20 The general outline of the image-processing algorithm that was used to obtain the fibril positions and their radii was described previously.20
Light scattering was calculated from fibril positions and radii using the direct summation-of-fields (DSF) method.21 This method enables one to estimate the ensemble average of the total scattering cross-section and the interference factor using a single TEM and it can be applied to assemblies of fibrils that have arbitrary spatial distributions and arbitrary distributions of diameters, such as those encountered in scarred corneas. The calculations herein account for the individual fibril diameters as described by Freund et al.9
Estimates for the refractive indices of the fibrils and extrafibrillar matrix were obtained using the Gladstone-Dale law of mixtures and the refractive increment law as described previously.8, 9, 14, 22 Calculations of refractive indices require assumptions of collagen concentration, how it is distributed in the fibrils, and the concentration of components in the extrafibrillar matrix. These quantities are unknown for these scars, thus for the purposes of this study we have assumed that they are the same as for normal cornea.23 We also have assumed that the fibrils contain a fixed percentage of collagen; thus all fibrils have the same index of refraction – independent of their diameters.9
RESULTS
Despite the long healing time these wounds remained highly scattering. Figure 1 shows examples from the three scattering groups that were identified as described later. It is apparent that scattering in the scars is not uniform. The narrow slit photographs also show that the scarred region is flat and thinner than the adjacent unwounded cornea. The average thicknesses of the scars and adjacent cornea were respectively 0.26±0.04 mm and 0.40±0.04 mm. Others have obtained similar results for scar thickness in healed penetrating wounds.24
Figure 1.
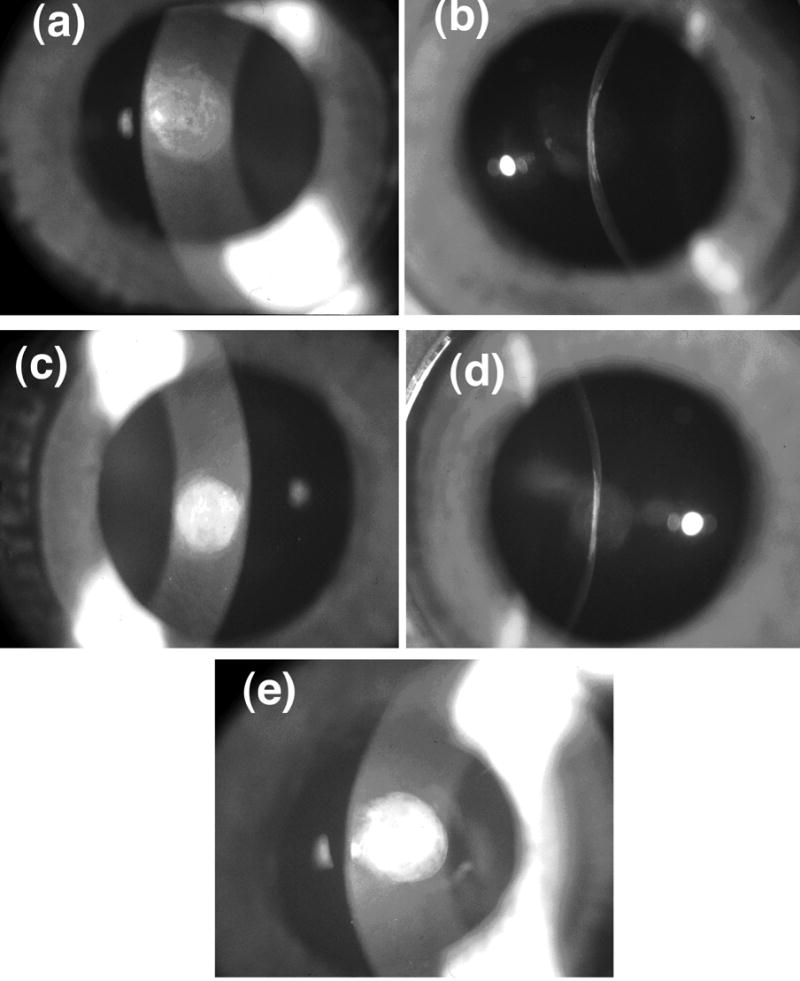
Slit-lamp photographs of scars show that there are substantial variations in scattering intensity across the wound with some regions appearing less opaque than others. The photographs with narrow slit illumination show that the scarred region is flat and thinner than the unwounded cornea. There are variations of scattering intensity with depth, with some regions appearing relatively transparent. (a) Cornea C8L from Group 1 (see Table 1 and Figure 2). (b) Cornea C8R from Group 2. (c) Cornea C25L – the single cornea in Group 3.
Table 1 lists values of ρσt (λ) obtained from transmission measurements on the nine scarred corneas that were investigated (The cornea from the left eye of rabbit C4 was damaged and could not be used). These results show that the values of ρσt (λ) from the identically prepared scars are in three distinct groups as delineated in the Table. Group 1 has the lowest scattering. The average value of ρσt (λ) for Group 2 is 1.74 times greater than the Group 1 average at 400 nm and 1.56 times greater at 700 nm. The Wilcoxon-Mann-Whitney test showed that the differences in average values are significant at all wavelengths (P<0.04). The single cornea in Group 3 had the highest values of ρσt (λ) - ranging from 1.5 times greater than the Group 2 average at 400 nm to 2.38 times greater at 700 nm.
Table 1.
Experimental Scattering Levels
| Cornea Scar age (yrs) | C4R 4.5 | C8L 4.5 | C11R 4.0 | C8R 4.5 | C11L 4.0 | C18R 3.6 | C18L 3.6 | C25R 3.6 | C25L 3.6 |
|---|---|---|---|---|---|---|---|---|---|
| Group | 1 | 1 | 1 | 2 | 2 | 2 | 2 | 2 | 3 |
| λ (nm) | ρσt (μm)−1 | ρσt (μm)−1 | ρσt (μm)−1 | ||||||
| 400 | 2.841 | 3.188 | 4.759 | 5.197 | 6.567 | 6.814 | 6.183 | 6.612 | 9.382 |
| 450 | 2.120 | 2.617 | 3.802 | 4.219 | 5.127 | 5.357 | 4.851 | 5.093 | 8.817 |
| 500 | 1.658 | 2.266 | 3.104 | 3.533 | 4.090 | 4.315 | 3.886 | 4.127 | 7.594 |
| 550 | 1.397 | 2.006 | 2.611 | 3.056 | 3.353 | 3.578 | 3.218 | 3.505 | 6.757 |
| 600 | 1.198 | 1.812 | 2.233 | 2.694 | 2.803 | 3.032 | 2.690 | 3.020 | 6.123 |
| 650 | 1.054 | 1.656 | 1.951 | 2.430 | 2.397 | 2.623 | 2.322 | 2.660 | 5.624 |
| 700 | 0.941 | 1.542 | 1.727 | 2.217 | 2.047 | 2.304 | 2.045 | 2.370 | 5.222 |
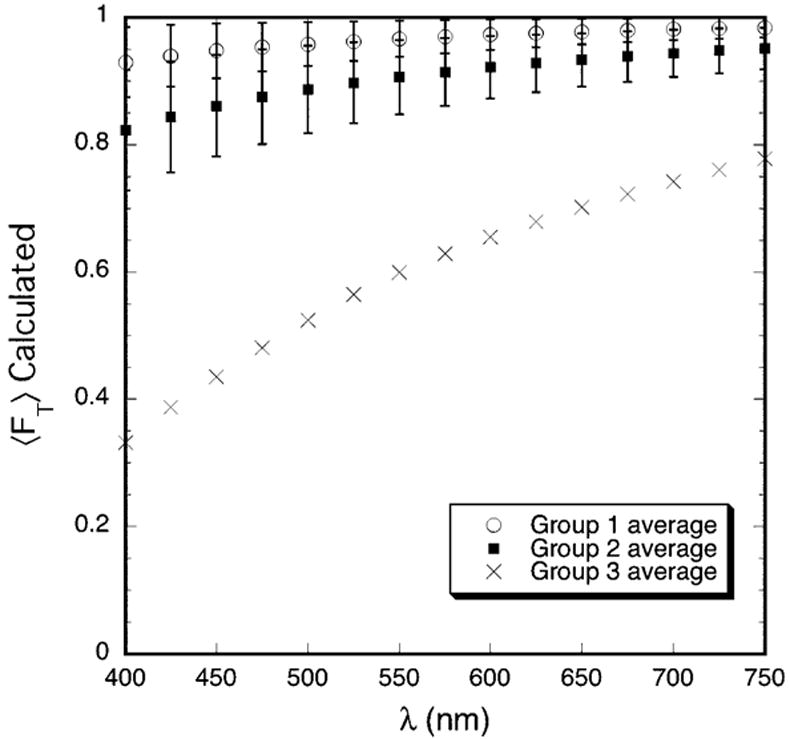
Figure 2 shows the average fraction of light transmitted, 〈FT〉, as a function of wavelength for the three groups. The values of 〈FT〉 were determined from the averages of ρσt(λ) in Table 1, assuming that the scars had the average thickness noted above (i.e., t = 0.26 mm). The effect on transmissivity resulting from the differences in scattering in the three groups is obvious.
Figure 2.
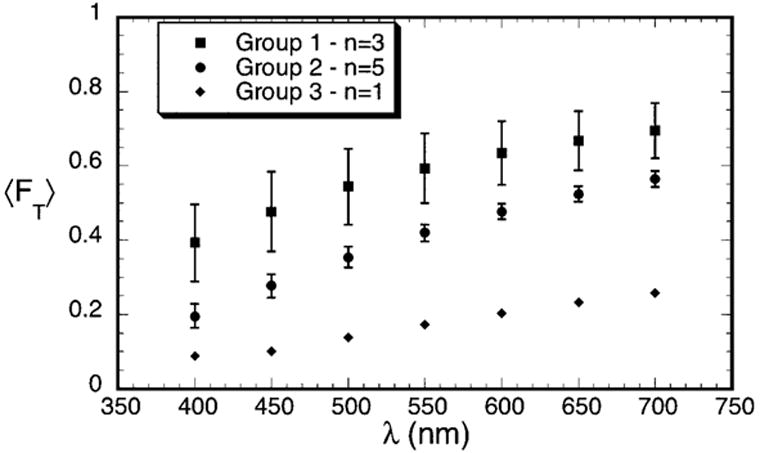
Average transmissivity measured for the scars in Groups 1–3. The data are normalized to a thickness of 0.26 mm, which is the average thickness of the scars.
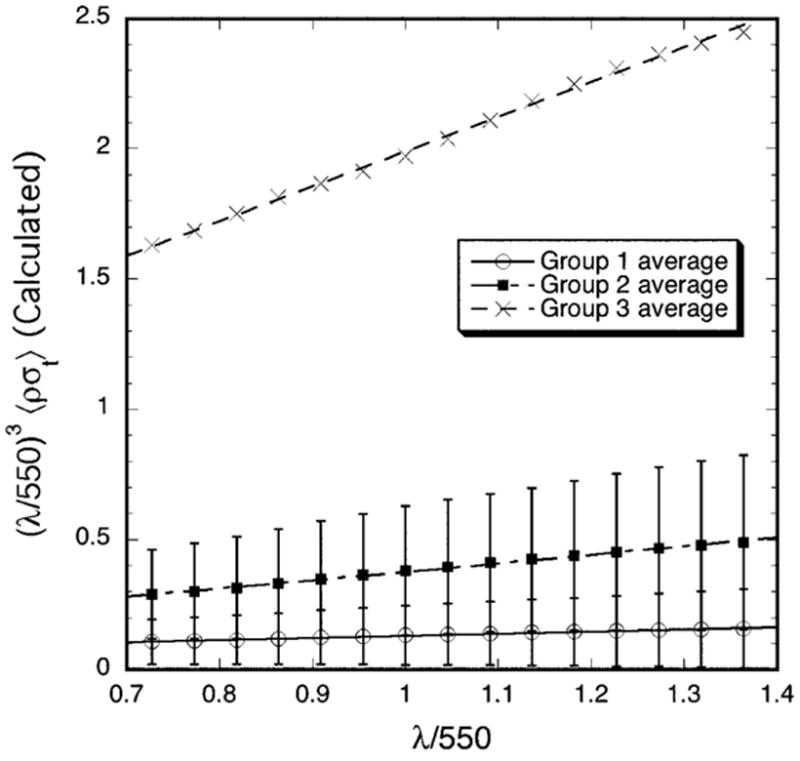
Figure 3 shows that the quantity λ3 σt(λ) has a linear dependence on λ (i.e., it can be expressed in the form A + Bλ, which is a straight line of slope B). This implies that the total scattering cross-section has the functional form
Figure 3.
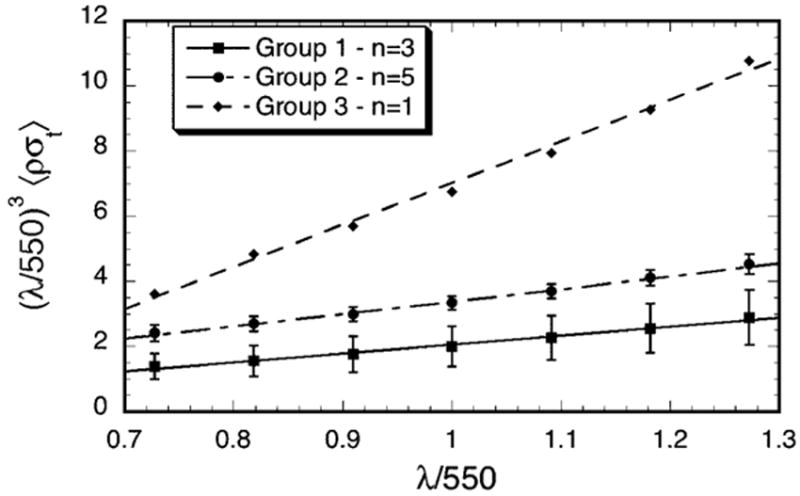
Wavelength dependence of the total scattering cross-section for the scars in Groups 1–3. Multiplication by (λ/550)3 removes the wavelength dependence of the average single fibril scattering cross-section. The straight lines are least squares fits to the data. According to the extension of Benedek’s lake theory, positive slopes indicate the presence of lakes in the distribution of collagen fibrils.10, 12 The slopes are respectively 2.27, 3.87 and 12.8 for Groups 1, 2, and 3 and the R values of the fits are respectively 0.994, 0.997, and 0.997. Increasing values of the slopes represent greater contributions from lakes.
| (2) |
where A and B are constants. The first term in equation 2 has the same wavelength dependence as the scattering cross-section of an isolated fibril and is characteristic of fibrils having either short-ranged order or homogeneous disorder in their positions.7, 10, 12, 15, 16, 25, 26 The existence of the second term in equation 2 has been associated with the presence of regions in the stromal lamellae that are devoid of fibrils.10 Such regions have often been called “lakes.” 10, 12 Their effect is to increase scattering.9, 10, 12, 25–28 Moreover, the fact that the slopes (i.e., the values of B) become progressively greater from Group 1 to Group 3 suggests that void regions become more prevalent in the corneas having greater scattering.
Transmission electron micrographs from corneas in the three groups were analyzed to characterize the fibril distributions and to determine fibril positions and diameters. As discussed later, these data (from suitable TEM1) were used to calculate the scattering that would be expected from the depicted structures. Figure 4 shows four of the TEM that were analyzed. Fibril positions and diameters were obtained from the entire depicted regions; the rectangles outline the regions that were subsequently used in the DSF light scattering calculations. Figure 5 shows the distributions of fibril diameters from the TEM in Figure 4. Figure 4a from the mid-stromal region of a cornea in Group 1 shows several small lakes, which confirms the prediction of their existence based on the scattering measurements. Interestingly, the distribution of fibril diameters obtained from this micrograph (cf., Figure 5a) is bimodal; i.e., it has two distinct peaks. To our knowledge bimodal distributions of fibril sizes have not been previously observed in either scarred or normal cornea. Figures 4b and 4c, respectively from the anterior and posterior regions of corneas in Group 2, contain several lakes and 4b has a population of very large fibrils. The diameter distributions from these micrographs are unimodal (c.f., Figures 5b and 5c). Figure 4d is from the anterior stroma of the cornea in Group 3. This region contains large lakes, a broad distribution of fibril diameters (c.f., Figure 5d), and disorganized fibrils.
Figure 4.
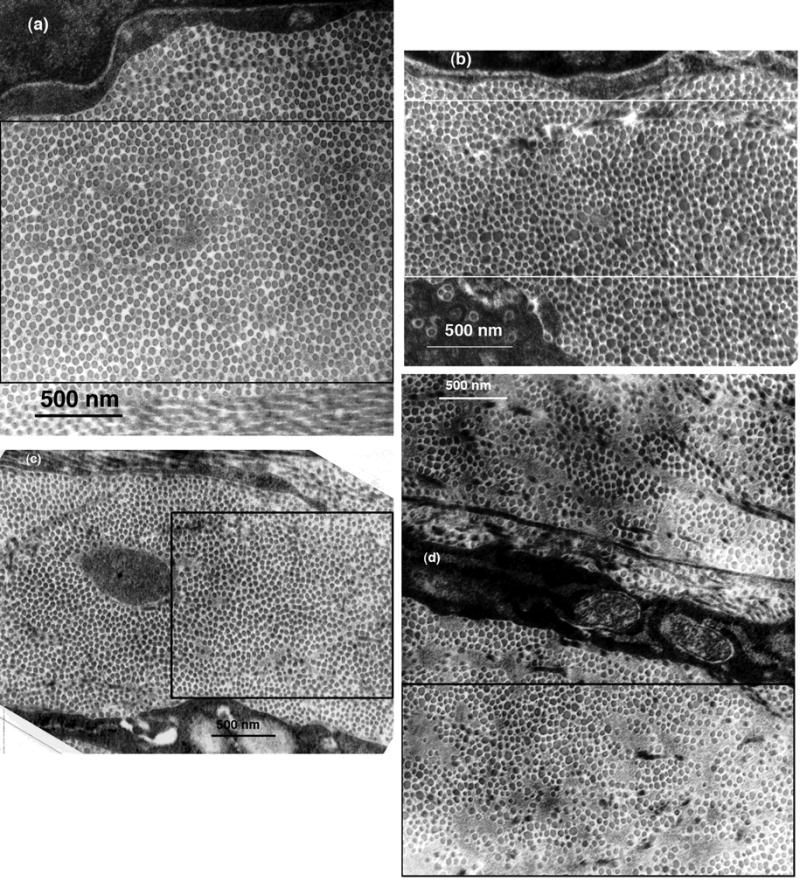
Selected TEM of scarred regions that were analyzed to determine fibril sizes and positions. The rectangles outline the regions that were used in the DSF calculations of light scattering. (a) Mid-stroma region of cornea C8LM15983 from Group 1. The structure appears nearly normal, except that a small lake is visible near the center. (b) Mid-stroma region of cornea C8RM16270 from Group 2. Several lakes are visible and there are many enlarged fibrils. (c) Region from the posterior stroma of cornea C11LP16264 from Group 2. Several lakes are visible, but the fibrils appear to have more uniform diameters than those in (c). (d) Region from the anterior stroma of cornea C25LA16077 which was the single cornea in Group 3. Several large lakes are evident and there is a wide distribution of fibril diameters.
Figure 5.
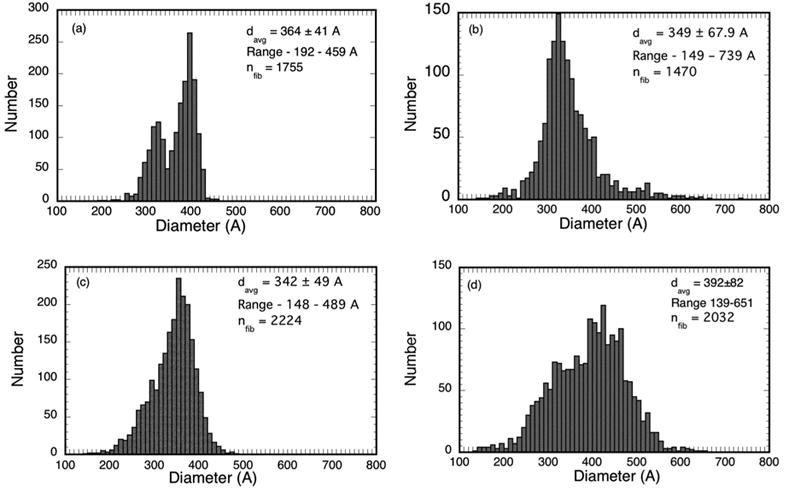
Fibril diameter distributions from the micrographs in Figures 4 a–d. The distribution from cornea C8LM15983 in (a) is bimodal with distinct peaks at 320A and 390A. Bimodal diameter distributions have not been reported previously for such scars.
Table 2 summarizes the fibril statistics from all of the TEM that were analyzed. It shows that several had bimodal diameter distributions. The average position of the distribution peaks for the micrographs in Group 1 having bimodal distributions are at 325A and 400A, whereas the average position of the peaks for those in Group 2 are at 330A and 470A.
Table 2.
Fibril Statistics
| Cornea/EM | Scar Age (yrs) | Group | Region | Nfib | davg (A) | Range (A) | Distribution type |
|---|---|---|---|---|---|---|---|
| C4RM/15993 * | 4.5 | 1 | Middle | 2144 | 402±40 | 232–479 | Bimodal |
| C4RP/15995 * | 4.5 | 1 | Posterior | 3141 | 369±43 | 168–488 | Bimodal |
| C8LM/15563 * | 4.5 | 1 | Middle | 2763 | 409±33 | 194–637 | Unimodal |
| C8LM/15983 * | 4.5 | 1 | Middle | 1755 | 364±40 | 209–451 | Bimodal |
| C8LP/15569 * | 4.5 | 1 | Posterior | 2850 | 341±27 | 206–424 | Unimodal |
| C11RP/16305 * | 4.0 | 1 | Posterior | 1909 | 347±46 | 155–494 | Unimodal |
|
| |||||||
| C8RA/16270 * | 4.5 | 2 | Anterior | 1420 | 349±68 | 149–739 | Unimodal |
| C8RM/16275 * | 4.5 | 2 | Middle | 1054 | 378±55 | 239–529 | Bimodal |
| C11LM/16257 | 4.0 | 2 | Middle | 1658 | 373±99 | 97–644 | Bimodal |
| C11LP/16264 * | 4.0 | 2 | Posterior | 2224 | 342±49 | 148–489 | Unimodal |
| C18RM/15169 | 3.6 | 2 | Middle | 808 | 428±115 | 119–723 | Bimodal |
| C25RA/15675 | 3.6 | 2 | Anterior | 1337 | 476±108 | 152–742 | Bimodal |
| C25RA/15630 | 3.6 | 2 | Anterior | 4352 | 370±40 | 160–555 | Unimodal |
| C25RA/15632 | 3.6 | 2 | Anterior | 1294 | 415±92 | 122–708 | Unimodal |
| C25RM/15637 * | 3.6 | 2 | Middle | 1714 | 455±43 | 169–605 | Unimodal |
| C25RM/15638 | 3.6 | 2 | Middle | 902 | 456±39 | 192–593 | Unimodal |
| C25RM/15680 * | 3.6 | 2 | Middle | 3035 | 429±60 | 171–615 | Bimodal |
| C25RM/15683 * | 3.6 | 2 | Middle | 3029 | 427±70 | 163–692 | Bimodal |
|
| |||||||
| C25LA/16077 * | 3.6 | 3 | Anterior | 2032 | 392±82 | 139–651 | Unimodal |
| C25LA/16079 * | 3.6 | 3 | Anterior | 3147 | 366±68 | 146–625 | Unimodal |
TEM used for DSF calculations.
It is important to note the TEM chosen for fibril analysis and from which scattering could be calculated have more fibrillar order than was typical throughout the scars. Many regions in the scars had a much less orderly arrangement of fibrils. Such distributions are not amenable to DSF scattering calculations, but are consistent with the high level of scattering found in the measurements. Although not presented here, lower magnification micrographs from all three groups show regions of disorganized lamellar structures, deposits of granular material, and some partially degenerated keratocytes, some of which contain vacuoles filled with granular material. In general all of these characteristics are more prevalent in the corneas in Groups 2 and 3 and are consistent with the higher scattering observed in these groups.
The DSF method 9, 21 was used to calculate the total scattering cross-section for rectangular regions in the micrographs listed in Table 2 which contained ~1000 or more fibrils. The calculated total scattering cross-sections and the fibril number densities obtained from the TEM were used in Equation 1 to determine the fraction of light that would be transmitted through corneas assumed to have the structures depicted in the rectangular regions that were analyzed. The calculations also assumed a corneal thickness of 0.26 mm (i.e., the average thickness of the scars). The average values of the product of the fibril number density and the computed total scattering cross-section, 〈ρσt (λ)〉, were determined for the micrographs in each of the three groups and were used to compute 〈FT〉 for each of the groups. These results are shown in Figure 6. The Wilcoxon-Mann-Whitney test showed that the differences in 〈ρσt(λ)〉 for the micrographs in Groups 1 and 2 are significant at all wavelengths (P<0.035). Because only two micrographs from the cornea in Group 3 were analyzed, no statistical test could be done; however 〈ρσt (λ)〉 for the Group 3 cornea is ≥5 times the Group 2 average at all wavelengths.
Figure 6.
Average transmission calculated from TEM. The DSF computations assume that the entire cornea has the structure depicted in the TEM. The transmission is normalized to a thickness of 0.26 mm, which is the average thickness of the scars.
Figure 7 displays the wavelength dependence of the average total scattering cross-section for the three groups. In agreement with the experimental results in Figure 3, the calculated values of (λ/550)3 〈ρσt (λ)〉 for each group also have a linear dependence on wavelength and the slopes become progressively greater from Group 1 to Group 2 to Group 3. This result is consistent with TEM from the three groups.
Figure 7.
Wavelength dependence of the average total scattering cross-section calculated from the TEM. Multiplication of 〈ρσt (λ)〉 by (λ/550)3 removes the wavelength dependence of the average single fibril scattering cross-section. In agreement with the experimental data in Figure 3, plots of the calculated values of (λ/550)3 〈ρσt (λ)〉 are also straight lines whose slopes progressively increase from Group 1 to 3.
DISCUSSION
Cintron et al2, 5 reported that scars from 2 mm penetrating corneal wounds became less opaque and in some cases appeared transparent after healing 1.5 to 2 years. This paper presents the first quantitative measurements of light scattering and their relationship to ultrastructure of such scars. Transmissivity in normal rabbit cornea ranges from 0.88 at 400 nm to 0.97 at 700 nm.10 The scars from the lowest scattering group had transmissivities ranging from 0.39 at 400 nm to 0.69 at 700 nm (cf., Figure 2), values comparable to those of rabbit corneas swollen to twice their normal thickness.10 Therefore, while these scars were less opaque than in their early stage of healing (photographs not shown), even those in the lowest scattering group did not approach what could reasonably be described as being transparent. It is important to note however, that measurements of transmission average over the diameter of the incident beam (~1 mm) and through the entire depth of the cornea. Slit-lamp views of the scars (cf., Figure 1) show that the scars were not homogeneous. They had some regions that scattered much less than others. It also is noteworthy that scars from opposite eyes of the same rabbit were in different scattering groups for three of the four pairs of corneas (cf., Table 2). Moreover, some scars in Group 2 had healed for the same time as the scars in Group 1. This suggests that the healing process and partial recovery of transparency is probably influenced primarily by slight (unintended) variations in the initial wounding.
The total scattering cross-section of normal transparent rabbit cornea varies as (1/λ3).6, 10, 11, 15, 25, 26 This dependence, which is the same as that of an isolated fibril, is indicative of short-ranged ordering in the fibril positions.9, 15, 16, 25 15 However, if fibril positions were to become disordered such that the fibrils scattered independently of one another, scattering would increase because there would be less destructive interference, but the scattering cross-section would still vary as (1/λ3).6, 14, 15, 25 The scattering data in Figure 3 are inconsistent with this mechanism for explaining the high level of scattering from the scars; because, if this were the case, the product (λ/550)3 〈ρσt (λ)〉 would have been a constant, independent of wavelength. As discussed previously, the results in Figure 3 show that the measured total scattering cross-sections for the scars have the functional form A/λ3 + B/λ2. This form is indicative that the scars contain intralamellar fibril-free regions (vis., “lakes”) surrounded by regions of disordered fibrils.6, 10, 25, 27 Other investigators have reported that that lakes persist in scar tissue up to 9 months, but they stated that they did not appear to be of sufficient size and number to affect transparency. No scattering measurements or analyses were performed to assess the validity of this assertion.29 Our study shows that lakes persist up to 4.5 years (cf., Figure 4) and the scattering data in Figure 3 suggests that, in fact, lakes are a significant factor producing the high level of scattering in the scars.
The wavelength dependence of the calculated scattering is consistent with the wavelength dependence determined from the measurements (cf., Figures 3 and 7). Both the calculations and measurements show that the quantity (λ/550)3 〈 ρσt (λ)〉 depends linearly on λ, and that the magnitude and slopes of the linear fits increase from Group 1 to Group 2 to Group 3. The calculated values of σt(λ) are however, much lower than the measured ones. Consequently, the calculated transmissivities are much greater than the measured values (cf., Figures 2 and 6). This is because the measurements probe the entire depth of tissue, including all of the highly disorganized regions noted previously. Thus the lack of quantitative agreement would be expected because, as noted previously, the DSF method can only be applied to regions that contain a sufficient number (~ 1000 or more) of parallel fibrils.21 The DSF method implicitly assumes that the fibrils shown in cross section, which are used in the calculations, are arranged parallel to one another over a reasonable distance (at least several wavelengths). Light waves scattered from parallel fibrils can interfere, whereas waves scattered from non-parallel or tangled fibrils cannot. As noted in the Introduction, destructive interference among the waves scattered from the parallel fibrils in the stromal lamellae is a major factor underlying corneal transparency. Non-parallel or tangled fibrils scatter independently of one another and greatly increase the overall scattering. We are unaware of any theory for calculating scattering from tangled fibrils.
The total scattering cross-section σt(λ) can be written in the form
| (3) |
where 〈σ0t (λ)〉 is the total scattering cross-section of an average isolated collagen fibril and σtN (λ) is the interference factor which measures the degree of order in the spatial arrangement of fibril axes and fibril sizes.9, 21 The magnitude of σtN (λ) provides a quantitative measure of the degree of fibrillar ordering.6, 9, 30 As employed herein it also accounts for variability in scattering strengths that result from differences in fibril sizes.9 The interference factor can have values between zero (corresponding to crystalline order) and one (corresponding to random order).30 In normal rabbit cornea σtN (λ) is ~0.11 in the anterior stroma and ~0.085 in the posterior stroma, and it is essentially independent of wavelength in both regions.9 These values are indicative of a substantial degree of fibrillar ordering in the normal transparent cornea. In contrast, the average values of σtN (550) obtained from the DSF calculations are respectively 0.18±0.13, 0.38±0.22, and 0.80±0.33 for Groups 1, 2 and 3. Thus all groups have less fibular order than normal cornea. The progressive increases in the average values of σtN (550) from Groups 1 to 3 indicate that disorder in the spatial distribution of fibrils, and the resulting decrease in destructive interference in the scattered fields, also is an important factor in the increased scattering.
The mean fibril diameters in Table 2 are in close agreement with the larger of the reported values for normal rabbit cornea9, 31, 32 (however the 476 A diameter for C25RA15675 is an exception in that it is larger). The mean diameters are also in reasonable agreement with earlier measurements obtained from TEM of 1.5 year old scars2 and with x-ray diffraction measurements of 21 month old scars.29 In general, however, the diameter distributions in the scars are much broader than those for normal rabbit cornea as evidenced both by their standard deviations and by their ranges. The standard deviations in Table 2 range from 27A (which was for a cornea in Group 1) to 115A, whereas those for normal cornea range from 20A to 28A.9 Rawe et al reported a standard deviation of 70A based on their x-ray diffraction measurements of a 21 month old scar.29 The range of diameters obtained in this study is greater than Cintron et al found in 1.5 year old scars (viz., 100 to 500 A),2 perhaps because we analyzed more micrographs and larger regions. Table 2 shows that the majority of the TEM we analyzed contained populations of fibrils with diameters greater than 500A.
Bimodal distributions of fibril diameters have not been previously reported for scars of this type. Fibrils having diameters near the low peak of the bimodal distributions found in this study have diameters within the range reported for normal cornea. However the diameters of fibrils near the high diameter peak for the Group 2 corneas are greater than any that have been found in normal cornea. Moreover the number of fibrils near the high peak in both Groups 1 and 2 is greater than those near the low peak for every cornea except one. Age is unlikely to be a factor in explaining either the broad diameter distributions or the bimodal diameter distributions. Kanai and Kaufman found that collagen fibril diameters in aged (80 year) human corneas are essentially the same as in younger corneas;33 whereas Daxer et al found fibril diameters of 308±10 A and 322±10A for human corneas that were respectively less than and greater than 65 years of age.34 Both of these values are within the range of those reported for normal human cornea and both have small standard deviations.
X-ray data suggest that the fibrils in older scars produced in an identical manner as this work have hydration levels close to normal. This led Rawe et al to conclude that the larger fibrils either have a different molecular arrangement or a larger number of collagen molecules per fibril.29 Either of these conclusions would justify our assumption that the fibrils have a fixed percentage of collagen, and therefore that their refractive indices would be independent of their diameters. Because the single fibril scattering cross-section, 〈σ0t (λ)〉, is proportional to the fourth power of fibril diameter,9, 21 the population of large fibrils would be expected to contribute significantly to the scattering.
The effects of the significant populations of large fibrils in both the unimodal and bimodal distributions are manifested in the isolated fibril scattering cross-sections. The mean values of 〈σ0t (550)〉 calculated from the Group 1 and 2 TEM are respectively (1.63±0.59) X 102 A and (2.59±0.53) X 102 A. The Wilcoxon-Mann-Whitney test showed that the differences in the averages are significant (P=0.02). The mean value 〈of σ0t (550)〉 calculated from the two TEM from the Group 3 cornea is 8.6 X 10² A. Although no statistical test was performed, it is obviously much greater.
Although it is possible that keratocytes may contribute to the increased scattering, their potential contribution is difficult to assess because at present there is no theory that can quantitatively predict cellular scattering in the cornea.18 The TEM that were examined did contain some degenerating keratocytes. It is possible that their refractive indices may differ from normal keratocytes,35, 36 but even the refractive indices of normal keratocytes are unknown.18 The way that non-specular angular scattering from normal cornea scales with scattering angle and wavelength indicates that scattering is due to the fibrillar matrix and keratocytes do not contribute significantly.17 In any event it is unlikely that scattering from keratocytes or other corneal cells such as myofibroblasts, has the same wavelength dependence as the scattering from these scars.37 It is clear however that a comprehensive theory for cellular scattering is needed and that it would contribute not only to a better understanding of light scattering from wounded cornea, but also to scattering from normal cornea.18, 38
In summary, scars from 2 mm diameter penetrating wounds remained highly scattering even after 3.6–4.5 years of healing. Analysis of light scattering measurements suggested that “lakes” or voids in the collagen fibril distribution were a significant factor contributing to the high level of scattering. TEM from the scars confirmed the presence of the lakes and some also showed bimodal distributions of fibril diameters. Analysis of the TEM using the DSF method showed that, in addition to scattering from lakes, disorder in fibrillar organization and the effects of significant populations of greatly enlarged fibrils on the isolated fibril scattering cross-sections are other significant factors contributing to the increased scattering.
Acknowledgments
We are indebted to Dr. Charles Cintron for encouraging us to pursue this study and for supplying wounded rabbits. We also thank Claire Kublin for technical assistance in Dr. Cintron’s laboratory.
Footnotes
Presented in part at the 2002 and 2005 annual meetings of the Association for Research in Vision and Ophthalmology and at the XVI International Congress of Eye Research, 2004.
Disclosure: R. L. McCally, None; D. E. Freund, None; A. Zorn, None; J. Bonney-Ray, None; R. Grebe, None; Z. de la Cruz, None; W. R. Green, None
The DSF method, which is used to calculate scattering, requires that there be a rectangular region containing ~1000 or more parallel fibrils (in cross-section) in order to obtain adequate statistics.
Supported in part by NEI grants EY01019, EY12165 (RLM)
References
- 1.Heydenreich A. Experiments on the Evaluation of the Effect of Drugs on the Regeneration of Corneal Parenchyma. Klin Monatsbl Augenheilkd. 1962;141:365–373. [PubMed] [Google Scholar]
- 2.Cintron C, Hassinger LC, Kublin CL, Cannon DJ. Biochemical and Ultrastructural Changes in Collagen during Corneal Wound Healing. Jour of Ultrastructure Res. 1978;65:13–22. doi: 10.1016/s0022-5320(78)90017-5. [DOI] [PubMed] [Google Scholar]
- 3.Cintron C, Kublin CL. Regeneration of Corneal Tissue. Dev Biol. 1977;61:346–357. doi: 10.1016/0012-1606(77)90304-9. [DOI] [PubMed] [Google Scholar]
- 4.Cintron C, Schneider H, Kublin C. Corneal Scar Formation. Exp Eye Res. 1973;17:251–259. doi: 10.1016/0014-4835(73)90176-0. [DOI] [PubMed] [Google Scholar]
- 5.Cintron C, Szamier RB, Hassinger LC, Kublin C. Scanning Electron Microscopy of Rabbit Corneal Scars. Invest Ophthalmol and Vis Sci. 1982;23:50–63. [PubMed] [Google Scholar]
- 6.Farrell RA, McCally RL. Corneal Transparency. In: Albert DM, Jakobiec FA, editors. Principles and Practice of Ophthalmology. 2. Philadelphia: W. B. Saunders; 2000. pp. 629–644. [Google Scholar]
- 7.Hart RW, Farrell RA. Light Scattering in the Cornea. J Opt Soc Am. 1969;59:766–774. doi: 10.1364/josa.59.000766. [DOI] [PubMed] [Google Scholar]
- 8.Cox JL, Farrell RA, Hart RW, Langham ME. The Transparency of the Mammalian Cornea. J Physiol (Lond) 1970;210:601–616. doi: 10.1113/jphysiol.1970.sp009230. [DOI] [PMC free article] [PubMed] [Google Scholar]
- 9.Freund DE, McCally RL, Farrell RA, Cristol SM, L'Hernault N, Edelhauser HF. Ultrastructure in Anterior and Posterior Stroma of Perfused Human and Rabbit Corneas. Invest Ophthalmol Vis Sci. 1995;36:1508–1523. [PubMed] [Google Scholar]
- 10.Farrell RA, McCally RL, Tatham PER. Wavelength Dependencies of Light Scattering in Normal and Cold Swollen Rabbit Corneas and their Structural Implications. J Physiol (Lond) 1973;233:589–612. doi: 10.1113/jphysiol.1973.sp010325. [DOI] [PMC free article] [PubMed] [Google Scholar]
- 11.McCally RL, Farrell RA. Light Scattering from Cornea and Corneal Transparency. In: Masters BR, editor. Noninvasive Diagnostic Techniques in Ophthalmology. New York: Springer-Verlag; 1990. pp. 189–210. [Google Scholar]
- 12.Benedek GB. The Theory of Transparency of the Eye. Appl Opt. 1971;10:459–473. doi: 10.1364/AO.10.000459. [DOI] [PubMed] [Google Scholar]
- 13.Feuk T. On the Transparency of the Stroma in the Mammalian Cornea. IEEE Trans Biomed Eng. 1970;BME-17:186–190. doi: 10.1109/tbme.1970.4502732. [DOI] [PubMed] [Google Scholar]
- 14.Maurice DM. The Structure and Transparency of the Corneal Stroma. J Physiol (Lond) 1957;136:263–285. doi: 10.1113/jphysiol.1957.sp005758. [DOI] [PMC free article] [PubMed] [Google Scholar]
- 15.Twersky V. Transparency of Pair-Related, Random Distributions of Small Scatterers, with Applications to the Cornea. J Opt Soc Am. 1975;65:524–530. doi: 10.1364/josa.65.000524. [DOI] [PubMed] [Google Scholar]
- 16.Farrell RA, Freund DE, McCally RL. What Light Scattering Can Tell About the Ordering of Collagen Fibrils in the Stroma. In: Katzir A, editor. Static and Dynamic Light Scattering in Medicine and Biology. Los Angeles, CA: SPIE; 1993. pp. 303–313. [Google Scholar]
- 17.Freund DE, McCally RL, Farrell RA. Effects of Fibril Orientations on Light Scattering in the Cornea. J Opt Soc Am A. 1986;3:1970–1982. doi: 10.1364/josaa.3.001970. [DOI] [PubMed] [Google Scholar]
- 18.Møller-Pedersen T. Keratocyte Reflectivity and Corneal Haze. Exp Eye Res. 2004;78:553–560. doi: 10.1016/s0014-4835(03)00208-2. [DOI] [PubMed] [Google Scholar]
- 19.Kajikawa K, Yamaguchi T, Katsuda S, Miwa A. An Improved Electron Stain for Elastic Fibers using Tannic Acid. J Electron Microscopy. 1975:24. [PubMed] [Google Scholar]
- 20.Freund DE, McCally RL, Goldfinger AD, Farrell RA. Image Processing of Electron Micrographs for Light Scattering Calculations. Cornea. 1993;12:466–474. doi: 10.1097/00003226-199311000-00002. [DOI] [PubMed] [Google Scholar]
- 21.Freund DE, McCally RL, Farrell RA. Direct Summation of Fields for Light Scattering by Fibrils with Applications to Normal Corneas. Appl Opt. 1986;25:2739–2746. doi: 10.1364/ao.25.002739. [DOI] [PubMed] [Google Scholar]
- 22.Meek KM, Dennis S, Khan S. Changes in the Refractive Index of the Stroma and its Extrafibrillar Matrix When the Cornea Swells. Biophysical Jour. 2003;85:2205–2212. doi: 10.1016/s0006-3495(03)74646-3. [DOI] [PMC free article] [PubMed] [Google Scholar]
- 23.Maurice DM. The Cornea and Sclera. In: Davson H, editor. The Eye. Orlando: Academic Press; 1984. pp. 1–158. [Google Scholar]
- 24.Connon CJ, Meek KM. The Structure and Swelling of Corneal Scar tissue in Penetrating Full-Thickness Wounds. Cornea. 2004;23:165–171. doi: 10.1097/00003226-200403000-00010. [DOI] [PubMed] [Google Scholar]
- 25.Farrell RA, McCally RL. On Corneal Transparency and Its Loss with Swelling. J Opt Soc Am. 1976;66:342–345. doi: 10.1364/josa.66.000342. [DOI] [PubMed] [Google Scholar]
- 26.Kostyuk O, Nalovina O, Mubard TM, et al. Transparency of the Bovine Corneal Stroma at Physiological Hydration and its Dependence on Concentration of the Ambient Ion. J Physiol. 2002;543:633–642. doi: 10.1113/jphysiol.2002.021527. [DOI] [PMC free article] [PubMed] [Google Scholar]
- 27.Freund DE, McCally RL, Farrell RA. Light Scattering Tests of Structure in Normal and Swollen Rabbit Corneas. Johns Hopkins APL Tech Dig. 1991;12:137–143. [Google Scholar]
- 28.Meek KM, Leonard DW, Connon CJ, Dennis S, Kahn S. Transparency, Swelling and Scarring in the Corneal Stroma. Eye. 2003;17:927–936. doi: 10.1038/sj.eye.6700574. [DOI] [PubMed] [Google Scholar]
- 29.Rawe IM, Meek KM, Lenonard DW, Takahashi T, Cintron C. Structure of Corneal Scar tissue: An X-Ray Diffraction Study. Biophysical Jour. 1994;67:1743–1748. doi: 10.1016/S0006-3495(94)80648-4. [DOI] [PMC free article] [PubMed] [Google Scholar]
- 30.Ziman JM. Models of Disorder. New York: Cambridge University Press; 1979. pp. 122–127. [Google Scholar]
- 31.Craig AS, Robertson JG, Parry DAD. Preservation of Corneal Collagen Fibril Structure Using Low-Temperature Procedures for Electron Microscopy. Journal of Ultrastructure and Molecular Structure Research. 1986;96:172–175. doi: 10.1016/0889-1605(86)90018-2. [DOI] [PubMed] [Google Scholar]
- 32.Meek KM, Leonard DW. Ultrastructure of the Corneal Stroma: A Comparative Study. Biophys J. 1993;64:213–280. doi: 10.1016/S0006-3495(93)81364-X. [DOI] [PMC free article] [PubMed] [Google Scholar]
- 33.Kanai A, Kaufman HE. Electron Microscopic Studies of Corneal Stroma: Aging Changes of Collagen Fibrils. Ann Ophthalmol. 1973;5:285–292. [PubMed] [Google Scholar]
- 34.Daxer A, Misof K, Grabner B, Ettl A, Fratzl P. Collagen Fibrils in the Human Corneal Stroma: Structure and Ageing. Invest Ophthalmol Vis Sci. 1998;39:644–648. [PubMed] [Google Scholar]
- 35.Jester JV, Møller-Pederson T, Huang J, et al. The Cellular Basis of Corneal Transparency: Evidence for Corneal Crystallins. J Cell Sci. 1999;112:612–622. doi: 10.1242/jcs.112.5.613. [DOI] [PubMed] [Google Scholar]
- 36.Karring H, Thogersen IB, Klintworth GK, Enghild JJ, Moller-Pederson T. Proteomic Analysis of the Soluble Fraction from Human Corneal Fibroblasts with Reference to Ocular Transparency. Mole Cell Proteomics. 2004;3:660–674. doi: 10.1074/mcp.M400016-MCP200. [DOI] [PubMed] [Google Scholar]
- 37.Li X, Taflove A, Backman V. Recent Progress in Exact and ReducedOrder Modeling of Light-Scattering Properties of complex Structures. IEEE Jour Quantum Elec. 2005;11:759–765. [Google Scholar]
- 38.Jester JV, Budge A, Fisher S, Huang J. Corneal Keratocytes: Phenotypic and Species Differences in Abundant Protein Expression and In Vitro Light Scattering. Invest Ophthalmol Vis Sci. 2005;46:2369–2378. doi: 10.1167/iovs.04-1225. [DOI] [PMC free article] [PubMed] [Google Scholar]