Abstract
We report detection and quantification of ultraviolet (UV) damage in DNA at a single molecule level by atomic force microscopy (AFM). By combining the supercoiled plasmid relaxation assay with AFM imaging, we find that high doses of medium wave ultraviolet (UVB) and short wave ultraviolet (UVC) light not only produce cyclobutane pyrimidine dimers (CPDs) as reported but also cause significant DNA degradation. Specifically, 12.5 kJ/m2 of UVC and 165 kJ/m2 of UVB directly relax 95% and 78% of pUC18 supercoiled plasmids, respectively. We also use a novel combination of the supercoiled plasmid assay with T4 Endonuclease V treatment of irradiated plasmids and AFM imaging of their relaxation to detect damage caused by low UVB doses, which on average produced ∼0.5 CPD per single plasmid. We find that at very low UVB doses, the relationship between the number of CPDs and UVB dose is almost linear, with 4.4 CPDs produced per Mbp per J/m2 of UVB radiation. We verified these AFM results by agarose gel electrophoresis separation of UV-irradiated and T4 Endonuclease V treated plasmids. Our AFM and gel electrophoresis results are consistent with the previous result obtained using other traditional DNA damage detection methods. We also show that damage detection assay sensitivity increases with plasmid size. In addition, we used photolyase to mark the sites of UV lesions in supercoiled plasmids for detection and quantification by AFM, and these results were found to be consistent with the results obtained by the plasmid relaxation assay. Our results suggest that AFM can supplement traditional methods for high resolution measurements of UV damage to DNA.
INTRODUCTION
Ultraviolet (UV) light generates DNA damage by several different mechanisms (1,2). Most common types of damage are cyclobutane pyrimidine dimers (CPDs) and 6-4 lesions (3–6). In addition, UV production of oxygen radicals leads to oxidative damage (6,7) and even to single- and double-strand breaks (SSBs and DSBs, respectively) (8–10). Even though UV damage to DNA has been investigated for a long period of time, the application of new, powerful techniques to this research has generated new and surprising results suggesting that the issue of the relevance of different parts of the UV spectrum to carcinogenesis is not yet settled (11,12).
Detecting DNA damage is typically a multistep process involving many enzymatic reactions, various labeling methodologies, and separation of DNA molecules by agarose gel electrophoresis (13,14). Labeling methods of limited sensitivity include the treatment of cells with radioactive compounds, isolation of labeled DNA, and characterization of DNA modifications (adducts) by chemical methods (1). High sensitivity methods include immunoassays, which use specific antibodies produced in response to DNA damage (e.g., by exposure to UV light) (5) and high performance liquid chromatography coupled with mass spectrometry (5,12). Within the last 10 years or so, single-cell gel electrophoresis, or the comet assay, was established as one of the standard methods for evaluating DNA damage (15,16).
Since DNA alterations vary from one DNA molecule to another, it would be advantageous to be able to detect various lesions in individual molecules. The last decade witnessed a rapid development of new single-molecule techniques which also find useful applications in detecting DNA damage (17). Atomic force microscopy (AFM) has emerged as one of the leading techniques for single-molecule manipulation and imaging in biology thanks to its simplicity and unmatched ability to examine individual DNA, proteins, and DNA-protein complexes under nearly in vivo conditions (18–44). Yet, this fairly new and very promising type of microscopy has so far found a relatively limited application in DNA damage and repair research (45–53). For example, Wang et al. studied the interaction between MutS and DNA in the DNA mismatch repair system (45). Chen et al. employed AFM cantilevers with carbon nanotube probes to visualize human 8-oxoguanine DNA glycosylase scanning DNA in the search for damage (46). Murakami et al. compared the results obtained by AFM imaging of supercoiled plasmids damaged by high doses of γ-radiation with the results obtained by gel electrophoresis of damaged DNA (47), and Pang et al. investigated strand breaks in supercoiled DNA plasmid induced by high doses of various types of radiation (48,49).
Here we use AFM imaging to directly examine UV damage to supercoiled DNA. Our assay involves AFM imaging of the changes in the topology of supercoiled DNA plasmids that are caused by UV-induced SSBs and DSBs and by T4 Endonuclease V driven incisions of the plasmid at the sites of pyrimidine dimers. We also exploit photolyase, a UV damage repair protein, to mark the CPD sites for AFM imaging detection. Finally, we compare the results of our AFM study with the results obtained by gel electrophoresis of UV-irradiated DNA and with the published results obtained with other traditional methods of UV damage detection.
MATERIALS AND METHODS
Materials
pUC18 was isolated from Escherichia coli and purified using the QiaFilter plasmid maxi kit (Qiagen, Hilden, Germany). pNEBR-R1 was purchased from New England Biolabs (Beverly, MA). T4 Endonuclease V was purchased from Epicentre Biotechnologies (Madison, WI). E. coli photolyase was bought from Trevigen (Gaithersburg, MD). D-Mannitol was bought from Calbiochem (San Diego, CA).
UV irradiation
Short wave ultraviolet (UVC) and medium wave ultraviolet (UVB) irradiations were performed at the wavelengths of 254 and 302 nm, respectively, using a multiwavelength UV lamp (model: 3UV-36) from UVP (Upland, CA). The intensity of UV light was measured by a UVX Radiometer from UVP; and 50 μl of supercoiled pUC18 DNA in 10 mM Tris HCl, 1 mM EDTA, and 100 mM NaCl at 40 μg/ml solution was exposed to UV light at room temperature for different times.
Treatment of DNA with T4 Endonuclease V
For recording images in air, irradiated or control supercoiled pUC18 plasmids (5.64 nM) were incubated with T4 Endonuclease V (5.64 nM) in 50 mM Tris HCl and 5 mM EDTA buffer with a total volume of 40 μl at 37°C for 30 min. Then the solution was diluted by 10 mM Tris HCl, 1 mM EDTA, and 100 mM NaCl buffer to the final DNA concentration of 0.5–1 μg/ml.
Treatment of DNA with photolyase
pUC18 DNA (5.64 nM) was incubated with photolyase (56.4 nM) in 20 mM Tris HCl, 1 mM EDTA, 1 mM dithiothreitol, and 50 mM NaCl with a total volume of 40 μl for 30 min. The incubation was performed at room temperature in the dark to prevent photolyase from repairing damage and disassociating from damage sites. Then the solution was diluted by the addition of 10 mM Tris HCl, 1 mM EDTA, and 5–10 mM MgCl2 buffer to the final DNA concentration of 0.5–1 μg/ml for AFM imaging.
Immobilization of DNA molecules for AFM imaging
1-(3-Aminopropyl)silatrane-functionalyzed mica (APS-mica) was used for the binding of DNA molecules. APS-mica was prepared as described by Shlyakhtenko et al. (31). A drop of 30–50 μl of DNA solution (DNA concentration of 0.5–1 μg/ml) was deposited on the APS-mica surface at room temperature for 3 min. The sample was rinsed and air dried before imaging.
AFM imaging
Images were taken by a Nanoscope IIIa MultiMode Scanning Probe Microscope (Veeco Instruments, Santa Barbara, CA) using tapping mode with an E scanner. RTESP probes (Veeco) were used for imaging in air. The spring constant of AFM cantilevers was 20–80 N/m, and their resonance frequency was 275–316 kHz. All images were collected at a scan rate of 2.0–3.0 Hz, a scan line of 512 × 512 pixels, and scan sizes of 1000–5000 nm. In each experiment, 18–36 AFM images were captured and analyzed to determine the fractions of supercoiled, circular, and linear molecules. The results are expressed as the mean ± SD for each fraction.
Gel electrophoresis
DNA was separated on 1% agarose gel, and the bands were analyzed by Quantity One software (Bio-Rad Laboratories, Hercules, CA). It is known that the efficacy of binding of ethidium bromide to supercoiled DNA is different from the efficacy of binding ethidium bromide to circular or linear DNA (54) and that it depends on specific DNA buffer conditions. Thus, to carry out quantitative gel electrophoresis of UV-irradiated DNA it is first necessary to determine a correction factor that accounts for these differences by measuring the intensity of bands within the gel that contain the known amounts of supercoiled and circular/linear DNA. We ran gel electrophoresis of the pUC18 with the supercoiled/linear ratio of 100:0, 75:25, 50:50, 25:75, and 0:100 and found that the intensity of the band containing linear DNA is 1.23 times greater than the intensity of the band containing the same amount of supercoiled DNA. Thus, the correction factor under our experimental condition is 1.23.
RESULTS AND DISCUSSION
AFM imaging of intact supercoiled DNA
Supercoiled DNA is a very good model for studying DNA damage because its structure is highly sensitive to environmental conditions (55,56) to which it responds by large topological changes. This is because the introduction of even one SSB in a supercoiled DNA will immediately relax its superhelical structure, and the plasmid will take on a topologically relaxed form. Similarly, one DSB will open the plasmid and will convert its structure to a linear form. More DSBs will fragment the plasmid to linear duplexes of shorter lengths as compared to the original length. All these topological/lengths variations of DNA are easy to resolve and quantify by gel electrophoresis (9,10,57) and AFM (30–32,47–51). In this work, we detect UV damage to supercoiled DNA directly, by visualizing individual intact and damaged plasmids in the atomic force microscope. We chose tapping mode AFM imaging because it minimizes the physical contact of the AFM tip with the sample and, therefore, minimizes the chance of introducing additional (artifactual) damage into the structure of the supercoiled plasmids.
However, it is important to realize that some structural changes may occur in intact supercoiled DNA upon the binding of plasmids to the mica surface, a standard substrate for AFM analysis of DNA. For example, it was shown that intact supercoiled DNA take on a more or less circular shape upon binding to a mica surface in the presence of low concentrations of cations (30,32,55,56), and such “relaxed” shapes could be erroneously interpreted as evidence that the plasmid suffered SSBs. Shlyakhtenko et al. showed that the conformation of supercoiled DNA remains practically unchanged when DNA binds from high salt buffer solutions to the APS-mica (31,36). Unlike untreated mica, which is negatively charged and requires divalent cations for a deposition of DNA, APS-mica is positively charged and supercoiled DNA becomes immobilized quite effectively in the presence of monovalent salts that do not affect its topology. In our method, we suspend supercoiled pUC18 DNA plasmids in 10 mM Tris HCl buffer which is supplemented with 1 mM EDTA and 100 mM NaCl to preserve the supercoiled structure of DNA (23,30,32,55,56).
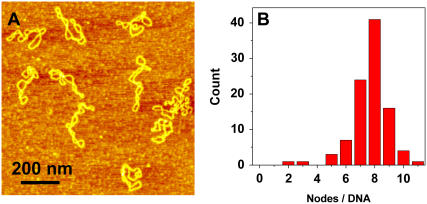
Shown in Fig. 1 A is a typical AFM image, obtained in air, of some pUC18 molecules (2686 basepairs) after they had been deposited on the APS-mica from a buffer solution. We see that neither the binding to the mica nor the AFM tip significantly affect the DNA structure, which remains in the plectonemic supercoiled configuration. Following approaches developed earlier for electron microscopy and AFM imaging of supercoiled plasmids (30,56,58), we counted the number of nodes in single DNA molecules as the number of visible crossover points in AFM images, such as shown in Fig. 1 A (30). We show the distribution of the number of nodes in Fig. 1 B. For a given plasmid size, the number of supercoiled nodes typically varies somewhat among different molecules and also depends on the concentration of salts in the buffer and deposition conditions (59). In the case of pUC18, we used the same buffer with 100 mM NaCl in all experiments. For intact pUC18 we found that the average number of nodes is eight, and this is consistent with the expected value for a supercoiled DNA composed of 2686 basepairs (23,30,55,56); <5% ± 1% (mean ± SD) of the plasmids show fewer than six nodes. We assume that these plasmids represent a background of damaged DNA in our sample of “intact” pUC18 after DNA purification using the QiaFilter plasmid maxi kit. Further experiments, using T4 Endonuclease V nuclease to nick pUC18 plasmids which were briefly exposed to UV radiation support our choice of five nodes as the borderline between damaged and undamaged DNA (see inset in Fig. 5 G, main text). In the following discussion we assume that pUC18 molecules with a number of nodes greater than five are intact, whereas the number of nodes equal to or less than five will be indicative of some structural alterations within supercoiled DNA. By this criterion, our pUC18 DNA samples contain >95% ± 1% of intact supercoiled DNA, and this high percentage of intact DNA is important for a reliable quantification of DNA damage inflicted by UV radiation. To further assess the accuracy of our method that relies on visual inspection of AFM images, we determined that the difference between the results obtained by different persons on the same data set was <5%.
FIGURE 1.
AFM image of intact pUC18 plasmids reveal their supercoiled topology. (A) Tapping mode AFM image of pUC18 adsorbed to APS-mica surface. Scan size 1 × 1 μm2. (B) The frequency distribution of the number of supercoiled nodes in intact pUC18 plasmids (based on 21 AFM images).
FIGURE 5.
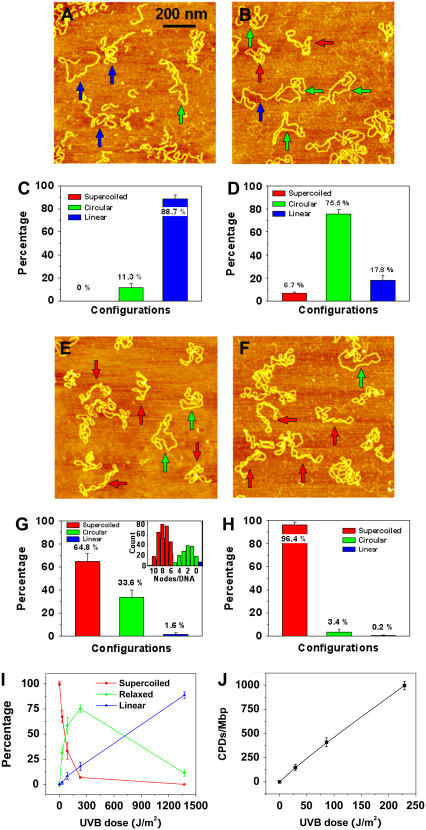
AFM images of pUC18 molecules irradiated with different doses of UVB radiation and incubated with T4 Endonuclease V: (A) 1.4 kJ/m2-irradiated pUC18, (B) 229 J/m2-irradiated pUC18, (E) 29 J/m2-irradiated pUC18, and (F) intact pUC18 (control experiment). All scan sizes are 1 × 1 μm2. (C, D, G, H) Histograms of the occurrence of various configurations of pUC18 plasmids determined from AFM images such as these shown in (A, B, E, F). Color code and error bar are the same as in Fig. 2. Each histogram is based on 19–36 AFM images. (I) Percentages of different configurations of irradiated pUC18 as a function of UVB dose. (J) The number of CPDs per million basepairs as a function of UVB dose, supposing the distribution of CPDs follows Poisson.
AFM detection of SSBs and DSBs caused by UVC and UVB
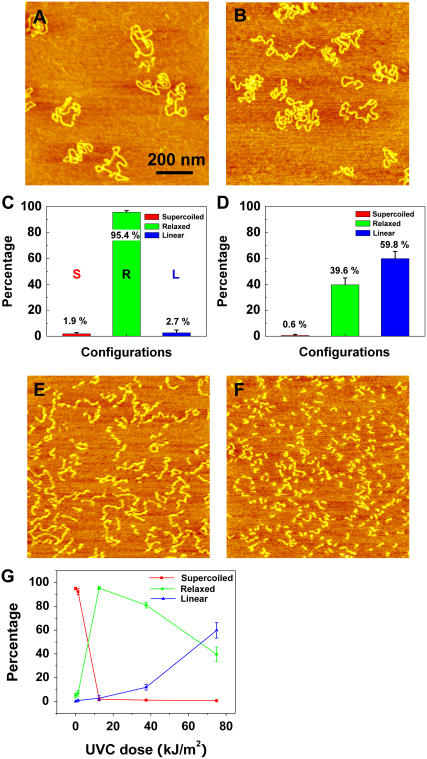
Fig. 2 shows AFM images of pUC18 plasmids which were exposed to various doses of UVC (254 nm). At the dose of 12.5 kJ/m2, almost all plasmids relaxed, as shown in Fig. 2, A and C, with 95% ± 1% of the molecules having at least one SSB. At the dose of 75 kJ/m2, 60% ± 6% of the plasmids became linear, indicating that these molecules developed DSB (Fig. 2, B and D). At the doses of 300 kJ/m2 and 600 kJ/m2, significant DNA degradation occurred, as can be seen from Fig. 2, E and F, which shows that DNA segments significantly shortened and finally became dot like. In addition, in Fig. 2 E DNA is zigzagged, suggesting that it has many SSBs, possibly forming clustered damage sites that result in the decrease of the persistence length. Fig. 2 G summarizes the above results; the half-relaxation and half-linearization dose is 6.6 and 67 kJ/m2, respectively.
FIGURE 2.
AFM images of UVC-irradiated pUC18 molecules at different doses: (A) 12.5 kJ/m2, (B) 75 kJ/m2, (E) 150 kJ/m2, (F) 600 kJ/m2. C and D histograms count the various configurations of pUC18 molecules shown in A and B. Color code: red, supercoiled DNA; green, relaxed circular plasmids; blue, linear DNA “L”. The error bars in the figures represent standard deviation. Each histogram is based on 30–36 AFM images. (G) Percentages of different configurations of irradiated pUC18 as a function of UVC dose.
Recently, Lysetska et al. used AFM to investigate UVC-induced damage in linear DNA, and they also reported a reduction in the size of irradiated molecules and their collapse to spherical structures (52). However, they did not observe any significant degradation of the DNA even after a prolonged exposure to UVC as evaluated by gel electrophoresis separation of the DNA. Although a direct comparison of our results to Lysetska's et al. results is not possible, because they did not report the exact UV doses, our results clearly reveal a significant amount of DNA degradation due to UVC-induced DSBs in pUC18 supercoiled plasmids.
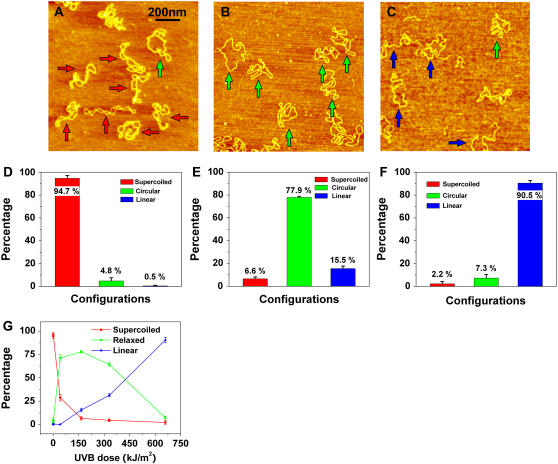
Fig. 3 shows AFM images of pUC18 molecules exposed to UVB (302 nm) radiation and not treated with T4 Endonuclease V. We find that at a dose of 1.4 kJ/m2, the configuration of DNA molecules did not change significantly as compared to the molecules that did not receive any UV treatment, with ∼95% ± 2% of the plasmids having more than five supercoiled nodes (Fig. 1, A and B); <5% ± 2% of the plasmids show five or fewer nodes. We assume that these plasmids represent a background of damaged DNA in our sample of pUC18. In a previous study, Setlow and Carrier reported that DNA extracted from various organisms and exposed to UVB radiation (280 nm, 4 kJ/m2) on average developed 13,630 CPDs per one million basepairs (3). Extrapolating their data to our dose and plasmid length, we estimate that each plasmid should develop ∼13 CPDs. However, this number of lesions does not significantly alter the topology of pUC18 inspected by AFM.
FIGURE 3.
AFM images of pUC18 molecules subjected to different doses of UVB radiation: (A) 1.4 kJ/m2, (B) 165 kJ/m2, (C) 660 kJ/m2. Scan size in all the images is 1 × 1 μm2. (D–F) Histograms of the occurrence of various configurations of pUC18 plasmids determined from the AFM images such as these shown in (A–C). Color code and error bar are the same as in Fig. 2. Each histogram is based on 18–25 AFM images. (G) Percentages of different configurations of irradiated pUC18 as a function of UVB dose.
In Fig. 3, B and C, we show pUC18 molecules which were exposed to 165 kJ/m2 and 660 kJ/m2 of UVB radiation, respectively. We find that among molecules subjected to 165 kJ/m2, ∼78% ± 1% are relaxed circular plasmids and 16% ± 2% are linear fragments (Fig. 3, B and E). At 660 kJ/m2 of UVB radiation, this fraction, including fragments with a significantly reduced length, increased to 91% ± 3% (Fig. 3, C and F). Thus, our results show that not only UVC but also UVB can cause significant degradation of DNA. These findings are summarized in Fig. 3 G and show that the half-relaxation and half-linearization doses are 28 kJ/m2 and 380 kJ/m2, respectively. We conclude that at very high doses of UVB radiation, pUC18 plasmids develop SSBs and DSBs, which relax the plasmids to a circular shape and linearize them, respectively. Comparing the half-relaxation and half-linearization dose of UVB with UVC, we find that UVB is ∼4.2 and 5.7 times less effective than UVC in terms of producing SSBs and DSBs, respectively. Observed here, significant degradation of DNA is similar to DNA fragmentation caused by ionizing radiation (9,10,47,49,50). We therefore hypothesize that this effect is initiated by UV-produced free radicals (4,6).
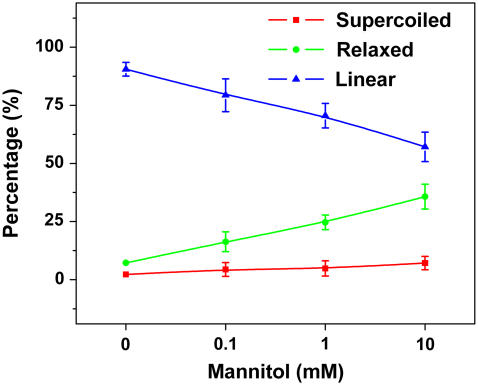
To test this hypothesis, we irradiated the DNA with high dose UVB radiation in the presence of mannitol, the known hydroxyl free radical scavenger (60,61). As shown in Fig. 4, the percentage of linear plasmids decreased with the increased concentration of mannitol, confirming the hypothesis.
FIGURE 4.
Percentage of pUC18 with different structures after 660 kJ/m2 UVB radiation as a function of the concentration of Mannitol.
AFM detection of CPDs in UVB-irradiated pUC18 plasmids treated by T4 Endonuclease V
T4 Endonuclease V functions as part of the base-excision repair pathway and recognizes and removes pyrimidine dimers. The enzyme binds to UV-irradiated DNA and scans the DNA until it encounters a pyrimidine dimer. The enzyme then cleaves the glycosyl bond of the 5′-pyrimidine of the dimer and the 3′-phosphodiester bond, which results in an SSB in the DNA (1,62). The idea of detecting various DNA lesions by enzymatically converting them into SSBs was already successfully implemented in several assays (7,15).
We hypothesized that a similar approach should enhance the sensitivity of our AFM imaging assay for detecting lesions caused by UVB radiation. We exploit the ability of T4 Endonuclease V to incise DNA at a CPD location, and we predict that such an action will relax UV-treated pUC18 plasmids to a circular form, which should be easy to identify in the AFM. In Fig. 5, we show AFM images of pUC18 molecules, which were exposed to various doses of UVB radiation then treated in solution with T4 Endonuclease V for 30 min and subsequently deposited on APS-mica surface, dehydrated, and AFM imaged in air.
In Fig. 5 A, we see the molecules, which were exposed to 1.4 kJ/m2 of UVB radiation and then treated with T4 Endonuclease V. By analyzing this image and other similar images, we determined that ∼89% ± 3% of these plasmids converted to a linear form and 11% ± 3% relaxed to a circular form with fewer than five nodes (Fig. 5 C). These results indicate that ∼89% ± 3% of the T4 Endonuclease V treated plasmids developed at least one DSB. This is possible because at this radiation dose we expect at least 13 CPDs per plasmid (see above) and it only takes two apposed incisions on both strands to create a DSB. These measurements show that the treatment of irradiated DNA with T4 Endonuclease V indeed greatly enhances the sensitivity of the AFM assay to detect CPD lesions by converting them to SSBs and DSBs.
In subsequent measurements, we gradually decreased the dose of UVB radiation to test whether our assay can detect a single CPD in a single plasmid. In Fig. 5 B we show an AFM image of pUC18 molecules, which were exposed to a much lower dose of 229 J/m2 of UVB, and then incubated with T4 Endonuclease V. We can see that at this dose, most of the DNA molecules are in a relaxed closed circular form (∼76% ± 4%) and ∼18% ± 4% in a linear form (Fig. 5 D). Upon further decreasing the UVB dose to 29 J/m2 (Fig. 5, E and G), the AFM captured <2% ± 1% of pUC18 to be in a linear form, ∼34% ± 6% in a relaxed, closed circular form (five or fewer supercoiled nodes), and ∼65% ± 6% to be intact (six or more nodes). Assuming that the number of CPDs follows a Poisson distribution (63,64), after subtracting preexisted background damage, we estimate the average number of CPD lesions per DNA plasmid at the dose of 229 J/m2 to be 2.7 (λ = 2.7) and at the dose of 29 J/m2 to be 0.40 (λ = 0.40). Further, we estimate that at the dose of 229 J/m2, 18% of the relaxed DNA plasmids have just one CPD, 25% have two CPDs, 22% have three CPDs, and 15% have four CPDs, whereas at the dose of 29 J/m2, these numbers are 27%, 5%, 0.7%, and 0.1%, respectively. We counted the number of supercoiled nodes in each DNA molecule in Fig. 5 E and similar images obtained from this sample and found that they produce a bimodal distribution with the two halves crossing each other at five nodes (Fig. 5 G, inset). This result supports our earlier conjecture that plasmids with five or fewer supercoiled nodes should be considered damaged. Fig. 5 F shows an AFM image obtained on pUC18 molecules, which did not receive any UVB radiation but were treated with T4 Endonuclease V. It is clear that a vast majority of these plasmids (96% ± 2%, Fig. 5 H) is resistant to T4 Endonuclease V and that the percentage of relaxed circular plasmids is consistent with the fraction of damaged molecules in the original stock sample that has not been exposed to UV radiation or to a T4 Endonuclease V treatment (Fig. 1). Thus, we conclude that T4 Endonuclease V does not incise undamaged plasmids and that all damage to DNA (above background damage) is the result of UV treatment.
Our results indicate that after subtracting preexisted background damage, 229 J/m2 of UVB radiation causes 2.7 CPD lesions per pUC18 plasmids, which is equivalent to ∼1000 ± 50 CPDs per one million basepairs, whereas 29 J/m2 of UVB radiation causes 0.40 CPD lesion per pUC18 plasmids, which is equivalent to ∼150 ± 30 CPDs per one million basepairs. Thus, at low UVB doses, the relationship between the number of CPDs and UVB dose is almost linear and 4.4 CPDs are produced per Mbp per J/m2 of UVB radiation (Fig. 5 J). Fig. 5 I summarizes our findings presented in Fig. 5, A–H, and shows the changes in the percentage of different topological fractions of T4 Endonuclease V treated pUC18 as a function of UVB dose. The half-relaxation and half-linearization doses are 60 J/m2 and 720 J/m2, respectively. The treatment of irradiated plasmids with T4 Endonuclease V increases the sensitivity of damage detection by more than 500 times. We conclude that with the assistance of T4 Endonuclease V, AFM imaging can capture even single CPD lesions in single DNA molecules.
Direct visualization of CPD sites by AFM imaging of photolyase
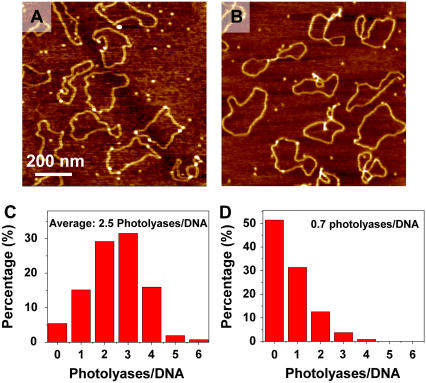
So far we have used T4 Endonuclease V to trigger the relaxation of irradiated supercoiled DNA to detect CPD lesions. In an alternative approach, we exploited the ability of photolyase to recognize CPDs. Photolyase is a 54 kDa enzyme specialized in DNA photoreactivation (65) that can be directly visualized by AFM imaging (66). In Fig. 6 A we show an AFM image obtained on pUC18 plasmids irradiated with UVB (229 J/m2) and incubated with photolyase, and in Fig. 6 B we show the control image of untreated DNA after the incubation with photolyase. As stated in Materials and Methods, we incubated photolyase with DNA in the standard condition as suggested by the product supplier. However, in the next immobilization step, we used a very low salt concentration in the deposition buffer (no Na+ and only 5 mM Mg2+), because under these conditions supercoiled plasmids are forced to assume a circular form (23,55). Since DNA molecules were immobilized on the mica surface and fixed quickly in this step, we assumed that the low salt condition did not affect the function of the photolyase observably. The elimination of supercoiled nodes, which produce height features in AFM images, allowed for more accurate detection of photolyases as the spots on DNA with an elevated height (bright dots in Fig. 6, A and B). Fig. 6, C and D, shows that on average 2.5 photolyases are located on each irradiated pUC18 molecule and 0.7 on the untreated DNA (nonspecific binding). Thus, using the photolyase assay and after subtracting the number of nonspecifically bound enzymes, we estimate 1.8 photolyase-sensitive sites per plasmid at 229 J/m2. We conclude that the number of photolyase-sensitive sites is somewhat lower than the number of T4 Endonuclease V sensitive sites (2.7 CPDs/plasmid). This difference probably reflects a dynamic equilibrium between the bound and unbound photolyase in solution, which leaves some CPD sites on DNA unoccupied. In addition, whereas T4 Endonuclease V makes an incision at all CPD sites, the photolyase that we used detects a subset of all CPDs, namely the cis-syn CPD (1).
FIGURE 6.
AFM images show photolyases binding to the CPD sites of pUC18 with (A) 229 J/m2 UVB radiation, and (B) no UV as control. (C) and (D) Histograms show the distribution of photolyases on each pUC18 molecules as shown in A and B.
Sensitivity of damage detection increases with plasmid size
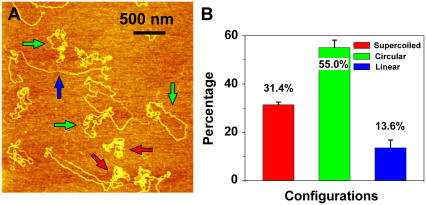
If it is true that one nick is enough to relax a supercoiled plasmid, then increasing the size of the plasmid should also increase the sensitivity of our damage detection scheme. To test this hypothesis we irradiated pNEBR-R1 supercoiled DNA plasmids composed of 10,338 basepairs with 29 J/m2 of UVB radiation and imaged these plasmids in the AFM, after treating them with T4 Endonuclease V. Fig. 7 shows a representative AFM image of these plasmids. From images similar to the one shown in Fig. 7 we find that 55% ± 3% of pNEBR-R1 plasmids are in the relaxed circular form (at least one pyrimidine dimer) and ∼14% ± 3% are already in the linear form (at least two damage sites in proximity on the opposite strands). In control experiments on intact pNEBR-R1 molecules, we found that more than 96% of the plasmids are in the supercoiled configuration. From the percentage of supercoiled molecules, we estimate that pNEBR-R1 plasmids developed at least 1.12 ± 0.035 CPD/plasmid (λ = 1.12), i.e., 108 ± 13 CPD/Mbp. Thus, increasing the size of the supercoiled plasmid by 3.8-fold resulted in a >2.8-fold (2.8 = 1.12/0.40) increase in damage detection sensitivity, which is consistent with our predictions.
FIGURE 7.
Sensitivity of damage detection increases with plasmid size. (A) An AFM image of supercoiled plasmid pNEBR-R1 (10,338 basepairs) irradiated at 29 J/m2 UVB. Scan size 3 × 3 μm2. (B) Percentages of different configurations of pNEBR-R1 plasmids determined from AFM images such as these shown in A. Color code is the same as in Fig. 2.
Comparison of our assay with traditional damage detection methods
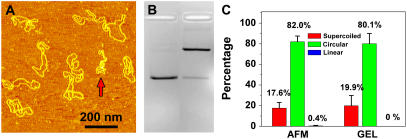
It is important to compare our results with the results obtained by well-established methods such as the gel electrophoresis assay. Fig. 8 shows the AFM and electrophoresis results of the same pUC18 DNA that was irradiated with 135 J/m2 of UVB and incubated with T4 Endonuclease V. The quantitative results as shown in Fig. 8 C are consistent, which indicates that AFM is an accurate tool to quantify DNA damages.
FIGURE 8.
(A) AFM images of pUC18 molecules irradiated with 135 J/m2 UVB radiation and incubated with T4 Endonuclease V. (B) Agarose gel electrophoresis image: lane 1: control, and lane 2: the same sample as in Fig. 8 A. (C) Histograms compare the distributions obtained by AFM and gel electrophoresis as shown in A and B.
It is also interesting to compare our results with the results obtained by traditional DNA damage detection methods in cell-free systems and on DNA extracted from UVB irradiated cells. We can estimate the number of CPDs/Mbp obtained by other researchers by extrapolating their results to our dose of 229 J/m2 of UVB (∼300 nm). For example, Setlow and Carrier (3), who extracted radio-labeled DNA from Hemophilis influenzae and irradiated it at 280 nm and 4 kJ/m2, estimated the number of CPDs/100 basepairs to be 2.06. Assuming that the number of CPDs scales linearly also between 229 J/m2 and 4000 J/m2, we find that Setlow and Carrier's data correspond to 1180 CPDs/Mbp at 229 J/m2, which is similar to our own result (∼1000 CPDs/Mbp). A similar extrapolation of the results obtained by Kielbassa et al. (7), who used an alkaline elution assay in conjunction with T4 Endonuclease V on DNA from irradiated Chinese hamster ovary cells, yields only 1.3 CPD/Mbp; and extrapolating the results of Besaratinia et al. (5), who used immunodot blot assay on DNA obtained from irradiated human fibroblasts, yields 5.6 CPD/Mbp. Thus, our results indicate that a ∼20–100-fold greater number of CPDs are generated by UVB radiation in cell-free DNA systems, as compared to genomic DNA. These differences likely reflect protective properties of the cellular and nucleosomal environment against UV damage.
Advantages of the AFM assay
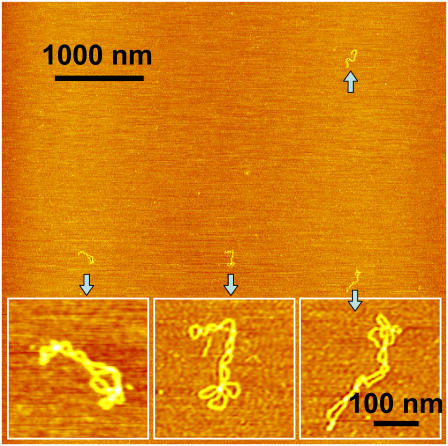
Separating DNA molecules by agarose gel electrophoresis is an extremely powerful, versatile, easy to use, sensitive, and quite rapid technique that has been contributing enormously to the progress of DNA damage and repair research. Over the last 10 years or so AFM has been making steady progress in demonstrating its unique usefulness in furthering this research. In our opinion the two features of AFM that make it particularly suitable for examining DNA damage and repair are a), the ability to examine individual DNA molecules and DNA protein complexes under nearly in vivo conditions, and b), extremely small amounts of DNA and protein material needed for the observation. To illustrate this last point we spread 0.1 μl of a pUC18 plasmid solution containing the total amount of 1 pg of DNA (10 pg/μl) over the mica surface and imaged the surface at a big scan size (5 × 5 μm2). The AFM image shown in Fig. 9 captured four DNA molecules whose configuration was evaluated by scanning locally at an increased resolution (see Fig. 9 insets). Thus, our measurements can be performed on an amount of DNA that is ∼400 times less than what is presently needed for the most sensitive gel electrophoresis assays (67), which amounts to ∼1/5 of the DNA in a single mammalian cell (Table 1). We suggest that in some studies it may be advantageous to combine the power of gel electrophoresis with the power of AFM imaging. Gel electrophoresis would separate the damaged DNA into discrete bands, and the DNA extracted from a particular band would provide enough material to be further examined by high resolution AFM imaging.
FIGURE 9.
AFM image of intact pUC18 plasmids obtained from a sample that contained the total amount of 1 pg of DNA material. Scan size 5 × 5 μm2. The inset images obtained at a higher resolution show in detail the supercoiled structure of these plasmids. The scale bar for these inset images is 100 nm. The sample was prepared by spreading 0.1 μl of a 10 pg/μl solution of pUC18 on the APS-mica surface and incubating for 3 min. This assay requires extremely small amounts of DNA to evaluate damage.
TABLE 1.
Comparison of DNA detection sensitivity by gel electrophoresis and by AFM
| Gel Electrophoresis | AFM | |
|---|---|---|
| Minimum amount of DNA | ∼400 pg per lane (67) | ∼1 pg (total) |
| Sensitivity | ∼25 pg per band (67), (equivalent to 8.5 × 10⁶ pUC18 molecules) | Single molecules |
CONCLUSIONS
In summary, we examined UV damage to DNA at a single-molecule level. Using AFM imaging, we directly captured SSBs, DSBs, and a significant degradation of supercoiled DNA plasmids induced by high doses of UVB and UVC. By exploiting T4 Endonuclease V to convert damaged sites in supercoiled DNA into SSBs, we were able to detect, with AFM, single damage sites in individual plasmids caused by low doses of UVB radiation. We also showed that damage detection sensitivity is affected by the size of a supercoiled plasmid. In an alternative approach, we directly visualized and quantified UV lesions in irradiated DNA by AFM imaging of photolyase attached to DNA at CPD sites. We also verified that AFM-based results agree with the results obtained by agarose gel electrophoresis. We suggest combining the gel electrophoresis assay with AFM imaging for high resolution measurements of DNA damage.
Acknowledgments
We are grateful to Dr. Alexander Lushnikov and Dr. Yuri Lyubchenko for sharing their APS-mica preparation techniques with us and to Dr. Alexander Gall for providing the APS synthesis protocol.
This work was funded by National Science Foundation and National Institutes of Health grants to P.E.M.
Editor: Jane Clarke.
References
- 1.Friedberg, E. C., G. C. Walker, and W. Siede. 1995. DNA Repair and Mutagenesis. ASM Press, Washington, DC.
- 2.Sinha, R. P., and D. P. Hader. 2002. UV-induced DNA damage and repair: a review. Photochem. Photobiol. Sci. 1:225–236. [DOI] [PubMed] [Google Scholar]
- 3.Setlow, R. B., and W. L. Carrier. 1966. Pyrimidine dimers in ultraviolet-irradiated DNA's. J. Mol. Biol. 17:237–254. [DOI] [PubMed] [Google Scholar]
- 4.Douki, T., A. Reynaud-Angelin, J. Cadet, and E. Sage. 2003. Bipyrimidine photoproducts rather than oxidative lesions are the main type of DNA damage involved in the genotoxic effect of solar UVA radiation. Biochemistry. 42:9221–9226. [DOI] [PubMed] [Google Scholar]
- 5.Besaratinia, A., T. W. Synold, H.-H. Chen, C. Chang, B. Xi, A. D. Riggs, and G. P. Pfeifer. 2005. DNA lesions induced by UV A1 and B radiation in human cells: comparative analyses in the overall genome and in the p53 tumor suppressor gene. Proc. Natl. Acad. Sci. USA. 102:10058–10063. [DOI] [PMC free article] [PubMed] [Google Scholar]
- 6.Cadet, J., E. Sage, and T. Douki. 2005. Ultraviolet radiation-mediated damage to cellular DNA. Mutat. Res. 571:3–17. [DOI] [PubMed] [Google Scholar]
- 7.Kielbassa, C., L. Roza, and B. Epe. 1997. Wavelength dependence of oxidative DNA damage induced by UV and visible light. Carcinogenesis. 18:811–816. [DOI] [PubMed] [Google Scholar]
- 8.Wehner, J., and G. Horneck. 1995. Effects of vacuum UV and UVC radiation on dry E. coli plasmid pUC19.1. Inactivation, lacZ(-) mutation induction and strand breaks. J. Photochem. Photobiol. B. 28:77–85. [DOI] [PubMed] [Google Scholar]
- 9.Folkard, M., K. M. Prise, B. Vojnovic, B. Brocklehurst, and B. D. Michael. 2000. Critical energies for SSB and DSB induction in plasmid DNA by vacuum-UV photons: an arrangement for irradiating dry or hydrated DNA with monochromatic photons. Int. J. Radiat. Biol. 76:763–771. [DOI] [PubMed] [Google Scholar]
- 10.Folkard, M., K. M. Prise, C. J. Turner, and B. D. Michael. 2002. The production of single strand and double strand breaks in DNA in aqueous solution by vacuum UV photons below 10 eV. Radiat. Prot. Dosim. 99:147–149. [DOI] [PubMed] [Google Scholar]
- 11.Mitchell, D. 2006. Revisiting the photochemistry of solar UVA in human skin. Proc. Natl. Acad. Sci. USA. 103:13567–13568. [DOI] [PMC free article] [PubMed] [Google Scholar]
- 12.Mouret, S., C. Baudouin, M. Charveron, A. Favier, J. Cadet, and T. Douki. 2006. Cyclobutane pyrimidine dimers are predominant DNA lesions in whole human skin exposed to UVA radiation. Proc. Natl. Acad. Sci. USA. 103:13765–13770. [DOI] [PMC free article] [PubMed] [Google Scholar]
- 13.Sutherland, B. M., P. V. Bennett, O. Sidorkina, and J. Laval. 2000. Clustered DNA damages induced in isolated DNA and in human cells by low doses of ionizing radiation. Proc. Natl. Acad. Sci. USA. 97:103–108. [DOI] [PMC free article] [PubMed] [Google Scholar]
- 14.Sutherland, B. M., A. G. Georgakilas, P. V. Bennett, J. Laval, and J. C. Sutherland. 2003. Quantifying clustered DNA damage induction and repair by gel electrophoresis, electronic imaging and number average length analysis. Mutat. Res. 531:93–107. [DOI] [PubMed] [Google Scholar]
- 15.Collins, A. R. 2004. The comet assay for DNA damage and repair—principles, applications, and limitations. Mol. Biotechnol. 26:249–261. [DOI] [PubMed] [Google Scholar]
- 16.Brendler-Schwaab, S., A. Hartmann, S. Pfuhler, and G. Speit. 2005. The in vivo comet assay: use and status in genotoxicity testing. Mutagenesis. 20:245–254. [DOI] [PubMed] [Google Scholar]
- 17.Filippova, E. M., D. C. Monteleone, J. G. Trunk, B. M. Sutherland, S. R. Quake, and J. C. Sutherland. 2003. Quantifying double-strand breaks and clustered damages in DNA by single-molecule laser fluorescence sizing. Biophys. J. 84:1281–1290. [DOI] [PMC free article] [PubMed] [Google Scholar]
- 18.Mou, J. X., D. M. Czajkowsky, Y. Y. Zhang, and Z. F. Shao. 1995. High-resolution atomic-force microscopy of DNA—the pitch of the double helix. FEBS Lett. 371:279–282. [DOI] [PubMed] [Google Scholar]
- 19.Guthold, M., M. Bezanilla, D. A. Erie, B. Jenkins, H. G. Hansma, and C. Bustamante. 1994. Following the assembly of RNA-polymerase DNA complexes in aqueous-solutions with the scanning force microscope. Proc. Natl. Acad. Sci. USA. 91:12927–12931. [DOI] [PMC free article] [PubMed] [Google Scholar]
- 20.Hansma, H. G., D. E. Laney, M. Bezanilla, R. L. Sinsheimer, and P. K. Hansma. 1995. Applications for atomic-force microscopy of DNA. Biophys. J. 68:1672–1677. [DOI] [PMC free article] [PubMed] [Google Scholar]
- 21.Bustamante, C., and C. Rivetti. 1996. Visualizing protein-nucleic acid interactions on a large scale with the scanning force microscope. Annu. Rev. Bioph. Biom. 25:395–429. [DOI] [PubMed] [Google Scholar]
- 22.Wyman, C., I. Rombel, A. K. North, C. Bustamante, and S. Kustu. 1997. Unusual oligomerization required for activity of NtrC, a bacterial enhancer-binding protein. Science. 275:1658–1661. [DOI] [PubMed] [Google Scholar]
- 23.Lyubchenko, Y. L., and L. S. Shlyakhtenko. 1997. Visualization of supercoiled DNA with atomic force microscopy in situ. Proc. Natl. Acad. Sci. USA. 94:496–501. [DOI] [PMC free article] [PubMed] [Google Scholar]
- 24.Guthold, M., X. S. Zhu, C. Rivetti, G. L. Yang, N. H. Thomson, S. Kasas, H. G. Hansma, B. Smith, P. K. Hansma, and C. Bustamante. 1999. Direct observation of one-dimensional diffusion and transcription by Escherichia coli RNA polymerase. Biophys. J. 77:2284–2294. [DOI] [PMC free article] [PubMed] [Google Scholar]
- 25.Pope, L. H., M. C. Davies, C. A. Laughton, C. J. Roberts, S. J. B. Tendler, and P. M. Williams. 1999. Intercalation-induced changes in DNA supercoiling observed in real-time by atomic force microscopy. Anal. Chim. Acta. 400:27–32. [Google Scholar]
- 26.Hansma, H. G. 2001. Surface biology of DNA by atomic force microscopy. Annu. Rev. Phys. Chem. 52:71–92. [DOI] [PubMed] [Google Scholar]
- 27.Bussiek, M., K. Toth, N. Brun, and J. Langowski. 2005. DNA-loop formation on nucleosomes shown by in situ scanning force microscopy of supercoiled DNA. J. Mol. Biol. 345:695–706. [DOI] [PubMed] [Google Scholar]
- 28.Yang, Y., H. Wang, and D. A. Erie. 2003. Quantitative characterization of biomolecular assemblies and interactions using atomic force microscopy. Methods. 29:175–187. [DOI] [PubMed] [Google Scholar]
- 29.Rivetti, C., S. Codeluppi, G. Dieci, and C. Bustamante. 2003. Visualizing RNA extrusion and DNA wrapping in transcription elongation complexes of bacterial and eukaryotic RNA polymerases. J. Mol. Biol. 326:1413–1426. [DOI] [PubMed] [Google Scholar]
- 30.Bussiek, M., N. Mucke, and J. Langowski. 2003. Polylysine-coated mica can be used to observe systematic changes in the supercoiled DNA conformation by scanning force microscopy in solution. Nucleic Acids Res. 31:e137. [DOI] [PMC free article] [PubMed] [Google Scholar]
- 31.Shlyakhtenko, L. S., A. A. Gall, A. Filonov, Z. Cerovac, A. Lushnikov, and Y. L. Lyubchenko. 2003. Silatrane-based surface chemistry for immobilization of DNA, protein-DNA complexes and other biological materials. Ultramicroscopy. 97:279–287. [DOI] [PubMed] [Google Scholar]
- 32.Shlyakhtenko, L. S., L. Miloseska, V. N. Potaman, R. R. Sinden, and Y. L. Lyubchenko. 2003. Intersegmental interactions in supercoiled DNA: atomic force microscope study. Ultramicroscopy. 97:263–270. [DOI] [PubMed] [Google Scholar]
- 33.Hansma, H. G., K. Kasuya, and E. Oroudjev. 2004. Atomic force microscopy imaging and pulling of nucleic acids. Curr. Opin. Struct. Biol. 14:380–385. [DOI] [PubMed] [Google Scholar]
- 34.van Noort, S. J. T., K. O. van der Werf, A. P. M. Eker, C. Wyman, B. G. de Grooth, N. F. van Hulst, and J. Greve. 1998. Direct visualization of dynamic protein-DNA interactions with a dedicated atomic force microscope. Biophys. J. 74:2840–2849. [DOI] [PMC free article] [PubMed] [Google Scholar]
- 35.Karymov, M., D. Daniel, O. F. Sankey, and Y. L. Lyubchenko. 2005. Holliday junction dynamics and branch migration: single-molecule analysis. Proc. Natl. Acad. Sci. USA. 102:8186–8191. [DOI] [PMC free article] [PubMed] [Google Scholar]
- 36.Lyubchenko, Y. L. 2004. DNA structure and dynamics—an atomic force microscopy study. Cell Biochem. Biophys. 41:75–98. [DOI] [PubMed] [Google Scholar]
- 37.Kunkel, T. A., and D. A. Erie. 2005. DNA mismatch repair. Annu. Rev. Biochem. 74:681–710. [DOI] [PubMed] [Google Scholar]
- 38.Han, W. H., M. Dlakic, Y. W. J. Zhu, S. M. Lindsay, and R. E. Harrington. 1997. Strained DNA is kinked by low concentrations of Zn2+. Proc. Natl. Acad. Sci. USA. 94:10565–10570. [DOI] [PMC free article] [PubMed] [Google Scholar]
- 39.Han, W. H., S. M. Lindsay, M. Dlakic, and R. E. Harington. 1997. Kinked DNA. Nature. 386:563. [DOI] [PubMed] [Google Scholar]
- 40.Lindsay, S. M., T. Thundat, L. Nagahara, U. Knipping, and R. L. Rill. 1989. Images of the DNA double helix in water. Science. 244:1063–1064. [DOI] [PubMed] [Google Scholar]
- 41.Shao, Z. F., J. Mou, D. M. Czajkowsky, J. Yang, and J. Y. Yuan. 1996. Biological atomic force microscopy: what is achieved and what is needed. Adv. Phys. 45:1–86. [Google Scholar]
- 42.Shao, Z. F., and J. Yang. 1995. Progress in high-resolution atomic-force microscopy in biology. Q. Rev. Biophys. 28:195–251. [DOI] [PubMed] [Google Scholar]
- 43.Colton, R. J., D. R. Baselt, Y. F. Dufrene, J. B. D. Green, and G. U. Lee. 1997. Scanning probe microscopy. Curr. Opin. Chem. Biol. 1:370–377. [DOI] [PubMed] [Google Scholar]
- 44.Pastushenko, V. P., R. Kaderabek, M. Sip, C. Borken, F. Kienberger, and P. Hinterdorfer. 2002. Reconstruction of DNA shape from AFM data. Single Molecules. 3:111–117. [Google Scholar]
- 45.Wang, H., Y. Yang, M. J. Schofield, C. W. Du, Y. Fridman, S. D. Lee, E. D. Larson, J. T. Drummond, E. Alani, P. Hsieh, and D. A. Erie. 2003. DNA bending and unbending by MutS govern mismatch recognition and specificity. Proc. Natl. Acad. Sci. USA. 100:14822–14827. [DOI] [PMC free article] [PubMed] [Google Scholar]
- 46.Chen, L. W., K. A. Haushalter, C. M. Lieber, and G. L. Verdine. 2002. Direct visualization of a DNA glycosylase searching for damage. Chem. Biol. 9:345–350. [DOI] [PubMed] [Google Scholar]
- 47.Murakami, M., H. Hirokawa, and I. Hayata. 2000. Analysis of radiation damage of DNA by atomic force microscopy in comparison with agarose gel electrophoresis studies. J. Biochem. Biophys. Methods. 44:31–40. [DOI] [PubMed] [Google Scholar]
- 48.Pang, D., B. L. Berman, S. Chasovskikh, J. E. Rodgers, and A. Dritschilo. 1998. Investigation of neutron-induced damage in DNA by atomic force microscopy: experimental evidence of clustered DNA lesions. Radiat. Res. 150:612–618. [PubMed] [Google Scholar]
- 49.Pang, D., J. E. Rodgers, B. L. Berman, S. Chasovskikh, and A. Dritschilo. 2005. Spatial distribution of radiation-induced double-strand breaks in plasmid DNA as resolved by atomic force microscopy. Radiat. Res. 164:755–765. [DOI] [PubMed] [Google Scholar]
- 50.Boichot, S., M. Fromm, S. Cunniffe, P. O'Neill, J. C. Labrune, A. Chambaudet, E. Delain, and E. Le Cam. 2002. Investigation of radiation damage in DNA by using atomic force microscopy. Radiat. Prot. Dosim. 99:143–145. [DOI] [PubMed] [Google Scholar]
- 51.Psonka, K., S. Brons, M. Heiss, E. Gudowska-Nowak, and G. Taucher-Scholz. 2005. Induction of DNA damage by heavy ions measured by atomic force microscopy. J. Phys.-Condes. Matter. 17:S1443–S1446. [Google Scholar]
- 52.Lysetska, M., A. Knoll, D. Boehringer, T. Hey, G. Krauss, and G. Krausch. 2002. UV light-damaged DNA and its interaction with human replication protein A: an atomic force microscopy study. Nucleic Acids Res. 30:2686–2691. [DOI] [PMC free article] [PubMed] [Google Scholar]
- 53.Moreno-Herrero, F., M. de Jager, N. H. Dekker, R. Kanaar, C. Wyman, and C. Dekker. 2005. Mesoscale conformational changes in the DNA-repair complex Rad50/Mre11/Nbs1 upon binding DNA. Nature. 437:440–443. [DOI] [PubMed] [Google Scholar]
- 54.Sutherland, B. M., P. V. Bennett, K. Conlon, G. A. Epling, and J. C. Sutherland. 1992. Quantitation of supercoiled DNA cleavage in nonradioactive DNA—application to ionizing-radiation and synthetic endonuclease cleavage. Anal. Biochem. 201:80–86. [DOI] [PubMed] [Google Scholar]
- 55.Vologodskii, A. V., and N. R. Cozzarelli. 1994. Conformational and thermodynamic properties of supercoiled DNA. Annu. Rev. Biophys. Biomolec. Struct. 23:609–643. [DOI] [PubMed] [Google Scholar]
- 56.Cherny, D. I., and T. M. Jovin. 2001. Electron and scanning force microscopy studies of alterations in supercoiled DNA tertiary structure. J. Mol. Biol. 313:295–307. [DOI] [PubMed] [Google Scholar]
- 57.Chen, W. M., E. R. Blazek, and I. Rosenberg. 1995. The relaxation of supercoiled DNA molecules as a biophysical dosimeter for ionizing radiations: a feasibility study. Med. Phys. 22:1369–1375. [DOI] [PubMed] [Google Scholar]
- 58.Sperrazza, J. M., I. I. I. J. C. Register, and J. Griffith. 1984. Electron microscopy can be used to measure DNA supertwisting. Gene. 31:17–22. [DOI] [PubMed] [Google Scholar]
- 59.Lushnikov, A. Y., B. A. Brown, E. A. Oussatcheva, V. N. Potaman, R. R. Sinden, and Y. L. Lyubchenko. 2004. Interaction of the Z alpha domain of human ADAR1 with a negatively supercoiled plasmid visualized by atomic force microscopy. Nucleic Acids Res. 32:4704–4712. [DOI] [PMC free article] [PubMed] [Google Scholar]
- 60.Anderson, D., T. W. Yu, B. J. Phillips, and P. Schmezer. 1994. The effect of various antioxidants and other modifying agents on oxygen-radical-generated DNA-damage in human-lymphocytes in the comet assay. Mutat. Res. 307:261–271. [DOI] [PubMed] [Google Scholar]
- 61.Pelle, E., X. Huang, T. Mammone, K. Marenus, D. Maes, and K. Frenkel. 2003. Ultraviolet-B-induced oxidative DNA base damage in primary normal human epidermal keratinocytes and inhibition by a hydroxyl radical scavenger. J. Invest. Dermatol. 121:177–183. [DOI] [PubMed] [Google Scholar]
- 62.Gruskin, E. A., and R. S. Lloyd. 1986. The DNA scanning mechanism of T4 endonuclease-V—effect of NaCl concentration on processive nicking activity. J. Biol. Chem. 261:9607–9613. [PubMed] [Google Scholar]
- 63.Sachs, R. K., A. L. Ponomarev, P. Hahnfeldt, and L. R. Hlatky. 1999. Locations of radiation-produced DNA double strand breaks along chromosomes: a stochastic cluster process formalism. Math. Biosci. 159:165–187. [DOI] [PubMed] [Google Scholar]
- 64.Lobachevsky, P. N., T. C. Karagiannis, and R. F. Martin. 2004. Plasmid DNA breakage by decay of DNA-associated auger electron emitters: approaches to analysis of experimental data. Radiat. Res. 162:84–95. [DOI] [PubMed] [Google Scholar]
- 65.Sancar, A. 2003. Structure and function of DNA photolyase and cryptochrome blue-light photoreceptors. Chem. Rev. 103:2203–2237. [DOI] [PubMed] [Google Scholar]
- 66.van Noort, J., F. Orsini, A. Eker, C. Wyman, B. de Grooth, and J. Greve. 1999. DNA bending by photolyase in specific and non-specific complexes studied by atomic force microscopy. Nucleic Acids Res. 27:3875–3880. [DOI] [PMC free article] [PubMed] [Google Scholar]
- 67.Clare Chemical Research. SYBR Gold. http://www.clarechemical.com/gold.htm.


