

Abstract
A novel multipoint method, based on an approximate coalescence approach, to analyze multiple linked markers is presented. Unlike other approximate coalescence methods, it considers all markers simultaneously but only two haplotypes at a time. We demonstrate the use of this method for linkage disequilibrium (LD) mapping of QTL and estimation of effective population size. The method estimates identity-by-descent (IBD) probabilities between pairs of marker haplotypes. Both LD and combined linkage and LD mapping rely on such IBD probabilities. The method is approximate in that it considers only the information on a pair of haplotypes, whereas a full modeling of the coalescence process would simultaneously consider all haplotypes. However, full coalescence modeling is computationally feasible only for few linked markers. Using simulations of the coalescence process, the method is shown to give almost unbiased estimates of the effective population size. Compared to direct marker and haplotype association analyses, IBD-based QTL mapping showed clearly a higher power to detect a QTL and a more realistic confidence interval for its position. The modeling of LD could be extended to estimate other LD-related parameters such as recombination rates.
EXTENSIVE genotyping of individuals for tens to hundreds of thousands of SNP markers is becoming common as automated high-throughput techniques are established (Wang et al. 2005). These detailed genotype data provide important information about linkage disequilibrium (LD) between the genes or markers. LD, in turn, can be used to test hypotheses about the evolutionary history of the population (Hayes et al. 2003), to map QTL (Carlson et al. 2004), and to estimate the recombination rate at each position along a chromosome (Li and Stephens 2003). Thus, extracting maximum information from the pattern of LD observed is very important.
LD, as pointed out by Chapman and Thompson (2003), occurs because multiple gametes inherit a chromosome segment from a common ancestor that is identical by descent (IBD), i.e., inherited without any recombination. Hayes et al. (2003) used this understanding of LD to define a measure of LD called chromosome segment homozygosity (CSH) as the probability that random chromosome segments sampled from a population are IBD.
According to coalescence theory, the mutations at all loci (markers and QTL) are independent given the coalescence tree(s), i.e., given the IBD structure of the haplotypes (Hudson 1993). Hence, markers provide information about QTL alleles only through their information on the underlying coalescence tree or IBD structure. Therefore the logical approach to using LD is to use the markers to infer the coalescent tree or properties of it and then to use the coalescent tree to infer properties of the population (e.g., effective size) or to map QTL or to discover recombination hotspots. In line with this approach, all QTL mapping methods can be described conceptually as following three steps:
Calculate the probability Gij that two individuals carry chromosomes that are identical by descent at the putative QTL position.
Compare the similarity in phenotype to Gij.
The position of the QTL that maximizes the likelihood of the phenotypes given Gij is the estimated position.
Linkage mapping of QTL also follows this approach, except that Gij is here solely due to within-family IBD.
Unfortunately, a full coalescent analysis of many linked markers is not computationally feasible. Early multipoint IBD estimation methods assumed that the markers provided independent information about the IBD status (e.g., Terwilliger 1995). In the case of dense SNP markers this assumption is clearly invalid. More recent multipoint methods approximate the coalescence; for instance, composite-likelihood methods consider markers only two at a time (Hudson 2001). An alternative approach (Meuwissen and Goddard 2001) is to model the coalescence of all markers but only a pair of chromosomes at a time, which fits with the definition of CSH and is computationally much more tractable (can deal with thousands of markers). This approach has been very useful for mapping QTL (e.g., Olsen et al. 2005) but it assumed that genes in the current population derived, without any mutation, from a base population that contained a single copy of the QTL mutant a known number of generations ago. This is satisfactory provided the mutation rate is negligible relative to the recombination rate, but as the density of markers increases, this assumption is less justified. Furthermore, Meuwissen and Goddard (2001) assumed that the effective population size and time since the most recent QTL mutation were known. Here, we extend their approach to overcome these limitations.
We present a method that predicts IBD probabilities at putative QTL positions using information from many dense markers. As part of the predictions, the effective population size is estimated directly from the linked marker data. Predictions are compared to true IBD states and to direct association analyses using single markers and marker haplotypes. The approach is general and can be extended to effective population sizes that varied in the past and to estimate recombination rates that vary at different points in the genome.
THE MODEL
For each pair of gametes, i and j, define a vector (yij) summarizing the observed haplotypes where yijk = 1 if the alleles are alike-in-state at position k and 0 if they are not, where k = 1,…, l and l denotes the number of marker loci. To simplify the notation, for the moment, we suppress the ij subscript in what follows. That is, all data and parameters are defined for the pair of gametes i and j. The parameters for pair i and j are connected with the parameters for other pairs in a hierarchical model. Underlying this observed y is a pattern of IBD relationships described by the vector π. If the bth marker bracket is IBD, i.e., inherited as an IBD chromosome segment from a common ancestor without any recombination, the bth element of π is 1, and otherwise it is 0, where a marker bracket denotes the chromosome segment between two adjacent markers (including the marker positions themselves). For example, the vector π = [1 1 1 0]′ denotes that the first three brackets are inherited IBD from a common ancestor and the fourth bracket is not entirely inherited from one common ancestor. The probability of observing y is thus
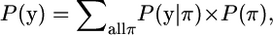 |
(1) |
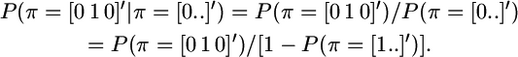
where the summation is over all possible π-vectors, P(y | π) states the conditional probability of observing y given the pattern of IBD and non-IBD segments denoted by π, and P(π) is the prior probability of observing this pattern of IBD and non-IBD segments. P(π) can be factored because, once a recombination occurs, chromosomes segments on either side of the recombination are assumed to evolve independently in coalescence theory. The latter assumes an unstructured population, i.e., no subpopulations or lineages. Therefore, we group elements in π into IBD segments (continuous sequences of 1's) and others. For example, π = [0 1 1 0 1 0]′ consists of two IBD segments, brackets 2 and 3 and bracket 5. Therefore,
 |
where a dot [.] denotes that the IBD status for this bracket is not specified; i.e., it is not accounted for in the probability calculation and could be either 0 or 1. This allows the probability of a long sequence of data on a chromosome to be factored into manageable pieces. The prior probability of an IBD chromosome segment that extends over n marker brackets is approximately
 |
(2) |
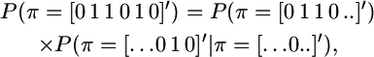
(Hayes et al. 2003), where 1n is a vector of n ones, c is the size of the IBD segment in morgans, and N is the effective population size. The approximation in (2) assumes that the size of the segment, c, is small relative to 1. Terms like the above P(π = [0 1 1 0]′), where the IBD segment is bounded by non-IBD segments, can be rewritten involving only unbounded IBD segments as in Equation 2,
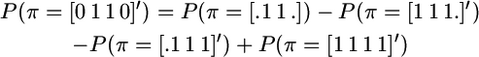 |
(Meuwissen and Goddard 2001), which follows from rearranging the equations
 |
and
 |
Also, the conditional probability P(π = [0 1 0]′ | π = [0 . .]′) can be rewritten in terms of unbounded probabilities of IBD segments as in Equation 2, using
 |
Thus, all these terms can be calculated by using (2) repeatedly. A factorization to computationally speed up the summation in Equation 1 is described by Meuwissen and Goddard (2001).
Conditional marker homozygosity:
Let P(yk | π) denote the probability that marker locus k is observed alike-in-state at a pair of gametes i and j, or not, given the pattern of IBD and non-IBD segments, π. For instance, if π denotes that marker locus k is on an IBD segment of size c, then locus k is alike-in-state if there was no mutation before the gametes coalesce into their common ancestor (looking back in time). If the next locus, k + 1, is on another IBD segment, its evolution is assumed independent in coalescence theory, as mentioned before. If locus k and k + 1 are on the same IBD segment, locus k + 1 is alike-in-state if no mutation occurred at locus k + 1. The probabilities of a mutation at locus k and locus k + 1 are independent given the coalescence tree, i.e., given the time when the common ancestor occurs. When the common ancestor occurs is unknown, but the vector π contains information on the size of the segment, c, which yields a prediction of the time since the common ancestor; i.e., the gametes are expected to have coalesced 1/(2c) generations ago (Hayes et al. 2003). We assume that conditional on the size of the IBD segment, the probabilities of a mutation at any two (or more) loci on this IBD segment are independent; i.e., we assume that any remaining autocorrelation between the mutation probabilities at adjacent marker loci will have a negligible effect on our predictions. Thus, conditional on the pattern of IBD and non-IBD segments, π, the (non-)alike-in-state probabilities of the marker alleles are independent; i.e.,
 |
The conditional alike-in-state probabilities P(yk | π) are given in Table 1 and derived in the appendix. The probability of a mutation is smaller for larger segments, since larger segments coalesce earlier, giving less time for a mutation. If the marker is on a segment that recombined, the common ancestor was probably more distant in the past, because the segment had time to recombine, and the probability of a mutation is increased. The values of P(yk | π) depend on the mutation rate, u, or more precisely on 4Nu. Fortunately the method is not very sensitive to the value of u used because the probability that two alleles are not alike is proportional to 4Nu in many situations (see Table 1), and therefore we use an artificially high value of u, i.e., 10−5. An alternative is to estimate 4Nu by the marker heterozygosity of the kth marker, Hk. Use of Hk may also account for differences in information content between the markers (e.g., SNPs vs. microsatellites). However, since markers are used only if they are polymorphic, marker heterozygosity does not correctly predict 4Nu. We call the methods using mutation rate IBDMUT and the method using marker heterozygosity IBDHET.
TABLE 1.
Probability of (un)equal marker alleles given the IBD pattern
| Probabilitya | Valueb | appendix equation |
|---|---|---|
| P(yk = 0 | π = 1n)c |  |
A1 |
| P(yk = 0 | π = [0 | 0]′)d | 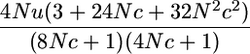 |
A3 |
| P(y1 = 0 | π = [ | 0]′)e | 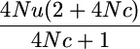 |
A2 |
| P(yk = 1 | π) | 1 − P(yk = 0 | π) |
Where possible, the position of the marker k is denoted by “|” within the vector of IBD and non-IBD segments π.
N, effective population size; u, mutation rate. Note that 4Nu may be approximated by marker heterozygosity, Hk, if u is unknown.
k is on an IBD segment of size c (note that k may be right at the edge of this segment).
k is in between two non-IBD segments, each of size c.
The marker is at the start of the chromosome and next to a non-IBD region of size c. Due to symmetry, the same Equation applies at the end of the chromosome.
Estimation of IBD at a putative QTL position:
The above model is adapted to estimate IBD between the chromosomes at any position, which is called “the putative QTL position,” q, here. First, let yq* = 1 denote that the QTL position is IBD, and the “*” denotes that this is an auxiliary record, which is not actually observed but should be accounted for when evaluating the probability of the pair of gametes. Second, using Equation 1 we calculate P(yq* = 1, y), i.e., the probability that the QTL is on an IBD segment, and the marker records y occur. At the QTL position, q, we do not use Table 1 to obtain P(yq* | π) values, but we set P(yq* = 1 | π) = 1, if π indicates that the QTL is on an IBD segment, and P(yq* = 1 | π) = 0 if q is surrounded by two non-IBD segments. Note that if π indicates that there is an IBD segment to the left of the QTL and a non-IBD segment to the right, the QTL is still on an IBD segment since the marker brackets are defined to include the loci that border them (thus the IBD segment to the right was partly but not entirely IBD, which is denoted by a 0 in π). Third, we calculate the probability that the putative QTL position is IBD given the marker data at the chromosome as
 |
(3) |
where P(y) is calculated using Equation 1 without considering the QTL locus (as in the previous sections).
Estimation of effective population size:
It is well known from coalescence theory (Hudson 2001) that it is possible to estimate the product N × c, but not N separately. We assume here that c is known, which enables us to estimate N. If c is unknown, but the relative distances between the markers are known (from their physical map positions), we may scale the marker distances such that they sum to one, and the method described below will estimate Nc instead of N, where c is the size of the chromosome.
We use the EM algorithm (Dempster et al. 1977) to estimate N, where the IBD status between each pair of markers k and l (k < l) is considered as missing data. Assuming a starting value for N, the steps are as follows:
- Estimate the probability that the entire segment between markers k and l is IBD, which is denoted by a vector yk,l* being the unity vector; i.e., yk,l* = 1n, where n = l − k. We calculate for each gamete pair and for each pair of markers k, l the probability that the entire segment between markers k and l is IBD, yk,l* = 1n, given the marker data and the current estimate of N, similar to Equation 3,
where P(y) is obtained from Equation 1, and P(yk,l* = 1n, y) is also obtained from (1), using P(yk,l* = 1n | π) = 1 if the segment between marker k and l as denoted by π is entirely IBD, and P(yk,l* = 1n | π) = 0 otherwise. The probabilities P(yk,l* = 1n | y) are averaged over all chromosome pairs to get populationwide estimates for them, which are denoted by CSHk,l.
- Nonlinear regression is used to obtain an updated estimate of N, using the statistical model
where ck,l is the distance between the markers k and l (in morgans), and ek,l is a random sampling error, whose variance is assumed constant. If the updated estimate of N deviates less than a factor 0.001 from the old value, the algorithm stops; otherwise go to step 1 and keep on iterating. The estimation of N was adopted only in combination with the IBDHET method, and the combined method is called IBDHETne.
(4)
Computer simulations to test the model:
The ms program (Hudson 2002) was used to generate SNP marker data, which uses the standard coalescence approach (Hudson 1993) in which the random genealogy of a sample is first generated assuming a neutral model of inheritance, and then mutations are randomly placed on the genealogy. An infinite-sites model of mutation is assumed, and a finite-sites model of recombination, although this number of sites was very large here (2,000,000 bp). The size of the simulated segment was 2 cM, N = 1000, the per base pair mutation rate was 10−8, and 200 haplotypes were simulated. Only markers with a minor allele frequency (MAF) > 0.1 were retained, and the 20 most equidistant markers were used to span the 2-cM region. Since the ms simulations resulted in an abundance of markers, the 20 markers were close to equidistant. Another marker with MAF > 0.1 and that was as close as possible to the midpoint of the segment was appointed to act as the QTL. The QTL was thus approximately in the middle between markers 10 and 11. A phenotypic record was simulated for each haplotype using the equation pi = Qi + ei, where Qi is the allele at the QTL position (0 or 1) and ei is an environmental effect sampled from N(0, 0.5). Compared to real-life situations, the QTL effect of 1 was perhaps large relative to the environmental variance, but most real-life QTL mapping experiments in outbreeding populations collect >200 phenotypes. We kept the number of phenotypes relatively small to be able to analyze 100 replicated data sets in a reasonable time.
The 100 data sets were analyzed using the QTL mapping by variance-components approach (George et al. 2000) and using the statistical model
 |
where μ is the overall mean, q is a (200 × 1) vector of QTL effects [assumed random with q ∼ MVN(0,  ); MVN, multivariate normal distribution], and e is a (200 × 1) vector of environmental effects [e ∼ MVN(0,
  ); I = identity matrix]. The (200 × 200) matrix G contains the IBD probabilities estimated at the putative QTL position using the above methods, and the variance components
  and
and  were estimated by residual maximum likelihood (REML) using the computer package ASREML (Gilmour et al. 2000). ASREML also computes the REML likelihood of the data given the G matrix, and a likelihood-ratio test statistic (LRT) was calculated as twice the difference in log-likelihood between the model including the QTL effect, q, and the model excluding the QTL effect. This LRT was calculated for every midpoint of 19 marker brackets, i.e., assuming a putative QTL at each of the midpoints, and the analysis that gave the highest LRT was denoted the most likely QTL position.
In addition, some direct association analyses were conducted where the phenotypes were directly regressed on the marker effects (MARK1); i.e., for marker k the model is p = μ × 1200 + mk + e, where mk is a (2 × 1) vector of random marker effects [mk ∼ MVN(0,  )]. A second direct association analysis fits the effects of two-marker haplotypes on the phenotypes (MARK2); i.e., for the kth marker bracket p = μ × 1200 + hk + e and hk is the effect of the haplotype constituted by markers k and k + 1 [hk ∼ MVN(0,
  )]. In these analyses mk and hk were included as random effects to compare their LRTs to that of the variance-component QTL analysis. Including mk and hk as random effects also has a Bayesian interpretation in that they are assumed to have a MVN prior distribution. It is well known from Bayesian statistics that the influence of the prior is small if there is a lot of information in the data, which is the case here since there are relatively many records to estimate the two effects of mk and the four effects of hk. Thus, an analysis that treats mk and hk as random effects, a Bayesian analysis with MVN priors, and a conventional analysis that treats mk and hk as fixed effects (no use of prior information) are all expected to give very similar results.
RESULTS
Figure 1 shows the average LRT profiles for all methods, except IBDHETne (because the LRT profile of IBDHETne was almost indistinguishable from that of IBDHET). All the LRT curves are nicely centered around the true QTL position at the middle of the chromosome segment; i.e., there was no bias in the position estimates. IBDMUT and IBDHET had the highest LRT at the QTL position and thus had approximately equal power to detect the QTL. However, the LRT drops more quickly for the IBDMUT analysis than for the IBDHET analysis when moving away from the true QTL position, which suggests that IBDMUT has a higher precision to map the QTL. A reason for this may be that IBDHET estimates the mutation rate from the marker data, which reduces their information content and makes them less informative for positioning the QTL. This result also suggests that accounting for differences in heterozygosity (information content) between markers does not improve mapping precision, if the true underlying mutation rate was the same for all the markers. The MARK1 and MARK2 methods are also unbiased but have substantially less power to detect the QTL.
Figure 1.—

Average LRT profiles. ♦, IBDHET; □, IBDMUT; ▴, MARK1; X, MARK2.
Although the distributions of the LRT values under the null hypothesis of no QTL effect are expected to be approximately the same, i.e., a chi-square distribution with the same degrees of freedom, we tested this assumption by analyzing 100 replicated data sets where no QTL effect was simulated. The fifth-highest LRT value from these analyses yielded an estimate of the chromosome segmentwise critical significance threshold at P = 0.05, and these values were 3.48, 3.03, 3.34, and 3.34 for MARK1, MARK2, IBDMUT, and IBDHET, respectively. Hence, the critical significance thresholds of the four methods are similar, and the differences in LRT values in Figure 1 do translate into differences in power of detecting the QTL.
Table 2 shows the power of detecting the QTL and mapping precision of the methods expressed as the mean of the squared difference between the estimated and the true position. As expected from Figure 1, IBDMUT has the best precision, while IBDHET, IBDHETne, and MARK2 have similar precision. Power was calculated as the fraction of the replicates where LRT > 11, which corresponds to a nominal P-value of 0.001 assuming that LRT is approximately chi-square distributed with 1 d.f. The IBD-based methods all had substantially more power than direct regression on marker (haplotypes).
TABLE 2.
The mean square error of the position estimate (MSE), the fraction of replicates with a QTL significant effect (power), the fraction of the significant QTL, where the true QTL position is within the 2-LOD-dropoff support interval [P(QTL in interval)], and correlation between estimated IBD probabilities and the IBD probability given the tree (Corr)
| Analysis | MSE (cM2) | Powera | P(QTL in interval) | Size of interval (cM) | Corr |
|---|---|---|---|---|---|
| IBDHET | 0.072 | 0.94 | 0.97 | 0.82 | 0.576 |
| IBDMUT | 0.049 | 0.95 | 0.97 | 0.58 | 0.537 |
| IBDHETne | 0.071 | 0.94 | 0.97 | 0.78 | 0.576 |
| MARK1 | 0.088 | 0.83 | 0.11 | 0.11 | 0.357 |
| MARK2 | 0.074 | 0.88 | 0.26 | 0.14 | 0.478 |
The IBD probability given the tree is used as the “gold standard” (see main text).
A nominal P-value of 0.001 was used.
For the analyses where a significant QTL was detected (LRT > 11), a 2-LOD-dropoff support interval was constructed for the position of the QTL, i.e., the interval surrounding the QTL peak where the likelihood exceeds LogLikmax − 2 × ln(10), where LogLikmax is the natural logarithm of the maximum likelihood. If the log likelihood was quadratic in the QTL position, this support interval is expected to contain the QTL in ∼99.8% of the cases. Visscher and Goddard (2004) show that the log likelihood is not quadratic, and hence we expect somewhat <99.8% of the estimates to lie within this interval. The number of replicates in which the true QTL position was within the 2-LOD-dropoff support interval was counted (Table 2). The number of cases where the QTL was contained in the support interval of the IBD-based analyses was ∼3% less than expected. The average size of the support interval shows again that IBDMUT is more precise than IBDHET and IBDHETne. For the methods based on direct regression on the marker or haplotype, the 2-LOD-droffoff interval does not seem to provide reliable support intervals. The intervals seem much too short, such that the fraction of cases where the true QTL is within the interval is very low. These too short intervals are probably due to the spiky LRT profiles that are obtained by these analyses. Figure 2 shows an example replicate where all analyses erroneously place the QTL at ∼0.6 cM, but the correct position of 1.0 cM is well within the LOD-2-support interval of the IBD-based methods, whereas the spikiness of MARK1 and MARK2 makes their LRT signal drop quickly and rise again in an irregular manner. In case of MARK2, one might even conclude that there are two QTL in this region.
Figure 2.—

Example of LRT profiles in a single replicate. ♦, IBDHET; □, IBDMUT; ▴, MARK1; X, MARK2.
Another criterion by which to judge the different methods of analysis is the correlation between the IBD probability calculated from the markers and the “true” probability that the QTL alleles are IBD. The true probability depends on the length of the coalescence tree joining the QTL alleles in the two gametes (τ) and this is provided by the ms simulation program of Hudson (2002). This allowed us to calculate the probability of QTL alleles being IBD, i.e., no mutation since coalescence, given the coalescence tree as P(IBD | tree) = exp(−2θ × τ), where θ = 4NuQTL, with uQTL being the mutation rate at the QTL position, and τ is time till the two haplotypes coalesce. Choice of θ is somewhat arbitrary since it does not change the ordering of the probabilities and so has only a small effect on the correlation with the predicted IBD probability. We assumed θ = 2, since this seemed to give a spread in IBD probabilities. These P(IBD | tree) were considered as the “gold standard,” since they are based on the true simulated length of the tree that, of course, is not known in a real life situation, but is estimated using the information of linked markers. The IBD probabilities given the tree were correlated with the estimated IBD probabilities (Table 2), and the correlations mirror the differences in power between the methods. That is, the IBD methods have higher correlations and higher power to detect the QTL than the methods that use regression on the marker. The precision with which the methods position the QTL is probably more affected by how quickly the IBD probabilities change when moving from one position to the next than by the correlation between P(IBD | tree) and estimated IBD probabilities.
The estimate of N obtained by IBDHETne was on average 1048 with a standard deviation of 289. A histogram of the estimates is shown in Figure 3. It shows that, although the distribution of the estimates of N is centered around 1000, occasional estimates can be quite far away from N = 1000. However, in most applications N is multiplied by another entity, e.g., mutation or recombination rate, which implies that the relative error of the estimate of N is more important than its absolute error. Also, when judging the effective size of a population, the relative error is more important than the absolute error (e.g., 100 vs. 200 is an important difference whereas 1000 vs. 1100 is not). The relative error is obtained by transforming N to the log scale (log-10 base was used here), which gave an average of the estimates of log10(N) of 3.00 with a standard deviation of 0.123. Using the normal distribution as an approximation, this implies that ∼60–70% of the estimates have a relative error <33% (= (100.123 − 1) × 100%).
Figure 3.—

Histogram of estimates of the effective population size.
DISCUSSION
This article describes a novel method that predicts IBD probabilities between pairs of haplotypes at predefined positions on the basis of the similarity of the marker alleles carried by the haplotypes. It is a coalescence-based method but differs from other coalescence methods in that it is computationally feasible for many linked loci, but considers only a pair of gametes at a time. The method assumes that the haplotypes are known, i.e., that the genotypes have been phased. In situations with high marker density and/or large family sizes estimation of phase is quite accurate. If the phase of a marker is uncertain in haplotype i, this marker may be denoted as missing, which implies that it is skipped in all yij vectors involving haplotype i. The method extends our previous method (Meuwissen and Goddard 2001) by allowing for mutation at the markers and by requiring no assumptions about the effective population size or the number of generations since a “base” population. The method can be used for many purposes that require an analysis of LD because it models the process that causes LD, i.e., the inheritance of chromosome segments without recombination from a common ancestor. For instance, the method can be used to map QTL and to estimate effective population sizes and could be extended to estimate recombination rate.
A commonly used strategy for QTL mapping is to perform a whole-genome linkage or association analysis, followed by fine mapping using association methods. However, both linkage and association mapping alone have limited power to detect QTL. Linkage mapping does not use the increased power due to association, and genomewide association mapping suffers from multiple-testing problems and false positive results (Carlson et al. 2004). The genomewide combined use of linkage and association mapping is expected to relieve these problems, because it combines both sources of information. The method presented is easy to extend to combined linkage and linkage disequilibrium (LLD) mapping by: (i) applying the described method to estimate IBD probabilities between the founder haplotypes of the genotyped pedigree and (ii) using linkage analysis information to estimate within-family-based IBD probabilities between founder and offspring haplotypes and among offspring haplotypes (e.g., Meuwissen et al. 2002; Perez-Enciso 2003). Prediction of IBD based on both LD and linkage information, as described by (i) and (ii), is a convenient way to combine both information sources for the mapping of QTL and is expected to detect more QTL and map them more precisely than LD or linkage analysis alone would do.
Although the described methodology does not directly estimate coalescence trees and times, it is based on deterministic approximations of the coalescence process. Since the method does not build a coalescence tree for all the haplotypes, it neglects information from other haplotypes when estimating IBD probabilities for the haplotype pair i,j. This shortcoming is expected to become less important as marker density increases, since, at high density, the markers will be sufficiently informative to directly indicate IBD regions when comparing pairs of haplotypes. Furthermore, multihaplotype identities are also ignored by QTL mapping by variance-components methods, since it uses only the IBD matrix of the haplotype pairs, G, to position the QTL (George et al. 2000). An alternative approach to ours is to leave the coalescent-with-recombination model and calculate an ensemble of “likely” ancestral recombination graphs using Minichiello and Durbin's (2006) approach, which can handle hundreds of markers simultaneously. Further research is needed to compare this approach to ours, with respect to power, mapping precision, and computational requirements, but since the method of Minichiello and Durbin does not require an estimate of the effective population size, it will not be able to estimate this parameter from the data.
Compared to direct association methods, i.e., that directly regress the phenotypes onto the marker (haplotype), the presented methods seem to have a higher signal-to-noise ratio in that there is a higher power of detecting the QTL, and the LRT profiles are more smooth (Figure 2). Since the regression methods use the same marker information, their peak LRT is often at a similar position. Because two-locus LD is very variable (Hill and Weir 1994), the LRT profile of MARK1 is much more erratic than that of multipoint IBD methods presented here, which use the LD with all markers simultaneously. This is, however, at the cost of a much more complicated QTL mapping methodology.
The method presented can also be used to estimate effective population size, N, or in case recombination rates, c, are unknown ρ = 4Nc. We obtained an estimate of N that was almost unbiased, and all 100 estimates of N are within a factor of 2 from the true value. Perhaps the best competitor to our estimator of ρ is that of Li and Stephens (2003), which was within a factor of 2 of the truth in 68% of the replicates and was biased. As Li and Stephens (2003) remark, a factor 2 of the truth may not sound very impressive in many statistical applications, but in this setting this accuracy is hard to achieve (Wall 2000). Hence, the current method is competitive to all other methods that estimate N or ρ from linked marker data, which makes it attractive to extend the methodology to estimate variations in recombination rates and recombination hotspots. In a follow-up article we will extend the nonlinear model (3) to a model that estimates the recombination rate per marker pair as a function of the distance between the markers in kilobases.
In summary, we believe this method is a useful alternative to other coalescence-based methods for analyzing data on many dense polymorphic loci, because (i) it can handle large numbers of closely linked markers; (ii) at high marker density, its estimates of IBD probabilities are expected to be similar to those of methods that account for all marker haplotypes simultaneously; and (iii) it can be used to estimate parameters that affect LD since it is based on the modeling of the process that generates LD.
APPENDIX: PROBABILITY OF MARKER HOMOZYGOSITY CONDITIONAL ON THE IBD PATTERN
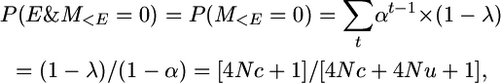
This appendix derives the probabilities of mutation occurring at a locus given in Table 1 of the main text. In a genealogical tree, eventually, all lineages coalesce to the most recent common ancestor. Whether a haplotype pair has identical marker alleles (homozygosity) or not depends on whether there was a mutation prior to the coalescence at the marker locus or not. Note: in the following we are always looking back in time, so if the mutation occurred 10 generations ago and the coalescence 20 generations ago, the mutation was prior to the coalescence. We consider two “events” (E), namely “recombination” (R) and “coalescence” (C), and calculate probabilities of a “mutation” relative to when these events occur, and E(t), R(t), and C(t) specify also the time of the event. No mutation is denoted by M = 0, no mutation prior to the occurrence of an event is denoted by M<E = 0, and no mutation after the event by M>E = 0.
The derivation uses the following probabilities for looking back in time one generation for two gametes:
 |
 |
 |
 |
 |
 |
where u is the mutation rate, c is the size of the segment (in morgans), and N is the effective population size.
Therefore the probability of the first event occurring in generation t and no mutation prior to then is the probability of t − 1 generations with no event and no mutation times the probability of an event in generation t. That is,
 |
and summation over all generations t gives the probability of no mutation prior to the event,
 |
where the first equality is because an event will inevitably occur if we look an infinite number of generations back in time.
There are three conditions under which the probability of a mutation is required:
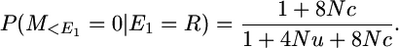
-
The locus is located on a chromosome segment of size c morgans that is IBD.
In the notation of the main text, this is P(yk | π = 1n). That is, the first event that occurs to this chromosome segment in gametes i and j is a coalescence (E = C). Therefore the probability of no mutation conditional on the chromosome segments coalescing is, in our notation,
And
because P(E(t) = C(t)|E(t)) is independent of t. It follows that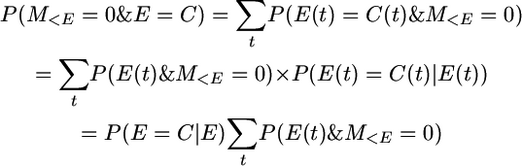
And since P(E = C) = 1/(1 + 4Nc),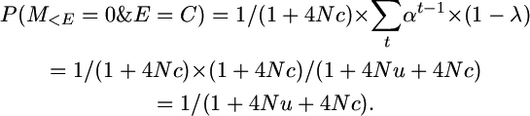
The probability of non-alike-in-state markers on a segment that coalesces is
assuming 4Nu is small.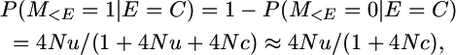
(A1) -
The locus is located at the end of a chromosome segment of size c morgans and there is a recombination in the segment to the right (or left) of the locus.
In the notation of the main text, this is P(yk | π = [0]). That is, the first event that occurs to this segment is a recombination (E = R). In the notation of the appendix, the probability that there is no mutation conditional on a recombination is But, in case the event is a recombination, we must consider that a mutation can occur either before or after the event, i.e.,
because P(E(t) = R(t) | E(t)) is independent of t. Also,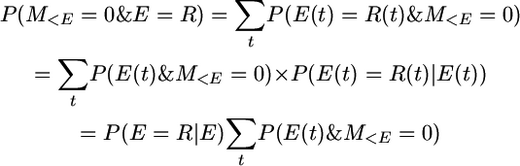
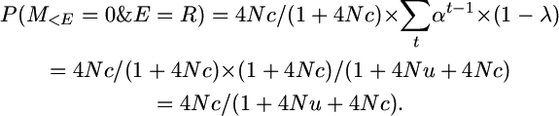 So
So
And, after a recombination, the coalescence of the two gametes is independent of what occurred beforehand, so P(M>E = 0 | E = R) is simply the unconditional probability of no mutation; i.e.,

Therefore P(M = 0 | E = R) = (1 + 4Nc)/(1 + 4Nu + 4Nc) × 1/(1 + 4Nu).
And the probability of non-alike-in-state marker alleles given that the marker is on a segment that recombined is
assuming 4Nu is small and as given in Table 1 for P(yk = 1 | π = [0]).
(A2) The locus is located between two chromosome segments of size c morgans and there are recombinations in both the segment to the right and the segment to the left of the locus.
In the notation of the main text this is P(yk | π = [0 0]). That is, the first event (E1) occurs in a recombination in one of the two segments and the second event (E2) is a recombination in the other segment. So the probability of no mutation conditional on these two events is
 |
where  denotes no mutation between events E1 and E2.
Now  is very similar to the probability derived in case 2 but now the recombination can occur anywhere in a segment of size 2c M, so
 |
In the coalescence, probabilities are not affected by what has happened previously so
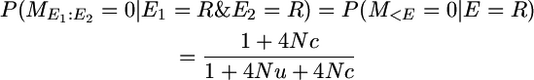 |
as in case 2 because now the second recombination must occur within a segment of size c morgans.
And, after the second recombination, the probability of coalescence without a mutation is
 |
as in case 2.
Therefore,
 |
The probability of non-alike-in-state markers given that there was a recombination to the right and to the left is
 |
(A3) |
for small 4Nu, as given in Table 1 for P(yk = 0 | π = [0 0]).
The above assumed that the segments to the left and the right of k have the same size, c. If this is not the case c can be set equal to the mean of the two recombination rates, which is a good approximation as long as the harmonic mean of (1 + 4Nci) approximates its usual arithmetic mean, i.e., as long as 4Nci is small or the ci values are not very different. It may be noted that each of the P(yk = 0 | …) equations has a 4Nu term in the numerator, which means that these probabilities are proportional to the mutation rate, u. In the case that the mutation rate is unknown, 4Nu may be approximated by the marker heterozygosity.
References
- Carlson, C. S., M. A. Eberle, L. Kruglyak and D. A. Nickerson, 2004. Mapping complex disease loci in whole-genome association studies. Nature 429: 446–452. [DOI] [PubMed] [Google Scholar]
- Chapman, N. H., and E. A. Thompson, 2003. A model for the length of tracts of identity by descent in finite random mating populations. Theor. Popul. Biol. 64: 141–150. [DOI] [PubMed] [Google Scholar]
- Dempster, A. P., N. M. Laird and D. B. Rubin, 1977. Maximum likelihood from incomplete data via the EM algorithm. J. R. Stat. Soc. B 39: 1–38. [Google Scholar]
- George, A. W., P. M. Visscher and C. S. Haley, 2000. Mapping quantitative trait loci in complex pedigrees: a two-step variance component approach. Genetics 156: 2081–2092. [DOI] [PMC free article] [PubMed] [Google Scholar]
- Gilmour, A. R., B. R. Cullis, S. J. Welham and R. Thompson, 2000. ASREML reference manual (ftp.res.bbsrc.ac.uk/pub/aar).
- Hayes, B. J., P. M. Visscher, H. C. McPartlan and M. E. Goddard, 2003. Novel multilocus measure of linkage disequilibrium to estimate past effective population size. Genome Res. 4: 635–643. [DOI] [PMC free article] [PubMed] [Google Scholar]
- Hill, W. G., and B. S. Weir, 1994. Maximum-likelihood estimation of gene location by linkage disequilibrium. Am. J. Hum. Genet. 54: 705–714. [PMC free article] [PubMed] [Google Scholar]
- Hudson, R. R., 1993. The how and why of generating gene genealogies, pp. 23–36 in Mechanisms of Molecular Evolution, edited by N. Takahata and A. G. Clark. Japan Scientific Societies Press, Tokyo.
- Hudson, R. R., 2001. Two-locus sampling distributions and their application. Genetics 159: 1805–1817. [DOI] [PMC free article] [PubMed] [Google Scholar]
- Hudson, R. R., 2002. Generating samples under a Wright-Fisher neutral model of genetic variation. Biometrics 18: 337–338. [DOI] [PubMed] [Google Scholar]
- Li, N., and M. Stephens, 2003. Modeling linkage disequilibrium and identifying recombination hotspots using single-nucleotide polymorphism data. Genetics 165: 2213–2233. [DOI] [PMC free article] [PubMed] [Google Scholar]
- Meuwissen, T. H. E., and M. E. Goddard, 2001. Prediction of identity by descent probabilities from marker-haplotypes. Genet. Sel. Evol. 33: 605–634. [DOI] [PMC free article] [PubMed] [Google Scholar]
- Meuwissen, T. H. E., A. Karlsen, S. Lien, I. Olsaker and M. E. Goddard, 2002. Fine mapping of a quantitative trait locus for twinning rate using combined linkage and linkage disequilibrium mapping. Genetics 161: 373–379. [DOI] [PMC free article] [PubMed] [Google Scholar]
- Minichiello, M. J., and R. Durbin, 2006. Mapping trait loci by use of inferred ancestral recombination graphs. Am. J. Hum. Genet. 79: 910–922. [DOI] [PMC free article] [PubMed] [Google Scholar]
- Olsen, H. G., S. Lien, M. Gautier, H. Nilsen, A. Roseth et al., 2005. Mapping of a milk production quantitative trait locus to a 420-kb region on bovine chromosome 6. Genetics 169: 275–283. [DOI] [PMC free article] [PubMed] [Google Scholar]
- Perez-Enciso, M., 2003. Fine mapping of complex trait genes combining pedigree and linkage disequilibrium information: a Bayesian unified framework. Genetics 163: 1497–1510. [DOI] [PMC free article] [PubMed] [Google Scholar]
- Terwilliger, J. D., 1995. A powerful likelihood method for the analysis of linkage disequilibrium between trait loci and one or more polymorphic marker loci. Am. J. Hum. Genet. 56: 777–787. [PMC free article] [PubMed] [Google Scholar]
- Visscher, P. M., and M. E. Goddard, 2004. Prediction of the confidence interval of quantitative trait loci location. Behav. Genet. 34: 477–482. [DOI] [PubMed] [Google Scholar]
- Wall, J. D., 2000. A comparison of estimators of the population recombination rate. Mol. Biol. Evol. 17: 156–163. [DOI] [PubMed] [Google Scholar]
- Wang, W. Y. S., B. J. Baratt, D. G. Clayton and J. A. Todd, 2005. Genome-wide association studies: theoretical and practical concerns. Nat. Rev. Genet. 6: 109–118. [DOI] [PubMed] [Google Scholar]