Abstract
Loss of granule content during exocytosis requires the opening of a fusion pore between the secretory granule and plasma membrane. In a variety of secretory cells, this fusion pore has now been shown to subsequently close. However, it is still unclear how pore closure is physiologically regulated and contentious as to how closure relates to granule content loss. Here, we examine the behavior of the fusion pore during zymogen granule exocytosis in pancreatic acinar cells. By using entry of high-molecular-weight dyes from the extracellular solution into the granule lumen, we show that the fusion pore has a diameter of 29–55 nm. We further show that by 5 min after granule fusion, many granules have a closed fusion pore with evidence indicating that pore closure is a prelude to endocytosis and that in granules with a closed fusion pore the chymotrypsinogen content is low. Finally, we show that latrunculin B treatment promotes pore closure, suggesting F-actin affects pore dynamics. Together, our data do not support the classical view in acinar cells that exocytosis ends with granule collapse. Instead, for many granules the fusion pore closes, probably as a transition to endocytosis, and likely involving an F-actin–dependent mechanism.
INTRODUCTION
Exocytosis of peptide-containing granules requires fusion of the granule membrane with the plasma membrane and the formation of an aqueous channel, a fusion pore, through which the contents are lost. A long-standing view is that the fusion pore dilates, and the granule membrane collapses into the plasma membrane, releasing the granule contents in a quantal all-or-none manner (Heuser and Reese, 1973). However, in granules containing low-molecular-weight neurotransmitters (Spruce et al., 1990; Albillos et al., 1997; Alés et al., 1999; Holroyd et al., 2002) and now in cells with peptide-containing granules (Taraska et al., 2003; Perrais et al., 2004; Tsuboi et al., 2004; Obermuller et al., 2005), evidence increasingly suggests that more complex behavior can occur. Instead of granule collapse, fusion pore opening can be followed by closure. A final closure of the fusion pore is an essential step in the kiss-and-run model of exocytosis (Ceccarelli et al., 1972), where it is the transitional step between exocytosis and the endocytic recovery of the granule (Holroyd et al., 2002; Bauer et al., 2004; Tsuboi et al., 2004).
Although many observations of these fusion pore dynamics are unequivocal, it is still controversial as to how fusion pore closure might be related to, or even regulate, loss of granule content (Bauer et al., 2004; Perrais et al., 2004; Obermuller et al., 2005). Furthermore, although a range of factors, such as dynamin (Graham et al., 2002; Tsuboi et al., 2004), complexin (Archer et al., 2002), calcium (Alés et al., 1999; Haller et al., 2001), and syntaxin (Wang et al., 2003), can affect pore dynamics, the physiological steps that regulate this process are not known.
We have studied exocytosis of zymogen granules in acinar cells of the exocrine pancreas (Palade, 1975). The kinetics of exocytosis are slow (Nemoto et al., 2001; Thorn et al., 2004), and we have proposed that endocytosis may occur by recovery of granule membrane in a piecemeal process (Thorn et al., 2004). Here, we show that the fusion pore formed by the zymogen granule is one of the largest pores identified (Curran et al., 1993; Melikyan et al., 1995) (we estimate a pore diameter of between 29 and 55 nm), and yet it is capable of closing. We provide evidence that this closure is likely a prelude to endocytosis and that it occurs after the majority of granule contents are lost.
MATERIALS AND METHODS
Cell Preparation
Mice were humanely killed according to local animal ethics procedures. The NaCl-rich extracellular solution contained 135 mM NaCl, 5 mM KCl, 1 mM MgCl2, 2 mM CaCl2, 10 mM glucose, and 10 mM HEPES, pH to 7.4 with NaOH. Isolated mouse pancreatic tissue was prepared by a collagenase digestion method in NaCl-rich extracellular solution (Thorn et al., 1993), modified to reduce the time in collagenase and to limit mechanical trituration. The resulting preparation was composed mainly of pancreatic lobules and fragments (50–100 cells), which were plated onto poly-l-lysine–coated glass coverslips. In experiments with heavy fluorescein-dextrans, problems with slow dye diffusion led us to modify the above-mentioned protocol to produce smaller tissue fragments by extending the times of trituration and incubating the fragments for 40 min, under constant gentle agitation, in the presence of the dyes and in the presence of 1% soybean trypsin inhibitor before study.
Confocal Imaging
Fixed specimens were imaged using a Zeiss 100M Axioscope confocal laser scanning microscope, with a 63× objective lens (numerical aperture [NA] 1.3). Images were collected with the appropriate filters and captured using the multitrack mode of the microscope to minimize cross-talk to <2%. Fluorescent probes were from Invitrogen (Carlsbad, CA). All other compounds were from Sigma Chemical (Poole, Dorset, United Kingdom) and Sigma (Castle Hill, NSW, Australia). All fixed cell data were obtained from many different tissue fragments from at least two independent preparations.
Assessment of Fusion Pore Dimensions
Lysine-fixable fluorescein-dextran dyes were added to the plated pancreatic fragments. The concentrations, adjusted to take account of the varying molecular weights were as follows: 3-kDa Texas Red-dextran (2 mg/ml), 3-kDa fluorescein-dextran (2 mg/ml), 70-kDa fluorescein-dextran (6.5 mg/ml), 500-kDa fluorescein-dextran (3 mg/ml), and 2000-kDa fluorescein-dextran (8 mg/ml). Cells were stimulated with 2 μM acetylcholine for 5 min at room temperature, and then they were washed and fixed in 4% paraformaldehyde in phosphate-buffered saline for 30 min. The Stokes–Einstein radius for each fluorescein-dextran was calculated from the average molecular mass by using the formula radius = 0.33(molecular mass)0.463 (Venturoli and Rippe, 2005). Diameters are 3 kDa, 2.6 nm; 70 kDa, 11.4 nm; 500 kDa, 28.8 nm; and 2000 kDa, 55.2 nm. The radius of α-amylase (55 kDa) was calculated as 6.4 nm by using the formula radius = 0.483(molecular mass)0.386.
Protocol for CL-6B Gel Separation
CL-6B beads (Sigma-Aldrich) were washed and packed into a 0.75- × 30-cm column. Dextran blue 2000 kDa was passed through the column to calculate void volume and flow rate (set to 160 μl/min). Fractions were collected every minute into individual wells on a 96-well plate. Dye concentration was determined using absorbance spectroscopy at 590 nm. The column was standardized using apoferritin and thyroglobulin.
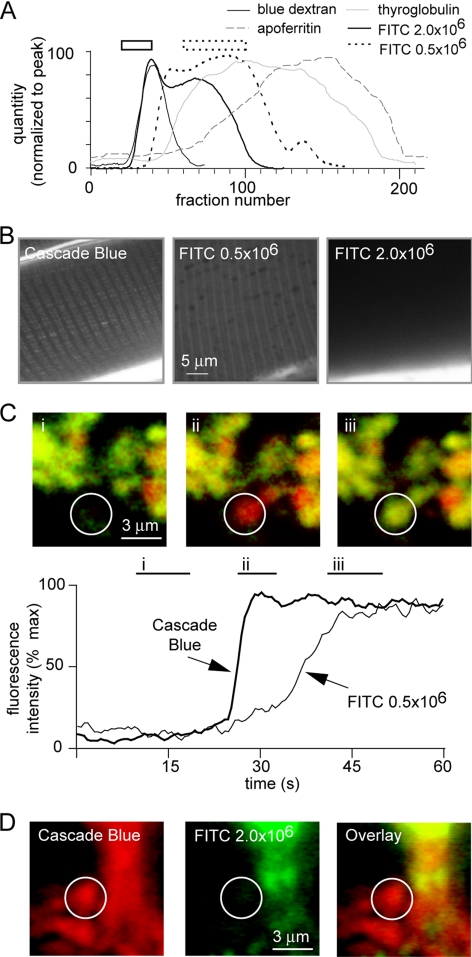
The fluorescein-dextrans were diluted in 2 ml PBS, applied to the column, and collected fractions were quantified by fluorescence spectroscopy at 485-nm excitation and 510-nm emission. To purify the fluorescein-dextrans, we collected the appropriate subset of fractions for each of the dyes as shown in the bars above the graph in Figure 2A. These were concentrated in a centrifugal filter with a molecular mass cut-off of 30 kDa (Amicon Ultra; Millipore, Billerica, MA) and resuspended in extracellular solution.
Figure 2.
Size exclusion indicates that the zymogen granule pore is 29–55 nm in diameter. (A) Elution profiles from a CL-6B column show that the 500- and 2000-kDa fluorescein-dextrans are polydisperse. After comparison with standards (2000-kDa dextran blue, thyroglobulin [660 kDa], and apoferritin [443 kDa]), we selected appropriate fractions (shown as bars above the graph; solid, 2000 kDa; dotted, 500 kDa) for each of the fluorescein-dextrans for use in our studies. (B) A size-exclusion bioassay using the mouse skeletal muscle T-tubule system, which has a known minimum dimension of 30 nm, applied extracellular fluorescent dye and looked for dye entry into the T-tubules. Cascade Blue and purified 500-kDa dextran applied outside (see bright fluorescence at the bottom of the images) entered the T-tubule, whereas the purified 2000-kDa dextran was present outside the muscle (bright fluorescence in the bottom of image) but excluded from the tubules. (C) The purified 500-kDa fluorescein-dextran entered the granules, and live-cell imaging demonstrated the expected slower kinetics of entry of this dye compared with Cascade Blue. The graph shows the average fluorescence recorded within the region of interest shown as a circle in the images. Images were produced by averaging the fluorescence over the times indicated as i, ii, and iii. (D) In contrast, purified 2000-kDa fluorescein-dextran did not enter the granules (an example event is highlighted by the circle in the figure), placing an upper limit on the fusion pore diameter of 55 nm. Note that the 2000-kDa dye was apparently excluded from the lumens of the larger clusters; therefore, we focused our analysis on small clusters of up to four cells where there is no lumen.
Use of Skeletal Muscle
Mice were humanely killed according to local animal ethics procedures. Extensor digitorum longus muscle was dissected out; small bundles of fibers were separated and then stretched out under oil according to previously published procedures (Launikonis and Stephenson, 2002). Droplets (1 μl) containing the purified fluorescein-dextran dyes or Cascade Blue dye were applied to the edge of the stretched muscle, and then the dyes were spread by capillary action along the muscle length.
Assessment of Fusion Pore Dynamics
Freshly prepared cells were placed on poly-l-lysine–coated coverslips and incubated with 3-kDa Texas Red-dextran (2 mg/ml) at 37°C. After stimulation, cells were fixed in 4% paraformaldehyde for 30 min. Then, 3-kDa fluorescein-dextran (4 mg/ml) was added either along with the Texas Red-dextran or at various times after the start of the acetylcholine (ACh) stimulation. To remove dye from the extracellular medium, cells were washed with fresh 4% paraformaldehyde every 5 min during cell fixation. To determine the green/red ratio, fluorescence intensity was measured in a region of interest (diameter, 0.5 μm) in granule and luminal areas. Immunostaining with a monoclonal anti-chymotrypsin antibody (1:50) (2100-0657; Serotec, Kidlington, United Kingdom) was performed after Triton X-100 permeabilization, as was phalloidin staining. The Shapiro–Wilks normality test was performed using GraphPad Prism software (GraphPad Software, San Diego, CA, USA), and the normal probability plots were produced by a coded algorithm in Excel (Microsoft, Redmond, WA).
Live-Cell Two-Photon Imaging
We used a custom-made, video-rate, two-photon microscope (Thorn et al., 2004) with a 60× oil immersion objective (NA 1.42; Olympus, Tokyo, Japan), providing an axial resolution (full width, half maximum) of ∼1 μm. We imaged exocytotic events using 100 μM Cascade Blue (607 Da), 20 μg/ml sulforhodamine B (SRB) (558 Da), and fluorecein-dextrans as a membrane-impermeant fluorescent extracellular marker excited by femtosecond laser pulses at 800 nm, with fluorescence emission detected at 400–490 nm for Cascade Blue and 570–650 nm for sulforhodamine B or fluorescein-dextrans.
In all experimental protocols, control experiments with single dyes were used to assess cross-talk between fluorescence channels; in all cases, this was <7%. In the experiments with the fluorescein-dextrans (Figure 2), se corrected for this cross-talk. Background fluorescence signal was estimated from regions within the basal pole of the cell, and all fluorescence signals were background-subtracted.
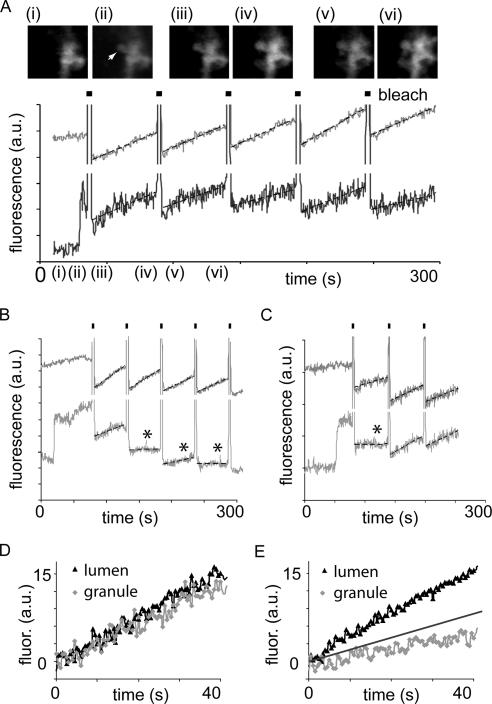
Images (resolution of 10 pixels/μm; average of 15 video frames) were captured with VideoSavant (IO Industries, San Antonio, TX) and analyzed with the MetaMorph program (Molecular Devices, Sunnyvale, CA). An epifluorescent mercury light source provided high-intensity light to photobleach the extracellular dye in an ∼30-μm-diameter field at the image plane. Exocytotic event kinetics was measured from regions of interest (0.78 μm2; 100 pixels) over granules. Traces were rejected if extensive movement was observed. Photobleach recovery showed complex kinetics, presumably reflecting a multiexponential time course as dye diffused back through the tortuous acinar lumen. However, we found that linear regression (GraphPad Prism) approximated the recoveries well and robustly (Figure 7). All data are shown as mean ± SEM.
Figure 7.
Fusion pore dynamics measured in real time. In cells bathed in Cascade Blue and stimulated with 10 pM cholecystokinin, repeated cycles of local photobleaching were applied. (A) A graph of Cascade Blue fluorescence over time in a region of interest centered on the acinar lumen (top light trace) and in a region of interest centered on a single granule (bottom dark trace). The granule is indicated by the arrow in top gallery of images. For each cycle of photobleaching the high-intensity illumination was on for 2.5 s (shown by the dark bars), and photobleaching in the regions of interest is evident as a decrease in the fluorescence signal that subsequently recovers over time in both the granule and the acinar lumen. The gallery of images shows control (i), the appearance of the granule (ii), and the decrease (iii and v) and recovery (iv and vi) of fluorescence at the indicated times. Bar, 1 μm. (B) A similar experiment, except that recovery of fluorescence in the granule (bottom trace) is seen for the first cycle of photobleaching but not for the subsequent cycles. During each cycle of photobleaching, the fluorescence recovers in the lumen (top trace). (C) In this experiment, the fluorescence in the granule fails to recover after photobleaching for one cycle, but then it recovers in later cycles (bottom trace), providing evidence for a dynamic opening and closing of the fusion pore. An arbitrary threshold of granule fluorescence recovery (slope of 0.2 fluorescence units [a.u.]/s) was used separate the data into two populations. Those above this threshold, indicating an open fusion pore, were normalized to an initial zero value and averaged (D). Those below the threshold, indicating a closed fusion pore, were normalized to an initial zero value and averaged (E). Diamonds show the fluorescence recovery in the granules; triangles show the accompanying fluorescence recovery in the adjacent lumens. The straight line in E shows the line of the threshold slope of 0.2 fluorescence units (a.u)/s.
RESULTS
Measurement of Fusion Pore Size
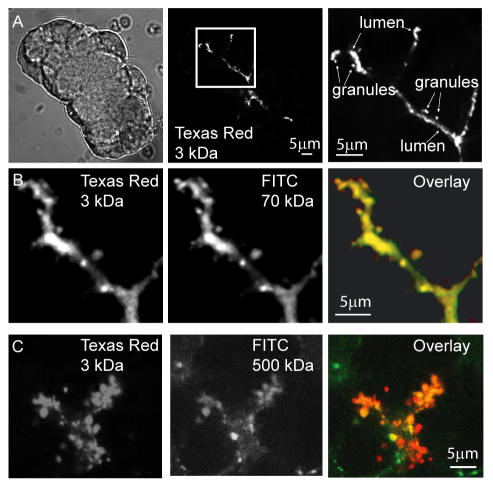
Fusion pore opening can be monitored through the entry of extracellular aqueous dyes into the granule interior (Nemoto et al., 2001; Thorn et al., 2004). Here, we have used extracellular lysine-conjugated fluorescent dyes fixed with paraformaldehyde to label granules (Turvey and Thorn, 2004; Pickett et al., 2005). When cells were stimulated with ACh for 1 min in an extracellular solution containing 3-kDa Texas Red-dextran and fixed, we observed fluorescent labeling of the branching lumen between acinar cells and spherical labeled structures apposed to this lumen, which we have previously characterized as zymogen granules (Thorn et al., 2004; Turvey and Thorn, 2004; Figure 1A).
Figure 1.
The zymogen granule fusion pore allows entry of large molecules. (A) Isolated pancreatic fragments, incubated in 3-kDa Texas Red-dextran were stimulated with ACh, and then they were fixed with paraformaldehyde. Confocal imaging of a fragment shown under phase illumination (left) demonstrates typical staining of a branching acinar lumen (middle) and labeling of granules (magnified image, right). Coincubation with higher-molecular-mass fluorescein-dextran dyes shows that 70-kDa (B) and 500-kDa (C) dyes labeled the same granules as 3-kDa Texas Red-dextran.
Amylase, a major cargo protein of zymogen granules, has a molecular weight of ∼55 kDa, and, as would be expected, we found that when coapplied, 70-kDa fluorescein-dextran labeled the same exocytotic granules as 3-kDa Texas Red-dextran (Figure 1B). To probe the size of the fusion pore, we tested a range of fluorescein-dextrans of increasing molecular mass, up to 500 kDa (29 nm in diameter). In all experiments, these larger fluorescent dyes colabeled the same exocytotic granules as 3-kDa Texas Red-dextran (Figure 1C). However, there are two problems with the use of fluorescein-dextrans. First, they are polydisperse with a mixture of sizes present; and second, our diameter estimates are dependent on the dextran occupying a compact globular shape, which in reality they may not. To address the first issue, we ran the fluorescein-dextrans on a Sepharose CL-6B column, we compared the elution profiles obtained with those for standards of known molecular mass, and we selected the appropriate fractions as “purified” dyes for use in our experiments (Figure 2A, bars above graph indicate the fractions used for the purified dyes). Clearly, both the 2000- and 500-kDa fluorescein-dextrans are polydisperse, with a relatively wide spread across the fractions, suggesting the 2000-kDa dye has a substantial component of lower molecular mass and the 500-kDa dye has a component of higher molecular mass. Having purified the dyes, we then conducted a bio-exclusion assay by using freshly isolated mouse skeletal muscle (Launikonis and Stephenson, 2002) where the T-tubule system is open to the outside, and it is known to have a minimum dimension of ∼30 nm (Luff and Atwood 1971). Cascade Blue (607 Da) and the purified fluorescein-dextrans were applied individually to the extracellular media. Images showed the T-tubule system was apparent for Cascade Blue and 500-kDa fluorescein-dextran but not for the 2000-kDa fluorescein-dextran, indicating diffusive entry of the lower-molecular-mass dyes into the T-tubules (Figure 2B). We conclude that the 500-kDa fluorescein-dextran must have a size of <30 nm, consistent with the calculated diameter of 29 nm.
When we applied the purified dyes to the extracellular solution bathing pancreatic acini, we found that the 500-kDa fluorescein-dextran could enter the granules but that the 2000-kDa dye could not (Figure 2, C and D). Cascade Blue was simultaneously applied to enable positive identification of a granule fusion event. To quantify entry of the fluorescein-dextran, we expressed a ratio of the dye intensity within the granule as a proportion of dye intensity in the lumen; a ratio of 1.0 was obtained, indicating complete equilibration across the fusion pore. The ratios were 0.922 ± 0.061 (mean ± SEM; n = 94 granules) for 500-kDa fluorescein-dextran and 0.059 ± 0.009 (mean ± SEM; n = 71 granules) for the 2000-kDa dye; clearly, the larger dye cannot enter the granules. Furthermore, in live-cell experiments tracking fluorescent changes as the granule fused, we found that the entry into the granule of 500-kDa fluorescein-dextran was much slower than the entry of Cascade Blue, consistent with the slower diffusion expected for the larger dye (Figure 2C).
These results indicate that the zymogen granule fusion pore has a diameter between 29 and 55 nm. This size is at odds with that from a previous report of 100–180 nm measured with atomic force microscopy (Schneider et al., 1997).
Large fusion pores have been described previously; for example, mast cells have pore diameters of >100 nm (Melikyan et al., 1995). However, these large pores are thought to occur at a terminal phase of exocytosis when the pore dilates and the granule collapses into the plasma membrane (Heuser and Reese, 1973; Curran et al., 1993). Semistable fusion pores, capable of closure, are thought to have much smaller diameters (Albillos et al., 1997; Alés et al., 1999). So, the next question we addressed was, is the large pore of the zymogen granule capable of closure?
Dynamics of the Fusion Pore
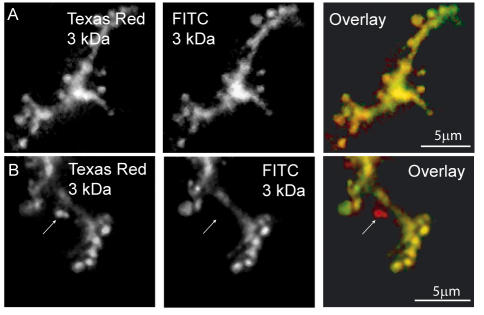
To directly test for the possibility of fusion pore closure, we developed a dual-labeling technique with extracellular 3-kDa Texas Red-dextran and 3-kDa fluorescein-dextran. In control experiments, cells were stimulated with ACh in the presence of both extracellular dyes. Both dyes labeled all granules (Figure 3A). In subsequent experiments Texas Red-dextran was present throughout the experiment, but fluorescein-dextran was applied at various times after ACh stimulation. The ACh stimulus was time limited to 1-min duration by the addition of a 10-fold excess of the antagonist atropine. We expected that a granule would be labeled with both dyes if the fusion pore remained open. However, if the fusion pore closed at time points after stimulation, the Texas Red-dextran would be trapped within the granule, whereas fluorescein-dextran (the second dye) would be excluded. In the example shown (Figure 3B), fluorescein-dextran was added 5 min after ACh. The overlay figures show that most granules are yellow, indicating that both dyes have entered the granule interior; however, a significant number of granules (∼15%) were labeled only with Texas Red-dextran.
Figure 3.
The zymogen granule fusion pore can close. (A) Isolated pancreatic fragments, incubated in 3-kDa Texas Red-dextran and 3-kDa fluorescein-dextran (labeled as FITC on the figure) were stimulated with ACh. Stimulation was terminated after 1 min by the application of the competitive antagonist atropine, and 5 min later the fragments were fixed with paraformaldehyde. Confocal images show that, as expected, the acinar lumen and all zymogen granules are stained by both dyes. (B) Isolated pancreatic fragments, incubated in 3-kDa Texas Red-dextran were stimulated with ACh for 1 min, and stimulation was terminated by the application of atropine. Five minutes later, 3-kDa fluorescein-dextran was added to the bathing solution and after a further 5 min the fragments were fixed with paraformaldehyde. Confocal images show that most granules are stained by both dyes but that ∼15% are stained only with 3-kDa Texas Red-dextran (arrow).
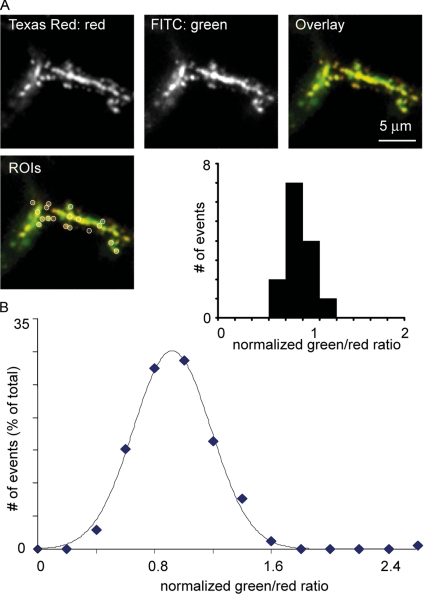
To quantify these data, we measured the average Texas Red (red) and fluorescein (green) fluorescence within an area centered on individual granules (Figure 4A). We also measured the average fluorescence in an area centered over the acinar lumen (Figure 4A). To exclude possible artifactual differences in dye distribution, the green/red ratio within the granule was normalized to the green/red ratio within the acinar lumen (Figure 4A, graph inset). With this analysis, an open fusion pore and freely diffusible dyes would lead to a normalized ratio of 1.00; that is, the green/red ratio in the granule would be the same as the green/red ratio in the lumen. Consistent with this expectation, a frequency-ratio graph for the control data, with both dyes present simultaneously, showed a distribution of values centered on a green/red ratio of ∼1.00 (Figure 4B). A Shapiro–Wilk normality test showed that this distribution was not significantly different from a Gaussian (p = 0.2).
Figure 4.
Quantitative analysis of granule fusion pore closure. (A and B) Mean Texas Red-dextran (red) and fluorescein-dextran (labeled as FITC green on the figure) fluorescence intensity was recorded in regions of interest (0.5 μm in diameter) placed over individual granules and over the acinar lumens (see inset showing regions of interest, labeled as ROIs). Granular fluorescence was normalized to luminal fluorescence and the green/red fluorescence ratio in the granules was calculated. Experiments with simultaneous addition of both dyes gave an approximately Gaussian distribution of the granular green/red ratio centered at a ratio of ∼1 (A, inset histogram, and B for all data). The curve on the graph in B is a fitted Gaussian distribution.
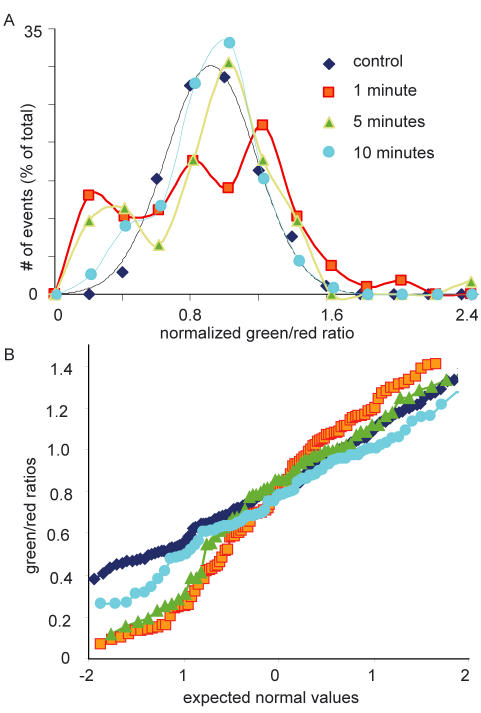
In the experiments where fluorescein was added after a delay, fusion pore closure would exclude fluorescein dye and the normalized green/red ratio would be <1.00. The frequency-ratio graphs show that this was the case and that when fluorescein was added at 1, 5, and 10 min after ACh stimulation, there was a shift to the left in the frequency-ratio curves (Figure 5A, 466 granules, >62 cells). This shift can be measured as an increase in the proportion of granules that show a green/red ratio of <0.4. In the control, this proportion was 2.9%, rising to 22.1 and 20.0% at 1 and 5 min, respectively, and falling to 11.1% at 10 min. A Shapiro–Wilk normality test showed that the distributions at 1 and 5 min after stimulation were significantly different from Gaussian, with p < 0.05 and p < 0.01, respectively. By 10 min, the Shapiro–Wilk normality test gave p = 0.69; hence, at this time, we cannot reject a Gaussian distribution. We conclude that at 1 and 5 min after cessation of the stimulus, there is evidence for fusion pore closure. At 10 min, granules with a low green/red ratio are not seen, suggesting either that they have been endocytosed or that the fusion pore may have reopened. In Figure 5B, the same data are shown transformed and plotted as a normal probability plot, where a normal distribution is expected to be linear. Although the control data (diamonds) approximate to a straight line, the other time points do not.
Figure 5.
(A) Evidence for fusion pore closure. In experiments similar to those of Figure 4, Texas Red-dextran was added at time zero and fluorescein-dextran was added at 1, 5, and 10 min after ACh stimulation. The normalized green/red ratio values shifted to the left; and for 1 and 5 min, the distributions differed significantly from a Gaussian, with a greater than expected proportion of granules with a low intensity of fluorescein-dextran (green). At 10 min, the distribution was still left-shifted but was not significantly different from a Gaussian distribution. (B) A graph of the same data plotted as normal probability plots shows deviations from the straight line expected of a normal distribution at 1 and 5 min.
Fusion Pore Dynamics in Live Cells
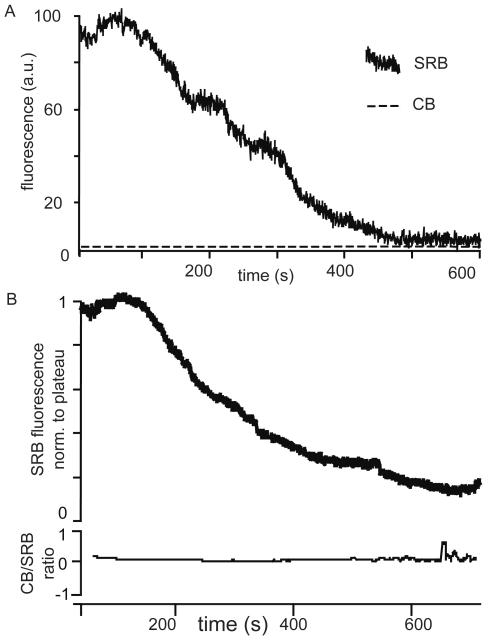
To gain further insight into the fusion pore dynamics in acinar cells, we designed a live-cell assay using the dual-labeling method. In this assay, we stimulated the cells with 10 pM cholecystokinin in the presence of sulforhodamine B, then, after 5 min, we added the second fluorescent dye, Cascade Blue, and we imaged the granules that contained only sulforhodamine B (i.e., those with closed fusion pores). In six of eight granules, sulforhodamine B fluorescence decayed with no increase in the Cascade Blue fluorescence (Figure 6A) and no change in the normalized Cascade Blue/sulforhodamine B fluorescence ratio (Figure 6B). This result is consistent with our previous observations of piecemeal recovery of small vesicles from the larger granule (Thorn et al., 2004), and it indicates that the fusion pore does not open during the period of granule recovery. We tested for the possibility that the sulforhodamine B fluorescence signal might be lost due to granule acidification. In vitro experiments determined the sulforhodamine B fluorescence was nearly insensitive over a pH range from 7 to 2, with a decrease in fluorescence over that range of only 7.2% (data not shown). Therefore, our data indicate that fusion pore closure likely terminates the exocytotic process and that it is a prelude to endocytosis.
Figure 6.
Closure of the fusion pore is a prelude to endocytosis. In live experiments cells were stimulated with 10 pM cholecystokinin in the presence of sulforhodamine B (SRB), and then, after 5 min, Cascade Blue (CB) was added to the extracellular solution. Granules containing predominantly sulforhodamine B were then identified, and their fluorescence was followed through time. (A) A single representative record illustrating the loss of sulforhodamine B fluorescence over a time period where the very low levels of Cascade Blue fluorescence do not change. (B) A graph of the mean decrease of sulforhodamine B fluorescence over time for six granules and the corresponding lack of change in the normalized Cascade Blue/sulforhodamine B fluorescence over the same time period.
The dual-dye method has only a limited temporal resolution; therefore, to gain further insight into real-time fusion pore dynamics, we refined a photobleaching method described previously (Thorn et al., 2004). We stimulated exocytosis with 10 pM cholecystokinin in the presence of extracellular Cascade Blue, and we locally photobleached the dye in the granule and adjacent acinar lumen with high-intensity spot illumination for 5 s in 55-s cycles. After photobleaching, unbleached dye in the larger extracellular volume will diffuse back into the granule lumens, provided that the fusion pore is open (Thorn et al., 2004). The fluorescence signals, in regions of interest in the granule and in the acinar lumen, were followed over time for each cycle of photobleaching (Figure 7).
In many exocytotic granules (12/33 granules), the fluorescence within the granule recovered after each photobleach cycle, up to 5 cycles (the maximum used in this study), demonstrating continuity of the granule interior with the acinar lumen over a time period of ∼5 min. The bottom trace in Figure 7A shows the granule region of interest; the top trace shows the acinar lumen region of interest, and the image gallery above shows selected images of the appearance of the granule and then the bleaching and recovery of fluorescence at the time points indicated. The average rate of acinar lumen recovery was 0.412 ± 0.031 fluorescence units (arbitrary units [a.u.])/s (mean ± SEM; n = 33). The mean recovery in the granules, 0.457 ± 0.093 fluorescence units (a.u.)/s (n = 12), was not significantly different (Student's t test, p = 0.86). However, in 64% of exocytotic events (21/33), fluorescence recovery was not seen for at least one of the cycles of photobleaching, even though the fluorescence in the adjacent lumen did recover (Figure 7B). Lack of recovery was arbitrarily defined by a slope recovery of <0.2 fluorescence units (a.u.)/s (Figure 7, B and C, bottom traces; lack of recovery indicated by asterisk). The average slope in the granules ascribed to the population that did not recover fluorescence was 0.084 ± 0.019 fluorescence units (a.u.)/s (n = 21), significantly different from the lumen recovery rates (Student's t test, p < 0.001). Most of these events did not recover after a single (18/21) or subsequent bleach cycles, as shown in the example in Figure 7B. However, in three events, lack of recovery in one cycle of photobleaching was followed by recovery in the next cycle (Figure 7C, bottom trace). The fluorescent recoveries extracted from either the last photobleach cycle (in granules that always recovered fluorescence) or from the first photobleach cycle where recovery was not seen, were averaged together, and the data are shown in Figure 7, D and E.
Because in all cases the fluorescence of the adjacent acinar lumen did recover, at a rate greater than 0.2 fluorescence units (a.u.)/s, the only potential barrier to fluorescence recovery in the granule is a closed fusion pore. Furthermore, in those events that showed subsequent fluorescence recovery, either the fusion pore must have reopened or a new fusion pore must have formed. On the basis of these results, we conclude that majority of exocytotic events involve irreversible closure of the fusion pore within ∼5 min after the initial pore opening, supporting the idea that closure is usually the final event of the exocytotic process, although sometimes reopening can occur.
Relationship between Fusion Pore Dynamics and Loss of Granule Contents
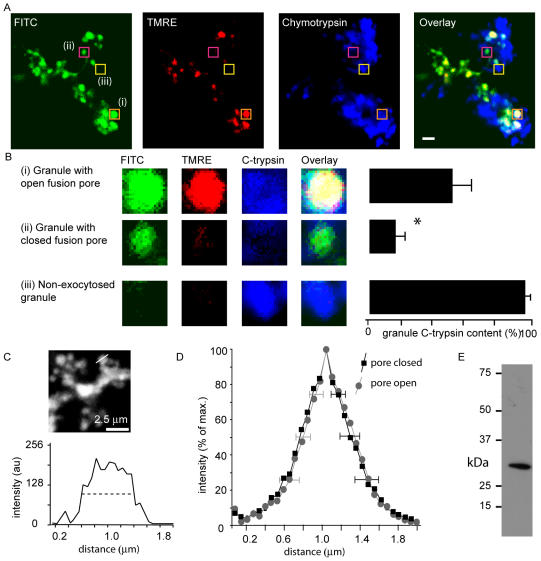
Under physiological conditions, it would be expected that granule content would be lost before endocytosis. To test whether this is the case, we used immunohistochemistry of native chymotrypsinogen in combination with our fixed cell dual-labeling assay for fusion pore closure, fixing the cells 5 min after the onset of cholecystokinin stimulation (Figure 8A). Granule chymotrypsinogen content was estimated by comparison of chymotrypsinogen fluorescence in granules that had not undergone exocytosis (e.g., Figure 8Ai, enlarged in Figure 8Biii). We identified granules with open fusion pores as having normalized dye ratios of greater than 0.4, and those with closed fusion pores as having ratios <0.4 (Figure 8, A and B). We found that granules with open fusion pores still contained about half their original content, with remaining chymotrypsinogen levels at 52.8 ± 8.3% (n = 15). By contrast, granules with closed fusion pores had contents of only 15.1 ± 6.7% (n = 67), significantly less (Student's t test, p < 0.05) than the content of the granules with the open fusion pore. These differences in content in the two populations of granules do not reflect changes in granule size (Figure 8, C and D).
Figure 8.
Correlation between fusion pore closure and loss of granule contents. In experiments performed in a similar manner to those in Figure 4, cells were stimulated in the presence of fluorescein-dextran (labeled FITC on the figure), and tetramethylrhodamine ethyl ester (labeled TMRE on the figure) Dextran was subsequently applied to probe for fusion pore closure. After cell fixation, chymotrypsinogen immunostaining was carried out as shown in the top series of images. Bar, 2 μm. The average chymotrypsin immunofluorescence, measured in regions of interest centered on individual granules, was correlated with the normalized TMRE/fluorescein ratio. (B) Analysis showed that the population of granules with evidence for fusion pore closure (ratios <0.4, an example shown in Aii and Bii) had significantly lower chymotrypsin fluorescence (normalized to nonexocytosed granule fluorescence label) than the population of granules with open fusion pores (an example shown in Ai and Bi) (images in B, 2-μm squares). (D) Measurement of the granule diameter with the full-width half-maximal fluorescence (illustrated in C) showed no difference in granule diameter between the populations of granules with the pore closed (ratio <0.4) and the pore open (ratio more than 0.4). (E) Western blot of whole pancreatic lysate probed with chymotrypsinogen antibody shows a single band of the expected molecular mass of ∼25 kDa.
Relationship between Fusion Pore Dynamics and F-Actin
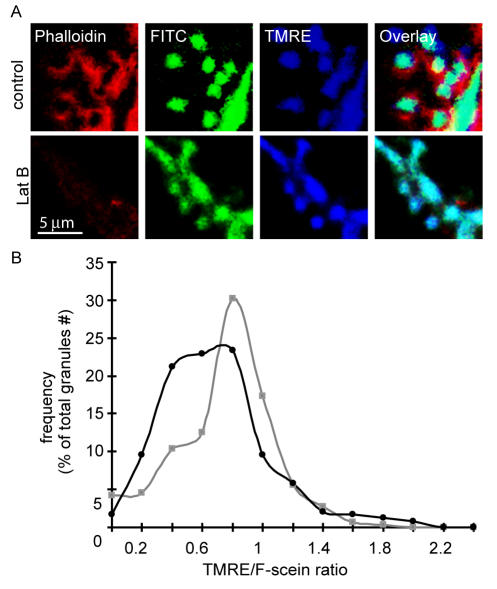
After fusion pore opening, the granules become coated with F-actin (Turvey and Thorn, 2004, Nemoto et al., 2004), a process that to date has no known function. To test possible F-actin involvement in fusion pore dynamics, we conducted the dual labeling method with the cells bathed in the first dye, fluorescein, and stimulated for 5 min before adding the second dye, tetramethylrhodamine. The test cells were pretreated with 10 μM latrunculin B for 10 min. Figure 9A shows typical control data in the top images with evidence for F-actin (stained with phalloidin) coating of granules. Pretreatment with latrunculin B reduced phalloidin staining (Figure 9A, bottom). Ratio analysis shows the control frequency histogram (Figure 9B, gray squares, n = 288 granules, >37 cells) with a similar distribution to the 5-min time point in Figure 5; that is, more granule events with low ratios, indicative of fusion pore closure. In the latrunculin B-treated cells (Figure 9B, black circles, n = 240 granules, >31 cells), the distribution shows a further shift to the left indicative of a significant increase (Student's t test, p < 0.001, comparing the control and test ratios) in the number of granules with evidence for fusion pore closure. We conclude that F-actin can influence fusion pore dynamics by stabilizing fusion pore opening.
Figure 9.
F-actin affects fusion pore closure. Two-dye experiments were performed with fluorescein-dextran as the first dye and TMRE added 5 min after stimulation as the second dye. After cell fixation, phalloidin was used to label the F-actin cytoskeleton, which is seen in the apical domain and coating individual granules (A, top images). In B (bottom images), cells were pretreated for 10 min with latrunculin B, which prevented F-actin coating and reduced apical F-actin. A frequency-ratio analysis of the TMRE/fluorescein showed the left shift in the Gaussian distribution expected at the 5-min time course and indicative of fusion pore closure (B). The same analysis after latrunculin B pretreatment showed a significantly higher proportion of granules with low TMRE/Fluorescein ratios, indicating latrunculin B treatment led to fusion pore closure.
DISCUSSION
By using two independent techniques, our data demonstrate that the large exocytotic fusion pore of zymogen granules can close and that closure is a common occurrence, evident in many granules 5 min after initial fusion. Fusion pore closure is shown to be a prelude to endocytosis, and supporting this idea, granules with closed fusion pores have significantly less content than those with open fusion pores. Finally, inhibition of F-actin coating of the granule leads to fusion pore closure. Together, this work argues against the accepted view that zymogen granule fusion is followed by granule collapse into the plasma membrane. It indicates complexity in the regulation of enzyme release from pancreatic acinar cells, and it suggests that F-actin may be an important regulator of fusion pore dynamics.
In other systems, there is evidence that the fusion pore is dynamic, changing over time and existing in one of three distinct states (Fernandez et al., 1984, Spruce et al., 1990; Curran et al., 1993; Wang et al., 2001). It is first observed as a small pore with a conductance similar to that of an ion channel (Zimmerberg et al., 1987; Spruce et al., 1990). The pore can then rapidly expand to a severalfold larger second-stage pore (Spruce et al., 1990). In many cases, this second-stage pore is semistable, and it can fluctuate between open and closed states (Spruce et al., 1990; Curran et al., 1993; Melikyan et al., 1995). In some cell types, this second-stage fluctuating pore can last for a few seconds before resolving into either a closure (e.g., viral fusion, Melikyan et al., 1995 and chromaffin cells, Albillos et al., 1997) or a complete irreversible opening (e.g., mast cells; Spruce et al., 1990; Alvarez de Toledo et al., 1993). This third-stage likely involves dilation of the pore, giving it a large conductance, presumably as complete fusion of the two membranes occurs (Melikyan et al., 1995). These stages of fusion pore development have been seen in divergent examples of membrane fusion ranging from syncytia formation (Mohler et al., 1998) to influenza hemagglutinin-mediated viral fusion with a host cell (Melikyan et al., 1995) to chromaffin cell granule exocytosis (Albillos et al., 1997).
We have developed two new methods for the study of fusion pore dynamics. The dual-dye–labeling technique is used in fixed cells (Figures 3–5 and 9) and combined with immunohistochemistry (Figure 8) or used in living cells (Figure 7). The photobleaching method is more complicated to perform, but it gives temporal information on pore dynamics, and it is essential to reveal pore reopening. The estimates of the proportion of closed fusion pores differ using the two techniques; 20% at 5 min in the fixed cell dual-dye method and 57% in the photobleaching method. These differences may have a number of explanations. First, in both cases, they are dependent on arbitrary thresholds. Increasing the green/red ratio threshold from 0.4–0.5 would obviously increase the proportion of granules identified with closed fusion pores. Second, in the fixed cell studies, the time course is not that well defined, because fixation takes place over many minutes. Pore opening during this time would lead to entry of the second dye and thereby underestimate the proportion of granules with a closed fusion pore. Whatever the basis for the differences in granule numbers, both techniques provide compelling evidence for pore closure.
Fusion pore dynamics are apparently under the influence of a variety of factors (Alés et al., 1999; Haller et al., 2001; Archer et al., 2002; Graham et al., 2002; Wang et al., 2003; Tsuboi et al., 2004). The large-diameter zymogen granule fusion pore, 29–55 nm, is larger than previously observed second-stage fluctuating pores, which raises the question of how such a large structure might close. Because of its size, the pore is unlikely to be exclusively proteinaceous (Wang et al., 2001); therefore, an ion channel-like mechanism for closure is not plausible. Here, we present the first evidence that the fusion pore dynamics is associated with the F-actin cytoskeleton, with latrunculin B treatment leading to fusion pore closure. Previous work has shown that F-actin coating of zymogen granules (Valentijn et al., 2000) occurs in all postfusion granules (Turvey and Thorn, 2004; Nemoto et al., 2004). A similar phenomenon has been observed in oocytes, and here there is evidence that coating involves actin nucleation (Sokac and Bement, 2006). Schneider et al. (1997) showed that actin depolymerization leads to a decrease in the size of apical depressions in pancreatic acinar cells, which they interpreted as an effect on the fusion pore diameter. However, our experiments now directly show effects of latrunculin B on fusion pore dynamics, and they suggest that F-actin stabilizes an open fusion pore presumably through a membrane-cytoskeleton linker protein. The coupling of the fusion pore to F-actin provides a possible site of regulatory control of pore dynamics perhaps through a motor protein. In support of this idea, in lacrimal acinar cells, myosin 2 has been shown to be associated with granules (Jerdeva et al., 2005); and in chromaffin cells, disruption of myosin 2 activity affects the kinetics of vesicular release of catecholamines (Neco et al., 2004).
In other cell types, fusion pore closure is thought to be a prerequisite for whole-granule recapture in a kiss-and-run type of exocytosis (Ceccarelli et al., 1972). However, although this model has been suggested for acinar cells (Cho et al., 2002), we have never seen recapture of previously fused whole granules into cells. Instead, the data in Figures 6 and 7 indicate that fusion pore closure is the terminal point of exocytosis and the prelude to a different form of endocytosis. In Figure 6, after following single-color granules (indicating fusion pore closure) for protracted periods, we eventually observed a decrease in their fluorescence, which we have previously interpreted as piecemeal pinching back of small subresolution vesicles. These vesicles may then be recovered into the cell and recycled through the Golgi complex, a mechanism that would preserve the lipid and protein identity of the granule membrane (Thorn et al., 2004). What is new here is that during this recapture phase, the granule color does not change; that is, the fusion pore must remain closed throughout endocytic recovery. In support of this suggestion, the photobleaching experiments of Figure 7 show that after closure, fusion pore reopening is a rare event. When correlated with granule content, it is clear that fusion pore closure is associated with low levels of chymotrypsinogen, again supporting the view that pore closure is the terminal event in exocytosis. Although these data do not exclude the possibility that some granules collapse, it does indicate a new form of granule behavior. This proposed sequence of events—opening of the fusion pore, loss of content, and then fusion pore closure followed by a piecemeal recovery of granule membrane—is remarkably similar to the process of trichocyst exocytosis in Paramecium, suggesting either conservation or parallel evolution of a mechanism that operates in a simple single-cell animal through to eukaryotes (Plattner et al., 1985).
Our previous work indicates that much of the granule content is lost quickly (Thorn and Parker, 2005). We now show that, at 5 min after stimulation, granules with an open fusion pore still have ∼50% of their content remaining (Figure 8). After fusion pore closure significantly less granule content is present, but still 10% of chymotrypsinogen remains. This value is consistent with observations showing that heterologously expressed granule content proteins can still be seen after fusion pore closure (Perrais et al., 2004; Obermuller et al., 2005). Perhaps of more physiological relevance is the finding that native proteins can also be found in the granules of lactotrophs (Bauer et al., 2004) after exocytosis and recapture. What the benefit of partial content release might be is unclear. In lactotrophs, it has been speculated that retrieved exocytosed granules may use residual prolactin to seed the development or maturation of new granules at the Golgi complex (Bauer et al., 2004). Indeed, there is a study in acinar cells, suggesting that zymogens are recovered by the cell and recycled in further rounds of secretion (Romagnoli and Herzog, 1987), a process that is likely to involve the Golgi complex.
In conclusion, the data presented point to a new model for exocytosis in acinar cells that is not consistent with the classical model of simple fusion pore dilation and granule collapse. Instead, we observe fusion pore closure, and we provide evidence that this is a prelude to endocytosis. Further work will be essential to understand secretion in these cells and the regulatory mechanisms controlling fusion pore behavior.
ACKNOWLEDGMENTS
We thank Ian Parker for help in building the two-photon microscope. This work was funded by a Wellcome Trust Overseas Fellowship (to O.L.) and Medical Research Council (United Kingdom) project grants G0000214 and G0400669, Australian Research Council grant DP0771481, and a Research Infrastructure Block grant from The University of Queensland (to P.T.). J.P. was supported by a Biotechnology and Biological Sciences Research Council studentship.
Abbreviations used:
- ACh
acetylcholine.
Footnotes
This article was published online ahead of print in MBC in Press (http://www.molbiolcell.org/cgi/doi/10.1091/mbc.E07-01-0024) on June 27, 2007.
REFERENCES
- Albillos A., Dernick G., Horstmann H., Almers W., Alvarez de Toledo G., Lindau M. The exocytotic event in chromaffin cells revealed by patch amperometry. Nature. 1997;389:509–512. doi: 10.1038/39081. [DOI] [PubMed] [Google Scholar]
- Alés E., Tabares L., Poyato J. M., Valero V., Lindau M., Alvarez de Toledo G. High calcium concentrations shift the mode of exocytosis to the kiss-and-run mechanism. Nat. Cell. Biol. 1999;1:40–44. doi: 10.1038/9012. [DOI] [PubMed] [Google Scholar]
- Alvarez de Toledo G., Fernández-Chacón R., Fernández J. M. Release of secretory products during transient vesicle fusion. Nature. 1993;363:554–558. doi: 10.1038/363554a0. [DOI] [PubMed] [Google Scholar]
- Archer D. A., Graham M. E., Burgoyne R. D. Complexin regulates the closure of the fusion pore during regulated vesicle exocytosis. J. Biol. Chem. 2002;277:18249–18252. doi: 10.1074/jbc.C200166200. [DOI] [PubMed] [Google Scholar]
- Bauer R. A., Overlease R. L., Lieber J. L., Angleson J. K. Retention and stimulus-dependent recycling of dense core vesicle content in neuroendocrine cells. J. Cell. Sci. 2004;117:2193–2202. doi: 10.1242/jcs.01093. [DOI] [PubMed] [Google Scholar]
- Ceccarelli B., Hurlbut W. P., Mauro A. Depletion of vesicles from frog neuromuscular junctions by prolonged tetanic stimulation. J. Cell. Biol. 1972;54:30–38. doi: 10.1083/jcb.54.1.30. [DOI] [PMC free article] [PubMed] [Google Scholar]
- Cho S.-J., Cho J., Jena B. The number of secretory vesicles remains unchanged following exocytosis. Cell Biol. Int. 2002;26:29–33. doi: 10.1006/cbir.2001.0848. [DOI] [PubMed] [Google Scholar]
- Curran M. J., Cohen F. S., Chandler D. E., Munson P. J., Zimmerberg J. Exocytotic fusion pores exhibit semi-stable states. J. Membr. Biol. 1993;133:61–75. doi: 10.1007/BF00231878. [DOI] [PubMed] [Google Scholar]
- Fernandez J. M., Neher E., Gomperts B. D. Capactiance measurements reveal stepwise fusion events in degranulating mast cells. Nature. 1984;312:453–455. doi: 10.1038/312453a0. [DOI] [PubMed] [Google Scholar]
- Graham M. E., O'Callaghan D. W., McMahon H. T., Burgoyne R. D. Dynamin-dependent and dynamin-independent processes contribute to the regulation of single vesicle release kinetics and quantal size. Proc. Natl. Acad. Sci. USA. 2002;99:7124–7129. doi: 10.1073/pnas.102645099. [DOI] [PMC free article] [PubMed] [Google Scholar]
- Haller T., Dietl P., Pfaller K., Frick M., Mair N., Paulmichl M., Hess M. W., Furst J., Maly K. Fusion pore expansion is a slow, discontinuous, and Ca2+-dependent process regulating secretion from alveolar type II cells. J. Cell. Biol. 2001;155:279–289. doi: 10.1083/jcb.200102106. [DOI] [PMC free article] [PubMed] [Google Scholar]
- Heuser J. E., Reese T. S. Evidence for recycling of synaptic vesicle membrane during transmitter release at frog neuromuscular junction. J. Cell. Biol. 1973;57:315–344. doi: 10.1083/jcb.57.2.315. [DOI] [PMC free article] [PubMed] [Google Scholar]
- Holroyd P., Lang T., Wenzel D., De Camilli P., Jahn R. Imaging direct, dynamin-dependent recapture of fusing secretory granules on plasma membrane lawns from PC12 cells. Proc. Natl. Acad. Sci. USA. 2002;99:16806–16811. doi: 10.1073/pnas.222677399. [DOI] [PMC free article] [PubMed] [Google Scholar]
- Jerdeva G. V., Wu K., Yarber F. A., Rhodes C. J., Kalman D., Schechter J. E., Hamm-Alvarez S. F. Actin and non-muscle myosin II facilitate apical exocytosis of tear proteins in rabbit lacrimal acinar epithelial cells. J. Cell. Sci. 2005;118:4797–4812. doi: 10.1242/jcs.02573. [DOI] [PMC free article] [PubMed] [Google Scholar]
- Launikonis B. S., Stephenson D. G. Tubular system volume changes in twitch fibres from toad and rat skeletal muscle assessed by confocal microscopy. J. Physiol. 2002;538:607–618. doi: 10.1113/jphysiol.2001.012920. [DOI] [PMC free article] [PubMed] [Google Scholar]
- Luff A. R., Atwood H. L. Changes in the sarcoplasmic reticulum and transverse tubular system of fast and slow skeletal muscles of the mouse during postnatal development. J. Cell Biol. 1971;51:369–383. doi: 10.1083/jcb.51.2.369. [DOI] [PMC free article] [PubMed] [Google Scholar]
- Melikyan G. B., Niles W. D., Ratinov V. A., Karhanek M., Zimmerberg J., Cohen F. S. Comparison of transient and successful fusion pores connecting influenza hemagglutinin expressing cells to planar membranes. J. Gen. Physiol. 1995;106:803–819. doi: 10.1085/jgp.106.5.803. [DOI] [PMC free article] [PubMed] [Google Scholar]
- Mohler W. A., Simske J. S., Williams-Masson E. M., Hardin J. D., White J. G. Dynamics and ultrastructure of developmental cell fusions in the Caenorhabditis elegans hypodermis. Curr. Biol. 1998;8:1087–1090. doi: 10.1016/s0960-9822(98)70447-6. [DOI] [PubMed] [Google Scholar]
- Neco P., Giner D., Viniegra S., Borgesi R., Villarroel A., Gutierrez L. M. New roles of myosin II during vesicle transport and fusion in chromaffin cells. J. Biol. Chem. 2004;279:27450–27457. doi: 10.1074/jbc.M311462200. [DOI] [PubMed] [Google Scholar]
- Nemoto T., Kimura R., Ito K., Tachikawa A., Miyashita Y., Iino M., Kasai H. Sequential-replenishment mechanism of exocytosis in pancreatic acini. Nat Cell. Biol. 2001;3:253–258. doi: 10.1038/35060042. [DOI] [PubMed] [Google Scholar]
- Nemoto T., Kojima T., Oshima A., Bito H., Kasai H. Stabilization of exocytosis by dynamic F-actin coating of zymogen granules in pancreatic acini. J. Biol. Chem. 2004;279:37544–37550. doi: 10.1074/jbc.M403976200. [DOI] [PubMed] [Google Scholar]
- Obermuller S., Lindqvist A., Karanauskaite J., Galvanovkis J., Rorsman P., Barg S. Selective nucleotide-release from dense-core granules in insulin-secreting cells. J. Cell Sci. 2005;118:4271–4282. doi: 10.1242/jcs.02549. [DOI] [PubMed] [Google Scholar]
- Palade G. Intracellular aspects of process of protein-synthesis. Science. 1975;189:347–368. doi: 10.1126/science.1096303. [DOI] [PubMed] [Google Scholar]
- Perrais D., Kleppe I. C., Taraska J. W., Almers W. Recapture after exocytosis causes differential retention of protein in granules of bovine chromaffin cells. J. Physiol. 2004;560:413–428. doi: 10.1113/jphysiol.2004.064410. [DOI] [PMC free article] [PubMed] [Google Scholar]
- Pickett J. A., Thorn P., Edwardson J. M. The plasma membrane Q-SNARE syntaxin 2 enters the zymogen granule membrane during exocytosis in the pancreatic acinar cell. J. Biol. Chem. 2005;280:1506–1511. doi: 10.1074/jbc.M411967200. [DOI] [PubMed] [Google Scholar]
- Plattner H., Pape R., Haacke B., Olbricht K., Westphal C., Kersken H. Synchronous exocytosis in paramecium-cells. 6. Ultrastructural analysis of membrane resealing and retrieval. J. Cell. Sci. 1985;77:1–17. doi: 10.1242/jcs.77.1.1. [DOI] [PubMed] [Google Scholar]
- Romagnoli P., Herzog V. Reinternalization of secretory proteins during membrane recycling in rat pancreatic acinar-cells. Eur. J. Cell. Biol. 1987;44:167–175. [PubMed] [Google Scholar]
- Schneider S. W., Sritharan K. C., Geibel J. P., Oberleithner H., Jena B. P. Plasma membrane structures involved in exocytosis, observation by the atomic force microscope. Proc. Natl. Acad. Sci. USA. 1997;94:316–321. doi: 10.1073/pnas.94.1.316. [DOI] [PMC free article] [PubMed] [Google Scholar]
- Sokac A. M., Bement W. M. Kiss-and-coat and compartment mixing, Coupling exocytosis to signal generation and local actin assembly. Mol. Biol. Cell. 2006;17:1495–1502. doi: 10.1091/mbc.E05-10-0908. [DOI] [PMC free article] [PubMed] [Google Scholar]
- Spruce A. E., Breckenridge L. J., Lee A. K., Almers W. Properties of the fusion pore that forms during exocytosis of a mast-cell secretory vesicle. Neuron. 1990;4:642–654. doi: 10.1016/0896-6273(90)90192-i. [DOI] [PubMed] [Google Scholar]
- Taraska J. W., Perrais D., Ohara-Imaizumi M., Nagamatsu S., Almers W. Secretory granules are recaptured largely intact after stimulated exocytosis in cultured endocrine cells. Proc. Natl. Acad. Sci. USA. 2003;100:2070–2075. doi: 10.1073/pnas.0337526100. [DOI] [PMC free article] [PubMed] [Google Scholar]
- Thorn P., Parker I. Two phases of zymogen granule lifetime in mouse pancreas, ghost granules linger after exocytosis of contents. J. Physiol. 2005;563:433–442. doi: 10.1113/jphysiol.2004.077230. [DOI] [PMC free article] [PubMed] [Google Scholar]
- Thorn P., Fogarty K. E., Parker I. Zymogen granule exocytosis is characterized by long fusion pore openings and preservation of vesicle lipid identity. Proc. Natl. Acad. Sci. USA. 2004;101:6774–6779. doi: 10.1073/pnas.0400336101. [DOI] [PMC free article] [PubMed] [Google Scholar]
- Thorn P., Lawrie A. M., Smith P. M., Gallacher D. V., Petersen O. H. Local and global cytosolic Ca2+ oscillations in exocrine cells evoked by agonists and inositol trisphosphate. Cell. 1993;74:661–668. doi: 10.1016/0092-8674(93)90513-p. [DOI] [PubMed] [Google Scholar]
- Tsuboi T., McMahon H. T., Rutter G. A. Mechanisms of dense core vesicle recapture following “kiss and run” (“cavicapture”) exocytosis in insulin-secreting cells. J. Biol. Chem. 2004;279:47115–47124. doi: 10.1074/jbc.M408179200. [DOI] [PubMed] [Google Scholar]
- Turvey M., Thorn P. Lysine-fixable dye tracing of exocytosis shows F-actin coating is a step that follows granule fusion in pancreatic acinar cells. Pflügers Archiv. 2004;448:552–555. doi: 10.1007/s00424-004-1288-z. [DOI] [PubMed] [Google Scholar]
- Valentijn J. A., Valentijn K., Pastore L. M., Jamieson J. D. Actin coating of secretory granules during regulated exocytosis correlates with the release of rab3D. Proc. Natl. Acad. Sci. USA. 2000;97:1091–1095. doi: 10.1073/pnas.97.3.1091. [DOI] [PMC free article] [PubMed] [Google Scholar]
- Venturoli D., Rippe B. Ficoll and dextran vs. globular proteins as probes for testing glomerular permselectivity: effects of molecular size, shape, charge, and deformability. Am. J. Physiol. 2005;288:F605–F613. doi: 10.1152/ajprenal.00171.2004. [DOI] [PubMed] [Google Scholar]
- Wang C-T., Grishanin R., Earles C. A., Chang P. Y., Martin T.F.J., Chapman E. R., Jackson M. B. Synaptotagmin modulation of fusion pore kinetics in regulated exocytosis of dense-core vesicles. Science. 2001;294:1111–1115. doi: 10.1126/science.1064002. [DOI] [PubMed] [Google Scholar]
- Wang C-T., Lu J. C., Bai J., Martin T.F.J., Chapman E. R., Jackson M. B. Different domains of synaptotagmin control the choice between kiss-and-run and full fusion. Nature. 2003;424:943–947. doi: 10.1038/nature01857. [DOI] [PubMed] [Google Scholar]
- Zimmerberg J., Curran M., Cohen F. S., Brodwick M. Simultaneous electrical and optical measurements show that membrane-fusion precedes secretory granule swelling during exocytosis of beige mouse mast-cells. Proc. Natl. Acad. Sci. USA. 1987;84:1585–1589. doi: 10.1073/pnas.84.6.1585. [DOI] [PMC free article] [PubMed] [Google Scholar]


