

Abstract
Hypothesis
A cortisol response to adrenocorticotropin injection is the standard test for diagnosing adrenal insufficiency. Multiple steroid hormones can now be accurately measured by tandem mass spectrometry in a single sample. The study objective was to determine whether a steroid profile, created by simultaneous measurement of ten steroid hormones by tandem mass spectrometry, would help determine the cause of adrenal insufficiency.
Design
A ten-steroid profile was measured by tandem mass spectrometry during the performance of a standard high dose cortrosyn stimulation test. The steroids were measured at baseline, and 30 and 60 minutes following synthetic adrenocorticotropin injection. Adrenal insufficiency was defined as a peak cortisol level of less than 20 μg/dL. Testing was conducted in the General Clinical Research Center of a University Medical Center. Normal volunteers, patients suspected of having adrenal insufficiency, and patients with known adrenal insufficiency participated.
Results
Our results showed that adrenal insufficiency of any cause was adequately diagnosed using the response of 11-deoxycortisol, dehydroepiandrosterone, or these analytes combined in a two-steroid profile. A three-steroid profile yielded a test with 100% accuracy for discriminating primary adrenal insufficiency from normal status. Primary adrenal insufficiency was well separated from secondary adrenal insufficiency using only a single aldosterone value. 11-deoxycortisol, dehydroepiandrosterone, and a two-steroid profile each provided fair discrimination between secondary adrenal insufficiency and normal status.
Conclusions
We conclude that stimulated levels of aldosterone, 11-deoxycortisol, dehydroepiandrosterone, and a two- or three-steroid profile provided additional discrimination between states of adrenal sufficiency and insufficiency. It is proposed that a steroid profile measuring cortisol, aldosterone, 11-deoxycortisol, and dehydroepiandrosterone would potentially improve the ability to determine the cause of adrenal insufficiency.
Key terms: adrenal insufficiency, steroid profile, tandem mass spectrometry
INTRODUCTION
A deficient steroid hormone response to adrenocorticotropin (ACTH) is a hallmark of adrenal insufficiency (AI) (1). Measurement of serum cortisol levels following synthetic ACTH injection forms the traditional “gold standard” for diagnosing AI (1–3). A decreased cortisol response is seen in both primary and chronic secondary AI (4), and diagnostic “cut-off” values of between 18–20 μg/dL are well-documented (2, 3, 5–14). Aldosterone levels after ACTH stimulation can be helpful to distinguish between primary and secondary AI. Despite the wealth of data regarding ACTH-stimulated cortisol levels, studies of aldosterone responses to ACTH stimulation in normal and adrenally insufficient subjects are few (9, 12, 15). Thus, the stimulated aldosterone level appropriate for distinguishing between primary and secondary adrenal insufficiency is uncertain.
There has been interest in using the levels of steroids other than cortisol and aldosterone to discriminate normal adrenal function from AI, particularly in situations where the cause of AI cannot readily be established. These steroid hormones include 11-deoxycortisol (7, 13), 17-hydroxyprogesterone (16), progesterone, androstenedione, dehydroepiandrosterone (DHEA) (16), and dehydroepiandrosterone-sulfate (DHEA-S) (17, 18). However, responses of these other steroid hormones to ACTH stimulation have not been frequently studied.
Immunoassay is a sensitive method for measuring steroid hormones (19). However, testing programs show lack of specificity in the commercially available immunoassays (20, 21). Tandem mass spectrometry (MS/MS) has been shown to have better specificity than immunoassay (22), and has been used to measure cortisol during an ACTH stimulation test (23). We developed a method to simultaneously measure nine steroid hormones by atmospheric pressure photoionization ion source MS/MS and have shown this method to be highly specific and sensitive (24, 25). These nine hormones are cortisol, 11-deoxycortisol 17-hydroxyprogesterone, progesterone, androstenedione, DHEA, DHEA-S, estradiol, and testosterone. An additional refinement allows simultaneous of twelve steroids including aldosterone (26).
In this study we measured ten adrenal hormones in normal subjects and subjects with AI. The first study aim was to assess whether any steroids other than cortisol increased significantly in response to an ACTH stimulus. The second study aim was to determine the correlation between peak cortisol levels and the peak levels of other steroids. We were interested in whether a profile combining some of the other correlating steroids would also be helpful in determining the cause of AI, or in making a diagnosis of AI, particularly in borderline or clinically difficult cases. The final study aim was to generate additional data regarding aldosterone values in normal subjects and subjects with AI.
An additional topic that is not examined in this analysis, but that is being addressed in a separate manuscript is the performance of cortisol immunoassays compared with MS/MS assays. This analysis examines the issue of whether patients are differently classified with respect to their adrenal status using the two assays and a cortisol cut-off of 20 μg/dL or above. This will allow validation of MS/MS assays and their comparison with existing “gold standard” methods.
METHODS
Subjects and Protocol
Normal volunteers, patients suspected of being adrenally insufficient who required an ACTH stimulation test for routine clinical evaluation, and patients with known adrenal insufficiency were recruited. The study protocol was approved by the Institutional Review Board. Normal subjects who were pregnant or breast-feeding, and patients with diabetes were excluded from participation. Following informed consent, subjects underwent a standard high-dose ACTH stimulation test performed on an outpatient basis in the General Clinical Research Center. Patients were in a seated position and rested for at least 10 minutes before testing began. A 23-gauge indwelling catheter was inserted and a baseline blood sample was drawn. Following injection of 250 μg Cortrosyn™ blood samples were taken at 30 and 60 minutes. Blood pressure and heart rate were measured before and after testing. A medication history was taken and only patients with known AI were taking steroid-containing medications. On the test day patients with known AI delayed their glucocorticoid and mineralocorticoid replacement until testing was complete. Information regarding dietary salt intake was not collected.
Laboratory Measurements
At all three time points ten steroids were analyzed by MS/MS as previously described (24–26). Serum samples were deproteinized and injected onto the column after centrifugation. Chromatographic separation was carried out on a reverse phase C-18 (25) or C-8 (26) analytic column. Samples were washed online and eluted using a methanol/water gradient and introduced into the mass spectrometer. The current assay protocol (26) separates the total ion chromatogram into four sections in order to optimize parameters for each individual analyte. Atmospheric pressure photoionization was used to measure nine of the steroids in the positive ion mode; aldosterone was measured in the negative mode. The method is based on isotope dilution and is specific for the steroid of interest. Aldosterone was analyzed after adding an aliquot of cortisol to prevent precipitation of aldosterone with cortisol-binding globulin. There was less interference with neighboring peaks when aldosterone was separated from other steroids in the negative ion mode in a separate time period. This assay has no cross-reactivity with fludrocortisone. The API-3000 or API-5000 mass spectrometer was used for all assays. Our first generation steroid profile assay required 760 μL of serum and measured 9 steroids in 18 minutes (25). Our second generation assay uses 200 μL of serum and measures 12 steroids in 11 minutes (26). Assay accuracy was evaluated in two ways. The assays were compared with MS/MS assays performed at the Mayo Clinic: correlation coefficients ranged from 0.908 to 0.999 (26). Recovery studies were also performed and yielded mean recoveries of the analytes of 90% to 110% (26).
Patients suspected of having AI also had cortisol levels determined by immunoassay in a clinical laboratory; these results were used to guide clinical decision-making. However, for the purposes of this analysis a peak cortisol concentration of 20 μg/dL or above determined by MS/MS (at any of the three time points) was interpreted as normal adrenal function. Failure to achieve a peak cortisol value of 20 μg/dL was deemed AI.
Designation of Adrenal Status
The peak steroid level was defined as the maximum value following ACTH injection. Delta values were defined as the difference between the baseline value and either the 30-minute value, the 60-minute value, or the peak value following ACTH injection. Subjects were initially grouped into three categories (see Table 1a). The first group was normal subjects without any clinical suspicion of AI. The second group was comprised of subjects suspected of having AI, whose ACTH stimulation test was performed as standard of care, but whose peak cortisol values were 20 ug/dL or above as measured by MS/MS. These subjects were classified as having normal adrenal function. The third group consisted of subjects having their ACTH stimulation test performed because of clinical suspicion of AI, whose peak cortisol was less than 20 μg/dL as measured by MS/MS. These subjects were thus designated as having AI. Also included in this group were several patients with known AI who volunteered for the study. Subjects with AI were designated as having either primary or secondary AI. Clinical assessment, laboratory data, and chart review were used to determine whether the patient’s site of adrenal axis dysfunction was primary or secondary (see Table 1b).
Table 1a.
Groups of subjects studied
| STUDY SUBJECTS | ||||||
|---|---|---|---|---|---|---|
| Number of patients | Sex | Age (years) | Patient type | Outcome of cortisol measurements | Designation | |
| Group 1 | 21 | 57% F | 33 ± 9 | No suspicion AI | ≥ 20 μg/dL by MS/MS | Normal |
| Group 2 | 40 | 64% F | 46 ± 15 | AI suspected | ≥ 20 μg/dL by MS/MS | Normal |
| Group 3 | 19 | 50% F | 46 ± 13 | AI suspected (4 patients with known AI) | < 20 μg/dL by MS/MS | AI |
Table 1b.
Characteristics used to assign a diagnosis of primary or secondary AI
| Subject number | CLINICAL DATA | Assigned Diagnosis | |||||
|---|---|---|---|---|---|---|---|
| ACTH levels | Known glucocorticoid use | Known pituitary pathology | Known adrenal pathology | Risk factors for adrenal pathology | Fludrocortisone treatment | ||
| 1 | ND | Yes | No | 2° AI | |||
| 2 | ND | Pit Adenoma | No | 2° AI | |||
| 3 | low | Yes | No | 2° AI | |||
| 4 | ND | Sellar Tumor | No | 2° AI | |||
| 5 | low | Yes | No | No | 2° AI | ||
| 6 | ND | Sellar Tumor | No | 2° AI | |||
| 7 | low | Yes | No | No | 2° AI | ||
| 8 | low | Pit Adenoma | No | 2° AI | |||
| 9 | low | Autoimmune | No | 2° AI | |||
| 10 | ND | Sheehan’s | No | 2° AI | |||
| 11 | ND | Pit Adenoma | No | 2° AI | |||
| 12 | low | Yes | No | No | 2° AI | ||
| 13 | High | Yes | Yes | 1° AI | |||
| 14 | High | Yes | Yes | 1° AI | |||
| 15 | High | Yes | Yes | 1° AI | |||
| 16 | High | Yes | Yes | 1° AI | |||
| 17 | High | Yes | Yes | 1° AI | |||
| 18 | High | Yes | Yes | 1° AI | |||
| 19 | ND | Yes | Yes | 1° AI | |||
ND= not done, Pit. Adenoma= Pituitary Adenoma
Statistical Analysis
A student t-test was performed to evaluate statistically significant differences in the peak hormone levels by MS/MS between the normal volunteers and the normal standard of care subjects. The same comparison was performed to determine if there was any difference in the steroid peaks achieved in subjects with secondary AI versus subjects with primary AI. Paired t-tests were also performed for each steroid hormone comparing the baseline, 30-minute, 60-minute, and peak values to determine if there was a statistically significant increase in each steroid hormone following ACTH stimulation in all subjects. A p value of < 0.05 was considered significant. In addition, two sample comparisons using a Mann-Whitney approach were also performed. No differences in results were found using the non-parametric approach and so the more powerful t-test results are presented. The results of steroid responses to ACTH injection were also displayed in a non-inferential manner using box plots.
The peak cortisol values were plotted against peak values for the other steroids for each subject. The steroids that correlated best with serum cortisol were used in further non-inferential analysis. Using available data, four cut-off values were selected for aldosterone, 11-deoxycortisol, and DHEA that appeared to discriminate between the four categories of 1) any AI versus normal, 2) primary AI versus normal, 3) primary versus secondary AI, and 4) secondary AI versus normal. For the case of primary versus secondary AI, because a cortisol value of < 20 μg/dL has no value in distinguishing between these states, additional lower cortisol cut-off values that might serve this purpose were also selected. These cut-offs were used to generate receiver operating characteristic curves for the four different screening tests. The one cut-off value for each steroid that gave the best results in all four tests was then tabulated to illustrate its overall performance in each screening test. The sensitivity, specificity, positive predictive value, and negative predictive value of each selected steroid cut-off were calculated.
RESULTS
Subjects
ACTH stimulation tests were performed in eighty subjects (see Table 1a). There were no adverse events, other than transient flushing and light-headedness in a few subjects. Vital signs did not change significantly during testing. Twenty-one subjects were volunteers not suspected of having adrenal dysfunction. These individuals had normal cortisol responses to ACTH stimulation. Fifty-five patients were suspected of having AI. Of these patients receiving standard of care clinical evaluation, 40 (73%) were determined to have normal adrenal function and 15 (27%) were diagnosed with AI. The four volunteers with known AI had inadequate cortisol responses to ACTH.
Steroid hormone responses following ACTH stimulation in normal subjects
There were a total of 61 subjects in the combined group with normal adrenal function. The mean peak steroid hormone levels of the normal subjects and the subjects undergoing standard of care testing who had normal results were not significantly different (data not shown), except for higher DHEA (p = 0.001) and DHEA-S (p < 0.001) values in the normal volunteers (Table 2a). These differences were suspected to be due to their younger mean age (33 years compared with 46 years). Therefore, all normal subjects were combined in subsequent analyses. Table 2a shows the steroid responses of the combined group reported as mean and standard error. P values indicate significant increases in the steroid between baseline and peak.
Table 2a.
Steroid levels by MS/MS after ACTH stimulation in normal subjects (males and females combined)
| Steroid leve l0 mins | Steroid level 30 mins | Steroid level 60 mins | Steroid Peak (maximum response to ACTH stimulation) | Increase Significant (0 mins to Peak) | |
|---|---|---|---|---|---|
| Cortisol (μg/dL) | |||||
| combined | 11.50 ± 5.38 | 26.57 ± 6.17 | 31.07 ± 7.85 | 31.13 ± 7.75 | p < 0.001 |
| Aldosterone (ng/dL) | |||||
| combined | 4.57 ± 3.56 | 12.04 ± 7.25 | 9.53 ± 5.58 | 12.52 ± 7.12 | p < 0.001 |
| 11-deoxycortisol (ng/dL) | |||||
| combined | 79 ± 113 | 571 ± 263 | 670 ± 290 | 676 ± 286 | p < 0.001 |
| DHEA (ng/dL) | |||||
| normal | 329 ± 399 | 727 ± 410 | 810 ± 420 | 823 ± 416 | p < 0.001 |
| normal standard of care | 145 ± 196 | 376 ± 333 | 419 ± 367 | 432 ± 366 | |
| combined | 209 ± 296 | 496 ± 398 | 553 ± 429 | 567 ± 427 | |
| 17-OH progesterone (ng/dL) | |||||
| combined | 47 ± 53 | 150 ± 142 | 162 ± 163 | 167 ± 162 | p < 0.001 |
| Androstenedione (ng/mL) | |||||
| combined | 0.43 ± 0.41 | 0.75 ± 0.50 | 0.78 ± 0.50 | 0.82 ± 0.50 | p < 0.001 |
| DHEA-S (μg/dL) | |||||
| normal | 248 ± 180 | 262 ± 183 | 273 ± 180 | 281 ± 188 | p < 0.001 |
| normal standard of care | 67 ± 66 | 62 ± 59 | 72 ± 67 | 75 ± 68 | |
| combined | 129 ± 146 | 131 ± 151 | 141 ± 152 | 146 ± 157 |
There were statistically significant increases in levels of cortisol, aldosterone, 11-deoxycortisol, DHEA, 17-hydroxyprogesterone, androstenedione, and DHEA-S following ACTH stimulation in normal subjects. Absolute values are shown in Table 2a, and the mean, median and distribution of the data are displayed as box plots in Figure 1. The changes in each steroid from the baseline to the 30-minute, 60-minute, and peak values are shown in Table 3a. The relationship between the age of all subjects and their DHEA-S values is shown in Figure 1h.
Figure 1.
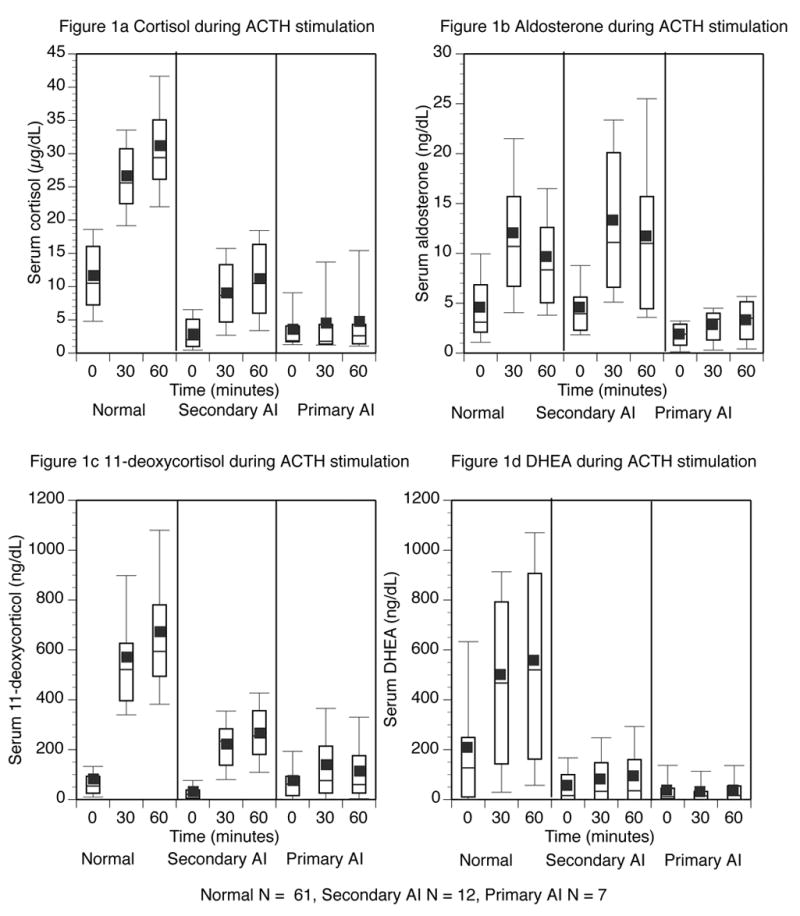
Steroid levels before, and 30 and 60 minutes after ACTH injection. Normal subjects are shown on the left panel, subjects with secondary AI in the middle panel, and those with primary AI in the right panel. The top and bottom of the box represent the 75th and 25th percentile. The line through the middle of the box and the square correspond to the 50th percentile (median) and mean respectively. The whiskers on the top and bottom of the box extend to the 90th and 10th percentile.
Table 3.
Characteristics of Steroid “Deltas” and Peaks
| 3a Delta Values following ACTH stimulation (difference between baseline steroid value and value at peak*, difference between baseline and 30 minute value**, difference between baseline and 60 minute value***) | ||
|---|---|---|
| STEROID | Normal subjects | Subjects with AI |
| Peak Delta* (mean ± SE) | Peak Delta* (mean ± SE) | |
| Cortisol (μg/dL) | 19.6 ± 6.6 | 5.7 ± 4.5 |
| Aldosterone (ng/dL) | 7.8 ± 5.5 | 6.4 ± 5.5 |
| 11-deoxycortisol (ng/dL) | 579.5 ± 264.8 | 177.2 ± 127.0 |
| DHEA (μg/dL) | 358.4 ± 260.8 | 43.4 ± 69.5 |
| 17-hydroxyprogesterone (ng/dL) | 119.8 ± 157.6 | 88.4 ± 124.5 |
| Androstenedione (ng/mL) | 0.4 ± 0.3 | 0.1 ± 0.2 |
| DHEA-S (μg/dL) | 17.0 ± 22.6 | 7.7 ± 12.1 |
| 30 minute Delta** (mean ± SE) | 30 minute Delta** (mean ± SE) | |
| Cortisol (μg/dL) | 15.1 ± 4.9 | 4.2 ± 3.8 |
| Aldosterone (ng/dL) | 7.3 ± 5.7 | 5.8 ± 5.9 |
| 11-deoxycortisol (ng/dL) | 492.5 ± 245.7 | 143.6 ± 107.6 |
| DHEA (μg/dL) | 287.7 ± 226.7 | 10.0 ± 57.1 |
| 60 minute Delta*** (mean ± SE) | 60 minute Delta*** (mean ± SE) | |
| Cortisol (μg/dL) | 19.6 ± 6.6 | 5.6 ± 4.9 |
| Aldosterone (ng/dL) | 4.8 ± 4.5 | 4.9 ± 5.8 |
| 11-deoxycortisol (ng/dL) | 591.5 ± 268.4 | 164.0 ± 131.3 |
| DHEA (μg/dL) | 344.6 ± 262.6 | 21.2 ± 103.7 |
| 3b Distribution of Steroid Peaks following ACTH injection in normal subjects | ||
| STEROID | Peak at 30 minutes (%) | Peak at 60 minutes (%) |
| Cortisol | 2 | 98 |
| Aldosterone | 73 | 27 |
| 11-deoxycortisol | 15 | 85 |
| DHEA | 28 | 72 |
| 17-hydroxyprogesterone | 36 | 64 |
| Androstenedione | 36 | 64 |
| DHEA-S | 23 | 77 |
| 3c Correlation between peak cortisol values and peak values of other steroids | ||
| STEROID | Correlation coefficient using all subjects | Correlation coefficient for subjects excluding secondary AI |
| Aldosterone | 0.19 | 0.37 |
| 11-deoxycortisol | 0.67 | 0.59 |
| DHEA | 0.48 | 0.38 |
| 17-hydroxyprogesterone | 0.26 | 0.25 |
| Androstenedione | 0.41 | 0.37 |
| DHEA-S | 0.33 | 0.18 |
As can be seen from the box plots and Table 3b, most steroids reached a peak value at 60 minutes after ACTH injection. This pattern was most pronounced for cortisol with its peak occurring at 60 minutes in 60 of the 61 patients. However, aldosterone (Figure 1b) clearly had a different pattern of response, with the peak value being seen at 30 minutes in the majority (73%) of patients. Furthermore, the decline from the 30-minute to the 60-minute value was statistically significant (p < 0.001). The peak 11-deoxycortisol and DHEA values occurred at 60 minutes in 85% and 72% of patients respectively. The timing of the peaks for the remainder of the steroids is also shown in Table 3b.
Steroid hormone responses following ACTH stimulation in subjects with AI
The mean steroid levels during ACTH stimulation in the patients with AI are shown as absolute values in Table 2b. The peak steroid responses to ACTH stimulation were statistically different in patients with primary AI compared with those with secondary AI for cortisol, aldosterone and 11-deoxycortisol. However, the responses of all other steroids did not differ between the two categories of AI. These steroid responses are graphically displayed as box plots, alongside similarly displayed data for normal subjects, in Figure 1.
Table 2b.
Steroid levels by MS/MS during ACTH stimulation in subjects with AI (males and females combined)
| Steroid level 0 mins | Steroid level 30 mins | Steroid level 60 mins | Steroid Peak (maximum response to ACTH stimulation) | Significant difference in Peak2 vs 1 | |
|---|---|---|---|---|---|
| cortisol (μg/dL) | |||||
| AI | 3.06 ± 2.56 | 7.24 ± 5.42 | 8.71 ± 6.46 | 8.80 ± 6.36 | |
| Secondary AI | 2.86 ± 2.28 | 8.96 ± 4.94 | 11.07 ± 5.7 | 11.07 ± 5.70 | p = 0.04 |
| Primary AI | 3.41 ± 3.10 | 4.30 ± 4.83 | 4.65 ± 5.16 | 4.90 ± 6.01 | |
| Aldosterone (ng/dL) | |||||
| AI | 3.53 ± 3.01 | 9.37 ± 7.65 | 8.61 ± 7.45 | 9.95 ± 7.94 | |
| Secondary AI | 4.53 ± 3.29 | 13.19 ± 7.20 | 11.75 ± 7.69 | 13.70 ± 7.72 | p = 0.004 |
| Primary AI | 1.82 ± 1.12 | 2.84 ± 1.73 | 3.24 ± 1.45 | 3.54 ± 1.87 | |
| 11-Deoxycortisol (ng/dL) | |||||
| AI | 45 ± 52 | 188 ± 117 | 208 ± 136 | 222 ± 132 | |
| Secondary AI | 29 ± 31 | 220 ± 94 | 265 ± 112 | 270 ± 110 | p = 0.039 |
| Primary AI | 71 ± 65 | 134 ± 132 | 111 ± 110 | 140 ± 123 | |
| DHEA (ng/dL) | |||||
| AI | 49 ± 67 | 59 ± 83 | 70 ± 105 | 92 ± 110 | |
| Secondary AI | 55 ± 74 | 76 ± 95 | 90 ± 122 | 111 ± 126 | p = 0.35 |
| Primary AI | 37 ± 53 | 29 ± 47 | 38 ± 47 | 60 ± 59 | |
| 17-OH progesterone (ng/dL) | |||||
| AI | 36 ± 41 | 85 ± 56 | 91 ± 65 | 124 ± 120 | |
| Secondary AI | 32 ± 31 | 93 ± 53 | 105 ± 69 | 149 ± 138 | p = 0.25 |
| Primary AI | 42 ± 52 | 71 ± 62 | 66 ± 50 | 81 ± 52 | |
| Androstenedione (ng/mL) | |||||
| AI | 0.30 ± 0.24 | 0.38 ± 0.33 | 0.32 ± 0.32 | 0.49 ± 0.37 | |
| Secondary AI | 0.32 ± 0.27 | 0.46 ± 0.38 | 0.38 ± 0.37 | 0.49 ± 0.37 | p = 0.26 |
| Primary AI | 0.26 ± 0.21 | 0.25 ± 0.16 | 0.21 ± 0.14 | 0.31 ± 0.15 | |
| DHEA-S (μg/dL) | |||||
| AI | 17 ± 25 | 20 ± 26 | 21 ± 20 | 25 ± 27 | |
| Secondary AI | 15 ± 16 | 19 ± 19 | 22 ± 20 | 25 ± 21 | p = 0.99 |
| Primary AI | 21 ± 30 | 22 ± 32 | 18 ± 20 | 25 ± 33 |
Correlation of peak cortisol levels with the peak values of other steroids
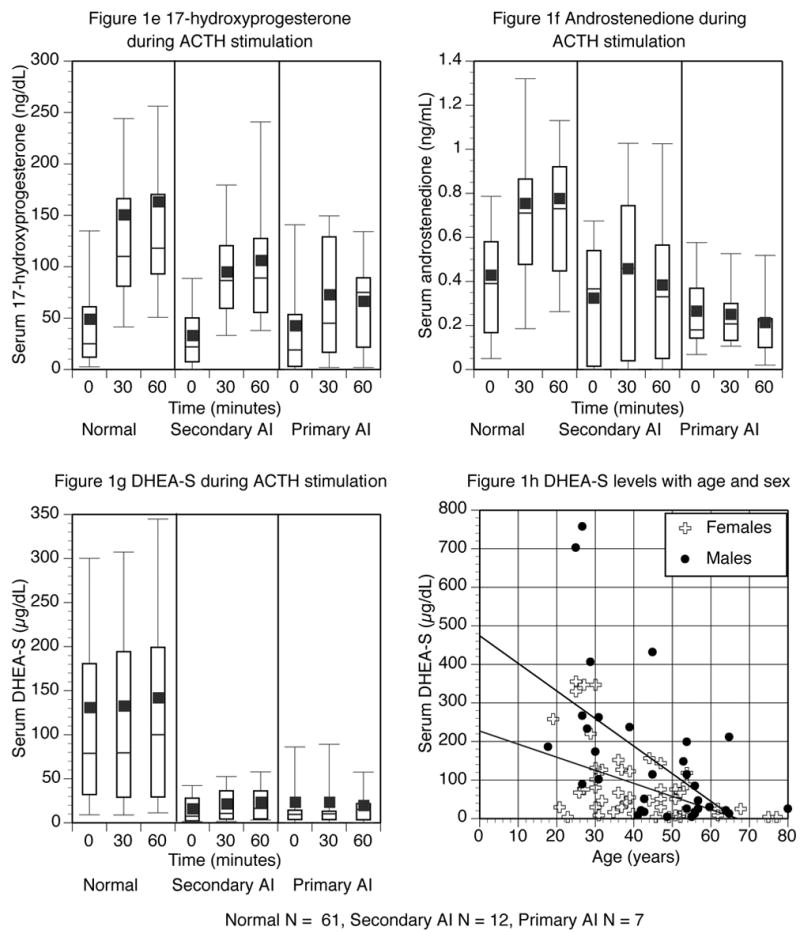
The correlation between the peak cortisol levels and the peak levels of the other steroids were determined (Table 3c). The correlation coefficient was initially calculated for all subjects. A second analysis excluded patients with secondary AI to determine if any steroid was helpful in discriminating between primary and secondary AI. Correlations for all patients across the disease states were poor. The best correlation was seen for 11-deoxycortisol; the second best for DHEA. Aldosterone was the only steroid with an improved correlation when subjects with secondary AI were excluded, although neither correlation was close. Results for aldosterone, 11-deoxycortisol and DHEA are graphically displayed in Figure 2. Each data point represents the peak levels of the two steroids for a particular patient.
Figure 2.
Peak cortisol levels on the x-axis plotted against other steroid levels on the y-axis
Diagnostic cut-off values
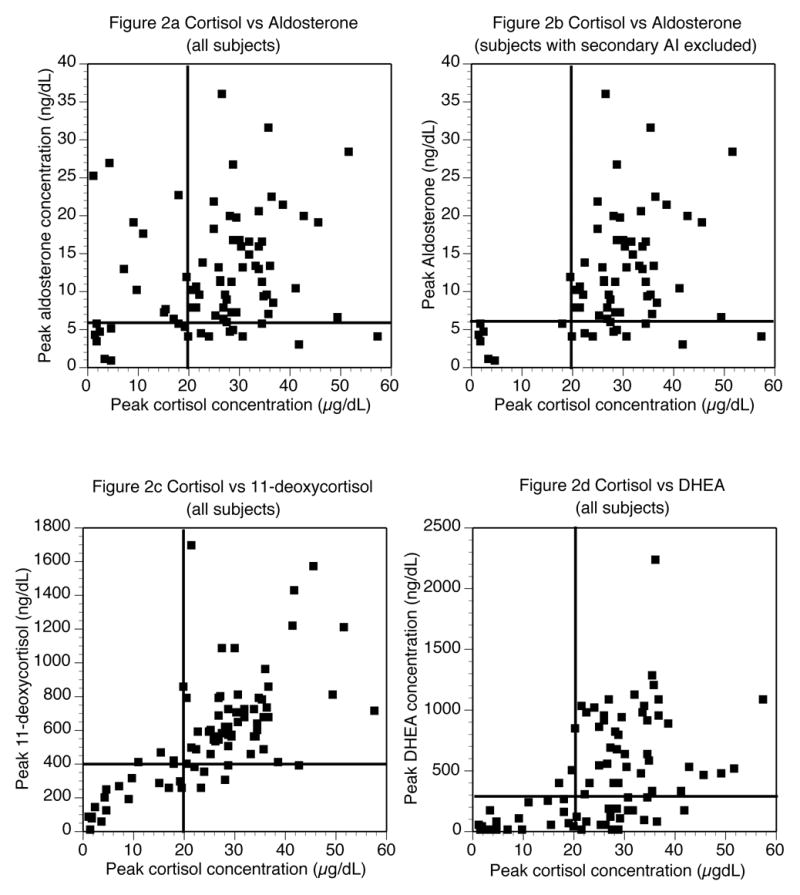
Figure 2 data were used to select steroid cut-off values to analyze further in receiver operating characteristic curves. The cut-offs selected were 4, 5, 6, and 7 ng/dL for aldosterone; 200, 300, 400, and 500 ng/dL for 11-deoxycortisol, and 100, 200, 300, and 400 ng/dL for DHEA. Because a cortisol cut-off of 20 μg/dL cannot differentiate between primary and secondary AI, additional cortisol cut-offs of 3, 4, 5, and 6 mcg/dL were selected for this purpose only. Receiver operating characteristic curves for these cut-offs for each of the previously described screening tests are shown in Figure 3. The screening tests analyzed were 1) any AI versus normal (shown in squares), 2) primary AI versus normal (shown in circles), 3) primary versus secondary AI (shown in diamonds), and 4) secondary AI versus normal (shown in triangles). As Figure 3 shows, the different cut-offs greatly affected the performance of the test. For aldosterone, the cut-off with maximum discrimination for all situations was 6 ng/dL. For the other steroids maximum discrimination was achieved with 400 ng/dL for 11-deoxycortisol and 300 ng/dL for DHEA. These three cut-off values are indicated in Figure 2 as lines on the Y-axis. A cortisol cut-off value of 20 μg/dL is indicated on the X-axis.
Figure 3.
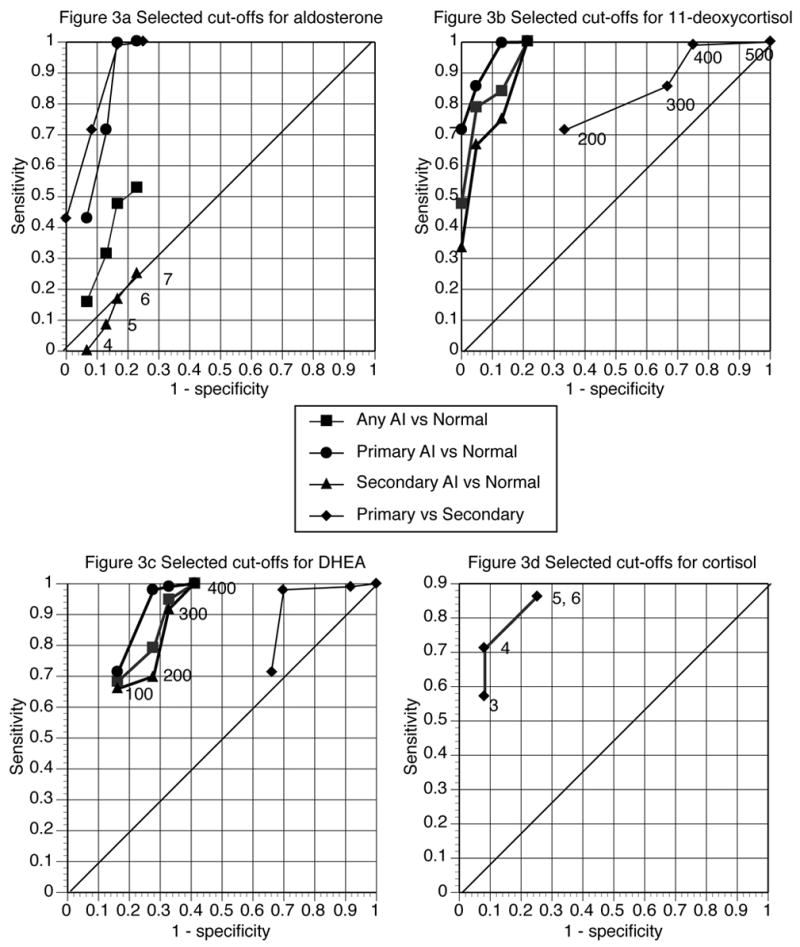
Receiver operating curves for diagnosing types of AI using four selected cut-offs for four steroids
The increment in DHEA-S with ACTH stimulation was minimal. However, as can be visualized in Figure 1g, overall DHEA-S levels were very different in normal subjects, compared with those with AI. Using a cut-off value of < 50 μg/dL as being indicative of AI, the following test accuracy was achieved: 84% sensitivity, 61% specificity, 40% positive predictive value, and 92% negative predictive value.
Screening Test Performance
The three best steroid cut-offs for all situations were further analyzed as shown in Table 4. The sensitivity, specificity, positive predictive value, and negative predictive value were determined for the three cut-offs to determine their overall performance as screening tests.
Table 4a.
Predictive value of selected peak cut-offs for determining AI
| Number with AI primary or secondary AI | Number with normal status | Total | Sensitivity % | Specificity % | PPV % | NPV % | |
|---|---|---|---|---|---|---|---|
| Cortisol (μg/dL) used as definition of AI | |||||||
| <20 | 19 | 0 | 19 | 100 | 100 | 100 | 100 |
| ≥20 | 0 | 61 | 61 | ||||
| Total | 19 | 61 | 80 | ||||
| Aldosterone (ng/dL) | |||||||
| <6 | 9 | 10 | 19 | 47 | 84 | 47 | 84 |
| ≥6 | 10 | 51 | 61 | ||||
| Total | 19 | 61 | 80 | ||||
| 11-deoxycortisol (ng/dL) | |||||||
| <400 | 16 | 8 | 24 | 84 | 87 | 67 | 95 |
| ≥400 | 3 | 53 | 56 | ||||
| Total | 19 | 61 | 80 | ||||
| DHEA (ng/dL) | |||||||
| <300 | 18 | 20 | 38 | 95 | 67 | 47 | 98 |
| ≥300 | 1 | 41 | 42 | ||||
| Total | 19 | 61 | 80 | ||||
| Three-steroid profile (aldosterone < 6 ng/dL, 11-deoxycortisol < 400 ng/dL, DHEA < 300 ng/dL) | |||||||
| Yes | 9 | 0 | 9 | 47 | 100 | 100 | 86 |
| No | 10 | 61 | 71 | ||||
| Total | 19 | 61 | 80 | ||||
| Two-steroid profile (11-deoxycortisol < 400 ng/dL, DHEA < 300 ng/dL) | |||||||
| Yes | 15 | 1 | 16 | 79 | 98 | 94 | 94 |
| No | 4 | 60 | 64 | ||||
| Total | 19 | 61 | 80 | ||||
PPV = positive predictive value; NPV = negative predictive value
An aldosterone value of < 6 ng/dL had 100% sensitivity for separating primary AI from normal adrenal status (Table 4b). However, it was a less specific test, as 10 subjects with normal status had aldosterone levels < 6 ng/dL. The positive predictive value was therefore low at 41%. It also discriminated between primary and secondary AI, with 100% sensitivity and 100% negative predictive value (Table 4c). As expected, an aldosterone cut-off was of no value in separating secondary AI from normal adrenal function (Table 4d).
Table 4b.
Predictive value of selected peak cut-offs for determining primary AI
| Number with primary AI | Number with normal status | Total | Sensitivity % | Specificity % | PPV % | NPV % | |
|---|---|---|---|---|---|---|---|
| Cortisol (μg/dL) used as definition of AI | |||||||
| <20 | 7 | 0 | 7 | 100 | 100 | 100 | 100 |
| ≥20 | 0 | 61 | 61 | ||||
| Total | 7 | 61 | 68 | ||||
| Aldosterone (ng/dL) | |||||||
| <6 | 7 | 10 | 17 | 100 | 84 | 41 | 100 |
| ≥6 | 0 | 51 | 51 | ||||
| Total | 7 | 61 | 68 | ||||
| 11-deoxycortisol (ng/dL) | |||||||
| <400 | 7 | 8 | 15 | 100 | 87 | 47 | 100 |
| ≥400 | 0 | 53 | 53 | ||||
| Total | 7 | 61 | 68 | ||||
| DHEA (ng/dL) | |||||||
| <300 | 7 | 20 | 27 | 100 | 67 | 26 | 100 |
| ≥300 | 0 | 41 | 41 | ||||
| Total | 7 | 61 | 68 | ||||
| Three steroid profile (aldosterone < 6 ng/dL, 11-deoxycortisol < 400 ng/dL, DHEA < 300 ng/dL) | |||||||
| Yes | 7 | 0 | 7 | 100 | 100 | 100 | 100 |
| No | 0 | 61 | 61 | ||||
| Total | 7 | 61 | 68 | ||||
PPV = positive predictive value; NPV = negative predictive value
Table 4c.
Predictive value of selected peak cut-offs for discriminating primary from secondary AI
| Number with primary AI | Number with secondary AI | Total | Sensitivity % | Specificity % | PPV % | NPV % | |
|---|---|---|---|---|---|---|---|
| Cortisol (μg/dL) | |||||||
| <5 | 6 | 3 | 9 | 86 | 75 | 67 | 75 |
| ≥5 | 1 | 9 | 10 | ||||
| Total | 7 | 12 | 19 | ||||
| Aldosterone (ng/dL) | |||||||
| <6 | 7 | 2 | 9 | 100 | 83 | 78 | 100 |
| ≥6 | 0 | 10 | 10 | ||||
| Total | 7 | 12 | 19 | ||||
| 11-deoxycortisol (ng/dL) | |||||||
| <400 | 7 | 9 | 16 | 100 | 25 | 44 | 100 |
| ≥400 | 0 | 3 | 3 | ||||
| Total | 7 | 12 | 19 | ||||
| DHEA (ng/dL) | |||||||
| <300 | 7 | 11 | 18 | 100 | 8 | 39 | 100 |
| ≥300 | 0 | 1 | 1 | ||||
| Total | 7 | 12 | 19 | ||||
| Three-steroid profile (aldosterone < 6 ng/dL, 11-deoxycortisol < 400 ng/dL, DHEA < 300 ng/dL) | |||||||
| Yes | 7 | 2 | 9 | 100 | 83 | 78 | 100 |
| No | 0 | 10 | 10 | ||||
| Total | 7 | 12 | 19 | ||||
| Four-steroid profile (cortisol < 5 μg/dL, aldosterone < 6 ng/dL, 11-deoxycortisol < 400 ng/dL, DHEA < 300 ng/dL) | |||||||
| Yes | 6 | 1 | 7 | 86 | 92 | 86 | 92 |
| No | 1 | 11 | 12 | ||||
| Total | 7 | 12 | 19 | ||||
PPV = positive predictive value; NPV = negative predictive value
Table 4d.
Predictive value of selected peak cut-offs for determining secondary AI
| Number with secondary AI | Number with normal status | Total | Sensitivity % | Specificity % | PPV % | NPV % | |
|---|---|---|---|---|---|---|---|
| Cortisol (μg/dL) used as definition of AI | |||||||
| <20 | 12 | 0 | 12 | 100 | 100 | 100 | 100 |
| ≥20 | 0 | 61 | 61 | ||||
| Total | 12 | 61 | 73 | ||||
| Aldosterone (ng/dL) | |||||||
| <6 | 2 | 10 | 12 | 17 | 84 | 17 | 84 |
| ≥6 | 10 | 51 | 61 | ||||
| Total | 12 | 61 | 73 | ||||
| 11-deoxycortisol (ng/dL) | |||||||
| <400 | 9 | 8 | 17 | 75 | 87 | 53 | 95 |
| ≥400 | 3 | 53 | 56 | ||||
| Total | 12 | 61 | 73 | ||||
| DHEA (ng/dL) | |||||||
| <300 | 11 | 20 | 31 | 92 | 67 | 35 | 98 |
| ≥300 | 1 | 41 | 42 | ||||
| Total | 12 | 61 | 73 | ||||
| Three-steroid profile (aldosterone ≥ 6 ng/dL, 11-deoxycortisol < 400 ng/dL, DHEA < 300 ng/dL) | |||||||
| Yes | 7 | 1 | 8 | 58 | 98 | 88 | 92 |
| No | 5 | 60 | 65 | ||||
| Total | 12 | 61 | 73 | ||||
| Two-steroid profile (11-deoxycortisol < 400 ng/dL, DHEA < 300 ng/dL) | |||||||
| Yes | 8 | 1 | 9 | 67 | 98 | 89 | 94 |
| No | 4 | 60 | 64 | ||||
| Total | 12 | 61 | 73 | ||||
PPV = positive predictive value; NPV = negative predictive value
An 11-deoxycortisol value of < 400 ng/dL had a sensitivity and negative predictive value of 100% as a test for primary AI (Tables 4b and 4c). It was the best test, other than the defining cortisol of < 20 μg/dL, for separating secondary AI and normal status (Table 4d). It was also a reasonable test for separating any AI from normal status (Table 4a). DHEA, similarly, had 100% sensitivity and 100% negative predictive value as a test for primary AI (Tables 4b and 4c). It also had good sensitivity and negative predictive value for separating any AI from normal status (Table 4a) and secondary AI from normal status (Table 4d).
A superior discrimination could be achieved by combining cut-off values in a two- or three-steroid profile for 3 out of the 4 tests. When separating primary AI from normal status, combining 3 cut-offs yielded a test with 100% accuracy (Table 4b). Overall test performance was also improved by combining cut-offs for separating any AI from normal status (Table 4a) and separating secondary AI from normal status (Table 4d). The exception was separation of primary from secondary AI, where good results were obtained using a single aldosterone cut-off (Table 4c). Combining four cut-offs improved specificity and positive predictive value over aldosterone alone, but sensitivity and negative predictive value were sacrificed.
DISCUSSION
This study offers the advantage of studying the simultaneous responses of multiple adrenal steroids to ACTH stimulation in a relatively large number of normal subjects. Most previously published studies have reported data for single steroid measurements for smaller numbers of subjects between 12 and 46 (6, 10, 12, 14, 15, 27), although two studies did include larger-sized control groups (7, 28). There was great variability in steroid levels among our normal subjects, particularly for steroids other than cortisol. Obviously factors such as age, menstrual status, and time of day accounted for a portion of this variation. Although responses to ACTH were consistent in individuals, many of the baseline values overlapped with the values seen following ACTH stimulation across different subjects (Figure 1). For this reason, paired data analysis using individuals as their own baseline was necessary to allow significant changes to be discerned. Our data demonstrate that there were statistically significant increases in cortisol, aldosterone, 11-deoxycortisol, 17-hydroxyprogesterone, DHEA, DHEA-S and androstenedione following stimulation by ACTH (Table 2a, Figure 1). Interestingly, the largest fold-increase occurred with 11-deoxycortisol, precursor to cortisol, which increased by more than 800% (mean baseline 79 ng/dL; mean peak 676 ng/dL), compared to increases of 280% for cortisol (mean baseline 11.5 μg/dL; mean peak 31.1 μg/dL) and aldosterone (mean baseline 4.6 ng/dL; mean peak 12.5 ng/dL). DHEA-S showed the least degree of stimulation (13%) with ACTH, likely because of its long half-life, which maintains relatively constant concentrations throughout the day (29).
Peak steroid level for all steroids except aldosterone occurred at 60 minutes after ACTH injection. Cortisol showed a very consistent timing of its peak, with 98% of peak values occurring at 60 minutes. The remaining steroids with peak values at 60 minutes showed more variable timing, with only approximately 70% of the peak levels actually occurring at this time. Conversely, aldosterone showed a distinct pattern, with 73% of its peaks occurring at 30 minutes (Table 3b). These data suggest not only that adrenal insufficiency could be missed if the 60-minute blood sample is omitted, but also that the 30-minute sample cannot be dispensed with, as it provides optimal aldosterone levels for discriminating between primary and secondary AI.
Both peak steroid levels and the increment in steroid levels after ACTH injection were significantly diminished in subjects with AI (Tables 2b and 3a, Figure 1). As expected (9, 12), a significantly decreased aldosterone peak was seen in subjects with primary AI, compared with those with secondary AI. Only one patient with primary AI had been started on mineralocorticoid replacement prior to testing. This patient had normal plasma renin activity on replacement. Replacement was delayed on the day of the test itself. Both these factors make it unlikely that replacement was the cause of the deficient aldosterone response in this particular patient. As also previously demonstrated (4, 13), peak cortisol and 11-deoxycortisol values were also significantly lower in patients with primary adrenal insufficiency. However, the substantial variability in these two analyte responses (Figure 1a and 1c) has precluded their use for reliably distinguishing primary from secondary AI.
We originally hypothesized that steroids that correlated best with cortisol and/or had a different response in primary versus secondary AI may be useful adjuncts in the diagnosis of AI. With respect to distinguishing any AI from normal status, 11-deoxycortisol and DHEA cut-offs were helpful, as was a two-steroid profile of 11-deoxycortisol and DHEA (Table 4a). For separating secondary AI from a normal status, 11-deoxycortisol, DHEA, and the two-steroid profile again appeared helpful (Table 4d). However none of these equaled the performance of cortisol. A stimulated aldosterone level of less than 6 ng/dL was as sensitive as cortisol levels (100%) for distinguishing primary AI from normal status (Table 4b). A combined three-steroid profile yielded a test with 100% accuracy for making the same distinction. In addition, our study certainly confirms the fact that cortisol, the established marker, has an outstanding performance in the diagnosis of AI.
A different conclusion, however, could be reached with respect to determining the cause of AI. The aldosterone cut-off value also showed excellent discrimination of primary from secondary AI (Table 4c). An alternative, accepted method of distinguishing primary and secondary AI is to use a prolonged ACTH stimulation test. However, the considerable advantage in the use of a single aldosterone cut-off is that the result can be quickly obtained from assays easily performed on two blood samples obtained during a 60-minute test period. In contrast, the prolonged ACTH stimulation test requires a cumbersome 48-hour test period.
It has previously been suggested that cortisol levels after ACTH stimulation may be lower in primary than secondary AI (4). Although this difference is seen in various studies (6, 12), cortisol responses are clearly also affected by the severity of the AI, regardless of its cause. In our study, good accuracy in distinguishing primary from secondary AI was obtained using a cortisol level lower than 5μg/dL. Admittedly, this observation is based on a small number of patients. An alternative interpretation of these results is that our study patients with primary AI had more severe hypoadrenalism. A three-steroid or four-steroid profile was also helpful in distinguishing primary and secondary AI.
Although ACTH stimulated DHEA-S to a lesser degree than the other steroids, its overall levels were indicative of adrenal status. DHEA-S levels of less than 50 μg/dL were seen in 84 % of patients with AI, compared with 39% of normal patients. Other authors have made similar observations, noting that simultaneous measurement of cortisol and DHEA-S was helpful in diagnosing of secondary AI (18). Our results confirm that DHEA-S levels could be helpful in evaluating cases of suspected AI, but also extend the finding of low DHEA-S levels to patients with primary AI.
We were interested in examining whether use of aldosterone, 11-deoxycortisol, DHEA, or DHEA-S levels might be particularly helpful in cases of borderline cortisol responses to ACTH, or in difficult cases where biochemical evaluation and clinical data were discordant. Unfortunately, we were not able to examine this issue because very few subjects (four) had stimulated cortisol levels that fell into the gray zone of 17–19 μg/dL, not allowing for meaningful examination of other steroids in these patients. However, each of these patients also met at least 2 of the following criteria for AI: Aldosterone < 6 ng/dL, 11-deoxycortisol < 400 ng/dL, DHEA < 300 ng/dL, or DHEA-S < 50 μg/dL. Interestingly, if a cut-off of 18.6 μg/dL is used to define AI, only one patient with secondary AI would be re-classified as not being adrenally insufficient. No patients with primary AI would be re-classified.
In summary, steroid profiles provide additional information regarding adrenal function. A steroid hormone profile can easily be measured during the performance of a routine ACTH stimulation test, and potentially can be used to improve its diagnostic accuracy. Such refinement of testing is not cumbersome due to the features of MS/MS, which allow for simple, accurate, and simultaneous measurement of multiple steroids in large numbers of samples. In addition to the high throughput, our assay requires minimal sample preparation and requires a small volume of serum. All these features make it an attractive assay to use in a clinical setting. Obviously our results are based on a small group of patients, and need to be confirmed in a larger group. When trying to render a diagnosis of adrenal insufficiency of any cause 11-deoxycortisol, DHEA, or a two-steroid profile may all be helpful. With respect to determining whether a patient has primary or secondary AI, aldosterone levels of less than 6 were highly predictive. This suggests, albeit based on a small sample size, that aldosterone measurements should be employed more frequently in clinical practice. They may be particularly informative in cases where ACTH measurement is not helpful due to previous initiation of steroid therapy, or not possible because a frozen specimen is not available. When trying to distinguish between primary AI and normal status, a three-steroid profile gives complete accuracy. There does not appear to be an ideal test for making the distinction between secondary AI and normal status, although the two-steroid panel performs reasonably well. Steroid profiles measured by MS/MS are already of proven utility in other clinical settings; they have improved the accuracy of screening for congenital adrenal hyperplasia in newborns (30–32).
Accurate diagnosis of AI is critical. Although AI can be fatal without treatment, there is a clear need to avoid over-diagnosis. Therapy for AI often involves lifelong medication, and unnecessary therapy is associated with suppression of the adrenal axis, risk of osteoporosis, and glucose intolerance, even with the low dose steroids used for replacement (33, 34). We believe that MS/MS measurement of steroid hormone profiles will prove to be a useful tool to achieve the goal of accuracy in the diagnosis of AI. In conclusion, a steroid profile comprising cortisol, aldosterone, 11-deoxycortisol, and DHEA levels can be quickly and accurately generated and could be routinely employed to aid in the assignment of the cause of AI.
Acknowledgments
This work was supported in part by grant M01 RR 013297 from the National Center for Research Resources. Steven Soldin, Rochelle Tractenberg, and Joseph Verbalis are partially supported by NIH GCRC grant number MO1-RR-020359. Steven Soldin is also partially supported by Applied Biosystems/Sciex. Jacqueline Jonklaas is supported by National Center for Research Resources grant K23 RR16524.
Footnotes
Publisher's Disclaimer: This is a PDF file of an unedited manuscript that has been accepted for publication. As a service to our customers we are providing this early version of the manuscript. The manuscript will undergo copyediting, typesetting, and review of the resulting proof before it is published in its final citable form. Please note that during the production process errors may be discovered which could affect the content, and all legal disclaimers that apply to the journal pertain.
References
- 1.Grinspoon SK, Biller BM. Clinical review 62: Laboratory assessment of adrenal insufficiency. J Clin Endocrinol Metab. 1994;79(4):923–31. doi: 10.1210/jcem.79.4.7962298. [DOI] [PubMed] [Google Scholar]
- 2.May ME, Carey RM. Rapid adrenocorticotropic hormone test in practice. Retrospective review. Am J Med. 1985;79(6):679–84. doi: 10.1016/0002-9343(85)90517-0. [DOI] [PubMed] [Google Scholar]
- 3.Crowley S, Hindmarsh PC, Honour JW, Brook CG. Reproducibility of the cortisol response to stimulation with a low dose of ACTH(1–24): the effect of basal cortisol levels and comparison of low-dose with high-dose secretory dynamics. J Endocrinol. 1993;136(1):167–72. doi: 10.1677/joe.0.1360167. [DOI] [PubMed] [Google Scholar]
- 4.Dorin RI, Qualls CR, Crapo LM. Diagnosis of adrenal insufficiency. Ann Intern Med. 2003;139(3):194–204. doi: 10.7326/0003-4819-139-3-200308050-00009. [DOI] [PubMed] [Google Scholar]
- 5.Dickstein G, Shechner C, Nicholson WE, et al. Adrenocorticotropin stimulation test: effects of basal cortisol level, time of day, and suggested new sensitive low dose test. J Clin Endocrinol Metab. 1991;72(4):773–8. doi: 10.1210/jcem-72-4-773. [DOI] [PubMed] [Google Scholar]
- 6.Speckart PF, Nicoloff JT, Bethune JE. Screening for adrenocortical insufficiency with cosyntropin (synthetic ACTH) Archives of Internal Medicine. 1971;128(5):761–3. [PubMed] [Google Scholar]
- 7.Nelson JC, Tindall DJ., Jr A comparison of the adrenal responses to hypoglycemia, metyrapone and ACTH. The American Journal of the Medical Sciences. 1978;275(2):165–72. doi: 10.1097/00000441-197803000-00006. [DOI] [PubMed] [Google Scholar]
- 8.Kong MF, Jeffcoate W. Eighty-six cases of Addison’s disease. Clinical Endocrinology. 1994;41(6):757–61. doi: 10.1111/j.1365-2265.1994.tb02790.x. [DOI] [PubMed] [Google Scholar]
- 9.Oelkers W, Diederich S, Bahr V. Diagnosis and therapy surveillance in Addison’s disease: rapid adrenocorticotropin (ACTH) test and measurement of plasma ACTH, renin activity, and aldosterone. J Clin Endocrinol Metab. 1992;75(1):259–64. doi: 10.1210/jcem.75.1.1320051. [DOI] [PubMed] [Google Scholar]
- 10.Gonzalez-Gonzalez JG, De la Garza-Hernandez NE, Mancillas-Adame LG, Montes-Villarreal J, Villarreal-Perez JZ. A high-sensitivity test in the assessment of adrenocortical insufficiency: 10 microg vs 250 microg cosyntropin dose assessment of adrenocortical insufficiency. Journal of Endocrinology. 1998;159(2):275–80. doi: 10.1677/joe.0.1590275. [DOI] [PubMed] [Google Scholar]
- 11.Soule S. Addison’s disease in Africa--a teaching hospital experience. Clinical Endocrinology. 1999;50(1):115–20. doi: 10.1046/j.1365-2265.1999.00625.x. [DOI] [PubMed] [Google Scholar]
- 12.Dluhy RG, Himathongkam T, Greenfield M. Rapid ACTH test with plasma aldosterone levels. Improved diagnostic discrimination. Ann Intern Med. 1974;80(6):693–6. doi: 10.7326/0003-4819-80-6-693. [DOI] [PubMed] [Google Scholar]
- 13.Fiad TM, Kirby JM, Cunningham SK, McKenna TJ. The overnight single-dose metyrapone test is a simple and reliable index of the hypothalamic-pituitary-adrenal axis. Clinical Endocrinology. 1994;40(5):603–9. doi: 10.1111/j.1365-2265.1994.tb03011.x. [DOI] [PubMed] [Google Scholar]
- 14.Tordjman K, Jaffe A, Trostanetsky Y, Greenman Y, Limor R, Stern N. Low-dose (1 microgram) adrenocorticotrophin (ACTH) stimulation as a screening test for impaired hypothalamo-pituitary-adrenal axis function: sensitivity, specificity and accuracy in comparison with the high-dose (250 microgram) test. Clinical Endocrinology. 2000;52(5):633–40. doi: 10.1046/j.1365-2265.2000.00984.x. [DOI] [PubMed] [Google Scholar]
- 15.Manglik S, Flores E, Lubarsky L, Fernandez F, Chhibber VL, Tayek JA. Glucocorticoid insufficiency in patients who present to the hospital with severe sepsis: a prospective clinical trial. Critical Care Medicine. 2003;31(6):1668–75. doi: 10.1097/01.CCM.0000063447.37342.A9. [DOI] [PubMed] [Google Scholar]
- 16.Laureti S, Candeloro P, Aglietti MC, et al. Dehydroepiandrosterone, 17alpha-hydroxyprogesterone and aldosterone responses to the low-dose (1 micro g) ACTH test in subjects with preclinical adrenal autoimmunity. Clinical Endocrinology. 2002;57(5):677–83. doi: 10.1046/j.1365-2265.2002.01651.x. [DOI] [PubMed] [Google Scholar]
- 17.Nasrallah MP, Arafah BM. The value of dehydroepiandrosterone sulfate measurements in the assessment of adrenal function. Journal of Clinical Endocrinology and Metabolism. 2003;88(11):5293–8. doi: 10.1210/jc.2003-030449. [DOI] [PubMed] [Google Scholar]
- 18.Yamaji T, Ishibashi M, Takaku F, Itabashi A, Katayama S, Ishii J. Serum dehydroepiandrosterone sulfate concentrations in secondary adrenal insufficiency. J Clin Endocrinol Metab. 1987;65(3):448–51. doi: 10.1210/jcem-65-3-448. [DOI] [PubMed] [Google Scholar]
- 19.Joshi U. Non-isotopic immunoassays for the estimation of steroid hormones. In: Pal S, editor. Immunoassay Technology. Vol. 1. Berlin: Walter de Gruyter & Co; 1985. [Google Scholar]
- 20.College of American Pathologists Proficiency Testing Program (CAP PT), Surverys Y-A Lignads (Special) Northfield, Ill: College of American Pathologists; 2002. [Google Scholar]
- 21.Palmer-Toy DE, Wang E, Winter WE, et al. Comparison of pooled fresh frozen serum to proficiency testing material in College of American Pathologists surveys: cortisol and immunoglobulin E. Archives of Pathology & Laboratory Medicine. 2005;129(3):305–9. doi: 10.5858/2005-129-305-COPFFS. [DOI] [PubMed] [Google Scholar]
- 22.Vogeser M, Briegel J, Jacob K. Determination of serum cortisol by isotope-dilution liquid-chromatography electrospray ionization tandem mass spectrometry with on-line extraction. Clinical Chemistry and Laboratory Medicine. 2001;39(10):944–7. doi: 10.1515/CCLM.2001.151. [DOI] [PubMed] [Google Scholar]
- 23.Kao PC, Machacek DA, Magera MJ, Lacey JM, Rinaldo P. Diagnosis of adrenal cortical dysfunction by liquid chromatography-tandem mass spectrometry. Annals of Clinical and Laboratory Science. 2001;31(2):199–204. [PubMed] [Google Scholar]
- 24.Holst JP, Soldin OP, Guo T, Soldin SJ. Steroid hormones: relevance and measurement in the clinical laboratory. Clin Lab Med. 2004;24(1):105–18. doi: 10.1016/j.cll.2004.01.004. [DOI] [PMC free article] [PubMed] [Google Scholar]
- 25.Guo T, Chan M, Soldin SJ. Steroid profiles using liquid chromatography-tandem mass spectrometry with atmospheric pressure photoionization source. Arch Pathol Lab Med. 2004;128(4):469–75. doi: 10.5858/2004-128-469-SPULCM. [DOI] [PubMed] [Google Scholar]
- 26.Guo TTR, Singh RJ, Soldin SJ. Simultaneous determination of 12 steroids by isotope dilution liquid chromatography-photospray ionization tandem mass spectrometry. Clin Chim Acta. 2006;372(1–2):76–82. doi: 10.1016/j.cca.2006.03.034. [DOI] [PubMed] [Google Scholar]
- 27.Mayenknecht J, Diederich S, Bahr V, Plockinger U, Oelkers W. Comparison of low and high dose corticotropin stimulation tests in patients with pituitary disease. Journal of Clinical Endocrinology and Metabolism. 1998;83(5):1558–62. doi: 10.1210/jcem.83.5.4831. [DOI] [PubMed] [Google Scholar]
- 28.Hurel SJ, Thompson CJ, Watson MJ, Harris MM, Baylis PH, Kendall-Taylor P. The short Synacthen and insulin stress tests in the assessment of the hypothalamic-pituitary-adrenal axis. Clinical Endocrinology. 1996;44(2):141–6. doi: 10.1046/j.1365-2265.1996.555381.x. [DOI] [PubMed] [Google Scholar]
- 29.Leowattana W. DHEAS as a new diagnostic tool. Clinica Chimica Acta; International Journal of Clinical Chemistry. 2004;341(1–2):1–15. doi: 10.1016/j.cccn.2003.10.031. [DOI] [PubMed] [Google Scholar]
- 30.Rauh M, Groschl M, Rascher W, Dorr HG. Automated, fast and sensitive quantification of 17alpha-hydroxy-progesterone, androstenedione and testosterone by tandem mass spectrometry with on-line extraction. Steroids. 2006;71(6):450–8. doi: 10.1016/j.steroids.2006.01.015. [DOI] [PubMed] [Google Scholar]
- 31.Lacey JM, Minutti CZ, Magera MJ, et al. Improved specificity of newborn screening for congenital adrenal hyperplasia by second-tier steroid profiling using tandem mass spectrometry. Clinical Chemistry. 2004;50(3):621–5. doi: 10.1373/clinchem.2003.027193. [DOI] [PubMed] [Google Scholar]
- 32.Minutti CZ, Lacey JM, Magera MJ, et al. Steroid profiling by tandem mass spectrometry improves the positive predictive value of newborn screening for congenital adrenal hyperplasia. Journal of Clinical Endocrinology and Metabolism. 2004;89(8):3687–93. doi: 10.1210/jc.2003-032235. [DOI] [PubMed] [Google Scholar]
- 33.Peacey SR, Guo CY, Robinson AM, et al. Glucocorticoid replacement therapy: are patients over treated and does it matter? Clinical Endocrinology. 1997;46(3):255–61. doi: 10.1046/j.1365-2265.1997.780907.x. [DOI] [PubMed] [Google Scholar]
- 34.Florkowski CM, Holmes SJ, Elliot JR, Donald RA, Espiner EA. Bone mineral density is reduced in female but not male subjects with Addison’s disease. New Zealand Medical Journal. 1994;107(972):52–3. [PubMed] [Google Scholar]