

Abstract
Plasma cells develop from B-lymphocytes following stimulation by antigen and express a genetic program aimed at the synthesis of immunoglobulins. This program includes the induction of genes coding for transcription factors such as PRDM1 and XBP1, cell-surface molecules such as CD138/syndecan-1 and for the unfolded protein response (UPR). We review how the microarray technology has recently contributed to the understanding of the biology of this rare but essential cell population and its transformation into pre-malignant and malignant plasma cells.
Keywords: B-Lymphocytes; cytology; immunology; Cell Differentiation; genetics; Cell Transformation, Neoplastic; genetics; Gene Expression Profiling; Humans; Oligonucleotide Array Sequence Analysis; Paraproteinemias; genetics; Plasma Cells; cytology; immunology; metabolism
1. Introduction
Plasma cells (PCs) – or antibody-secreting cells (ASC) – are the terminally differentiated B lymphocytes devoted to the task of synthesizing immunoglobulins (Ig). Most PCs are located in the bone marrow where they constitute a very small cell population (0.5 % of bone marrow cells) that may survive for months or even years (1). They are the major source of circulating Ig. Antibodies are the effectors of humoral specific immunity, conjugating remarkable specificity and high efficacy in destroying their targets. Because Ig are crucial for the protection of the organism against microorganisms but may be the cause of serious hazard in the form of autoimmunity, the differentiation, proliferation and survival of PCs are tightly regulated. The high specificity of the antibodies is the result of several DNA modifying events involving mutations in variable Ig gene mutations and Ig chain switch. Error in Ig switch process can lead to an illegitimate activation of oncogenes that are considered as the first step of a process that changes a B lymphocyte into an uncontrolled proliferating premalignant or malignant PC in the bone marrow of patients with monoclonal gammopathy with undetermined significance (MGUS) or with multiple myeloma (MM). We will review how microarrays have recently contributed to the understanding of the biology of this rare but essential cell population and its transformation into pre-malignant and malignant PCs.
2. Normal plasma cells
Using gene expression profiling (GEP) with Affymetrix microarrays on purified cell populations of plasmablasts and bone marrow mature PCs, we were recently able to build a molecular portrait of 125 genes involved in differentiation of B cells into plasmablasts and subsequently into bone marrow PCs (BMPCs) (2). We are currently extending these results by comparing the molecular profiling of 7 normal bone marrow BMPC samples and 7 plasmablasts samples, to that of 7 B memory lymphocytes samples using pan genomic microarrays. This genome wide screen shows that 2482 probes (5.4% of the 44 760 probes used) are differentially expressed between memory B cells and BMPC with a p-value ≤ 0.01 (Kruskal-Wallis non parametric test) and a fold change of a least 3 (manuscript in preparation). These modifications include transcription factors, cell surface molecules and enzymes involved in metabolism, especially in protein processing.
2.1. The plasma cell transcription factor network
Differentiation of a B lymphocyte into a PC is driven by a profound modification of the transcription factor network (Figure 1A). This has been comprehensively reviewed by K. Calame and collaborator (Shapiro-Shelef and Calame 2005). The transcriptional represser PRDM1/PRDI-BF1/BLIMP1 is the master regulator of terminal B cell development and is sufficient to drive primary mouse splenocytes into antibody-secreting PCs (3). Lack of PRDM1 in B lymphocytes causes a profound defect in Ig synthesis due to a lack of PC formation (4). PRDM1 expression is increased over 4 times during PC differentiation, as early as in proliferating plasmablast stage (Figure 1B). Genes regulated by PRDM1 have been extensively studied by microarrays (5). Genes identified as directly repressed by PRDM1 due to binding sites to this transcription factor in their promoter include PAX5, SPIB/Spi-B, ID3, CTIIA and MYC (5, 6). PRDM1 expression also blocks immunoglobulin class switching by blocking the expression of AID, KU70, KU86, DNA-PKCs and STAT6 (5). One key regulator of PRDM1 expression was identified by a microarray screen, the six-zinc-finger-containing transcriptional represser BCL6 (7). BCL6 is essential for the generation of germinal centers where it is highly expressed and prevents the expression of the TP53/p53 suppressor gene (8) and the expression of PRDM1 (7). Repression by BCL6 depends on MTA3 expression, a subunit of the corepressor complex MI-2/NuRD (9). Downregulation of paired box protein 5 (PAX5)/BSAP gene is one of the main consequence of the upregulation of PRDM1 and is necessary for the PC differentiation program to proceed (10). PAX5 is essential for B-lineage commitment and activates the expression of genes such as VpreB and CD19 and represses the expression of genes switched on in PCs such as heavy chain Ig (IgH) and XBP1. Other transcription factors that are characteristic of B lymphocytes are silenced upon plasma-cell differentiation, such as BACH1 and BACH2 (11), or EBF (12). The modifications of this transcription factor network are comprehensively captured by microarrays as shown in Figure 1B. Other transcription factors important for PC formation include IRF4 and OBF1 – the later only for T-cell dependant PCs (13, 14). Our results show that IRF4 is highly expressed at the plasmablast stage whereas OBF1 only show a modest increase during PC differentiation.
Figure 1.

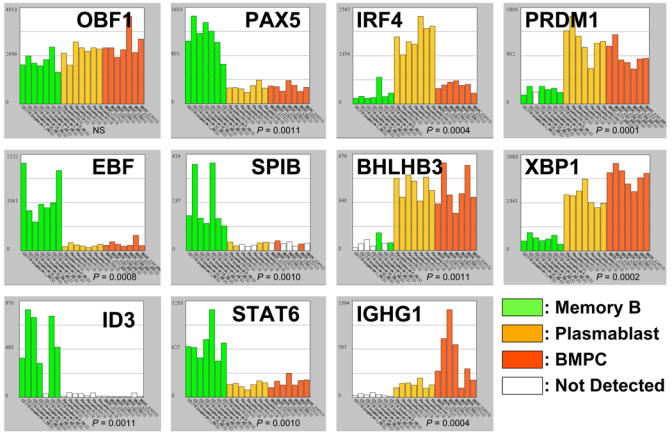
The plasma cell transcription factor network. (A) Green boxes indicate transcription factors that are repressed during plasma cell differentiation and orange boxes transcription factors that are induced upon plasma cell differentiation. A solid line indicates a direct interaction of the transcription factor with the promoter of a target gene. Major events are the induction of PRDM1/BLIMP1 secondary to the inhibition of BCL6 activity, the repression of PAX5 expression by PRDM1, that in turn drives the upregulation of XBP1. XBP1 is mandatory for plasma cell differentiation and for the unfolded protein response. See text of gene abbreviation. (B) Histograms show the expression level of 10 transcription factors regulating B-lymphocyte and plasma cell differentiation. Gene expression is measured by pan genomic HG-U133AB Affymetrix oligonucleotides microarrays and the signal intensity for each gene is shown on the Y axis as arbitrary units determined by the GCOS 1.2 software (Affymetrix). Each histogram features the same 21 samples: 7 peripheral blood CD27+ memory B-lymphocytes samples (green boxes), 7 CD20− CD38+ plasmablasts samples obtained by in vitro differentiation of memory B-lymphocytes (orange boxes), and 7 CD138+ bone marrow plasma cells samples (red boxes). If the gene is not detected, i.e. the gene has an “absent” detection call in the GCOS 1.2 software, the box is left white. Histograms were generated with our “Amazonia!” web site (http://amazonia.montp.inserm.fr/). Genes on the left are preferentially expressed in B memory samples whereas gene on the right are preferentially expressed in plasma cell samples. The level of significance of the expression level variation between the three sample classes was assessed using a non parametric Kruskal-Wallis test. NS:P>0.05.
Most interestingly, the microarrays also uncover new transcription factors whose expression is strongly induced during PC differentiation. One of these transcription factors is BHLHB3/DEC2/SHARP1 (unpublished results), a class B basic helix-loop-helix transcription factor involved in the regulation of the molecular clock of the body (15). This transcription factor displays a remarkable high expression in normal PCs (Figure 1B) that is also observed in MM cells (data not shown). This pattern of expression strongly suggests that BHLHB3 may play a functional role during late B cell differentiation.
2.2. The plasma cell phenotype
Based on studies of reactive plasmacytosis and in vitro culture systems, at least three different PC stages can be identified by cell surface phenotyping during the differentiation process that transforms a germinal center B lymphocyte with a high affinity Ig to a mature PC residing in the bone marrow. The plasmablast is a CD20− CD38++ CD45++ CD126++ CD138− cell located in secondary lymphoid organs and transiently in the blood stream, and can be obtained from resting B memory cells in vitro (16–18). In the bone marrow, two populations differing in their respective CD45 expression are found, early PCs that are CD20− CD38++ CD45++ CD126++ CD138++ whereas mature PCs are CD20− CD38++ CD45weak CD126+ CD138++. As illustrated by microarrays experiments (Figure 2), PC differentiation is characterized by the loss of pan-B markers (CD20, CD22, CD24), the up-regulation of CD38 starting from the plasmablast stage and the appearance of syndecan 1/CD138 late during development. In agreement with the role of IL-6 during PC differentiation, plasmablasts and/or mature PCs express 5 times more IL-6R/CD126 and GP130/CD130 than memory B cells (Figure 2). Down-regulation of CD45 expression characterizes the terminally differentiated, non proliferating mature PC stage. This characteristic is shared by primary myeloma cells (19). Conversely, a high expression of CD45 is observed on plasmablasts and early PCs as well as the proliferating fraction of the U266 human myeloma cell line (HMCL) (17, 20). Other surface markers vary during PC differentiation, including CD31 and CD54, which are found on mature PCs (16), CD39 which is specifically found on plasmablasts (Figure 2, unpublished results) and VCAM1. Some of these cell surface molecules (CD20, CD38, CD138) have been used to highly purify plasmablasts, tonsil or bone marrow PC by flow cytometry or using magnetic beads, and thus allowing a more specific molecular analysis using microarrays (2. 16, 21, 22).
Figure 2.

The plasma cell phenotype. Histograms show the expression level of 11 genes coding for cell surface proteins characterizing B-lymphocytes or plasma cells. See legend in Fig 1B.
2.3. The plasma cell homing
PC differentiation is a dynamic process during which a B lymphocyte expressing a high affinity Ig will leave the germinal center of secondary lymphoid organs to migrate, via the blood, to the bone marrow which is the principal site of long-lived ASC. The mature PC depends on survival signals provided by the microenvironment niche of the bone marrow. These “survival niches”, in which long lived PCs reside, appear to be limited in number. There is presumably competition among PC for these niches. Evidence for this hypothesis is given by the fact that long lived PC without tetanus toxoid specificity are expulsed in the blood circulation after vaccination with tetanus toxin (23). The movement of the PC is under the control of repellent and attractant signals, involving chemokines, chemokine receptors, and adhesion molecules (24).
2.3.1. Chemokines
The chemokine receptor CXCR4 is a major determinant of the medullar localization of immature B lymphocytes and ASC. B-cell lineage and granulocytic precursors are released into the periphery in CXCR4−/− mice (25). In addition, reconstitution of hematopoiesis in irradiated mice with CXCR4−/− fetal liver cells results in the aberrant shift of PCs from the bone marrow to the blood circulation (26). Accordingly, CXCR4 expression is downregulated in plasmablasts which transit through the blood flow, before regaining a strong expression in BMPC (Figure 3). The mobilization of ASC is also linked to the loss of expression of two chemokine receptors, CCR7, a receptor for CCL19/ELC and CCL21/SLC, and CXCR5, a receptor for CXCL13/BLC (26). Both chemokine receptors are involved in the localization of B lymphocytes in secondary lymphoid organs, i.e. in the T-cell zone and the germinal centers, respectively (27). Loss of CCR7 and CXCR5 will increase the differentiating ASCs to respond to CXCL12/SDF1, the ligand of CXCR4, that is highly expressed by bone marrow stromal cells.
Figure 3.

Chemokine receptors. (A) Histograms show the expression of 5 chemokines receptors characterizing B-lymphocytes or plasma cells. See legend in Fig. 1B. (B) Schematic representation of the expression of CCR7, CXCR5, CXCR4, CCR1 and CCR2 on memory B cells, plasmablasts and bone marrow plasma cells (BMPC).
We previously observed, using cDNA macroarrays, that malignant PCs overexpress the chemokine receptors CCR1 and CCR2 as compared to lymphoblastoid cell lines (28). Microarray analysis of primary plasma cell samples has shown that CCR1 and CCR2 are overexpressed in both normal and malignant PC compared to B memory lymphocytes, CCR2 is expressed starting at the plasmablast stage whereas CCR1 is only overexpressed in mature PC stage (Figure 3) (2, 16). The expression of MIP1alpha, one of the ligands of CCR1, is induced during PC differentiation (see below, Figure 5). The preferential expression of these chemokine receptors is likely governing the homing of BMPCs to their bone marrow niche.
Figure 5.

Growth factors and growth factor receptors. Histograms show the expression of 8 genes coding for receptors or receptor ligands characterizing B-lymphocytes or plasma cells. See legend in Fig. 1B. (*) Expression of FRZB in the same 21 normal B lymphocytes and plasma cells samples used in all histograms, plus CD138+ purified plasma cells from 19 patients with multiple myeloma (purple boxes). Note that the scale of the Y axis is different than in the histogram showing the expression of FRZB in nonmalignant B lymphocytes and PCs. Some MM samples display a striking overexpression of FRZB compared to BMPC samples.
2.3.2. Selectins and adhesion molecules
Plasmablasts transit from secondary lymphoid organs to the bone marrow. The mechanisms by which ASCs traffic are still unsatisfactorily understood, but adhesion and activation events regulating the migration of all subsets of circulating leukocytes are likely to apply to ASCs too (24). Circulating leukocytes tether to and roll on the endothelium through transient selectin–carbohydrate ligand interactions and/or integrin–CAM (cell cell-adhesion molecule) interactions. Rolling allow the cell to become sufficiently activated by locally released or displayed cytokines and chemoattractants to allow an integrin-mediated firm adhesion followed by diapedesis. By providing a large scale gene expression analysis of plasmablasts, microarrays have identified SELPLG/CD162/Selectin-P ligand as being strikingly upregulated during in vitro plasmablast generation (Figure 4) (16). In turn, the selectin-L/SELL/CD62L is lost between the stages of plasmablast and BMPC.
Figure 4.
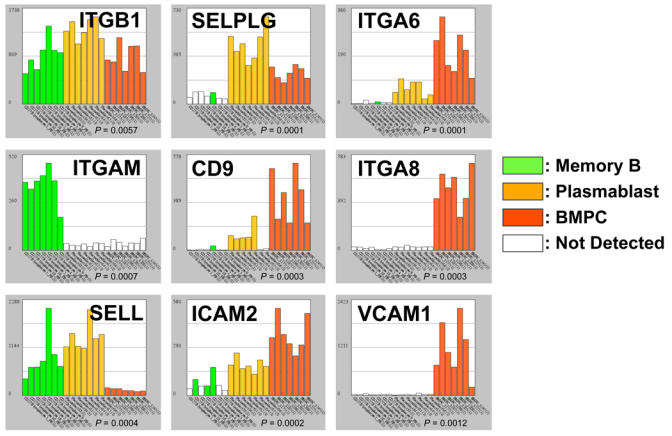
Selectins and adhesion molecules. Histograms show the expression of 9 genes coding for adhesion molecules characterizing B-lymphocytes or plasma cells. See legend in Fig. 1B.
Regarding integrins, figure 4 shows that two alpha chains are preferentially expressed in ASCs (2, 16). ITGA6 expression is switched on in plasmablasts and still increases when reaching the stage of BMPC as shown previously (29). ITGA8 is only expressed in BMPC. Because the integrin beta chain ITGB1 is expressed by PCs (Figure 4), the corresponding functional integrin heterodimers (α6β1 (VLA-6) and α8β1 (VLA-8)) are likely expressed on these cells. Conversely, the integrin alpha M/ITGAM/CD11b is strikingly downregulated early during PC differentiation. A very similar expression pattern of integrin alpha chains is found on malignant PCs (data not shown).
Other adhesion molecules upregulated during PC differentiation include vascular cell adhesion molecule 1 (VCAM1), intercellular adhesion molecule 2 (ICAM2) and the tetraspanin CD9 (Figure 4) (2).
2.4. Integrating extracellular cues
Interleukin-6 (IL-6) plays an important role in the normal PC physiology. Mice lacking this gene are impaired in T-cell-dependent antibody response (30), and conversely, transgenic mice expressing IL-6 under the control of the Eμ enhancer promoter trigger a fatal polyclonal plasmacytosis (31). In agreement with these findings in mice, IL-6 is a growth factor for nonmalignant human plasmablasts (32). As highlighted above, both chains of the IL-6 receptor are upregulated during PC differentiation (Figure 2), enabling the PC to respond to IL-6.
Most long survival PCs home to the bone marrow. A privileged relationship between PCs. bone and the cells that mediate bone homeostasis, i.e. osteoblasts and osteoclasts, is very likely, but still very poorly characterized. By contrast, it is well documented that during the development of multiple myeloma, malignant PCs activate a large number of cell-to-cell signals that lead to the blockade of osteoblast activity and the concomitant stimulation of osteoclast activity (33). Whether this program is specific to the transformed PC or, at least in part, the execution of a physiological program that allows the nonmalignant PC to carve a survival niche in the bone marrow is an issue that awaits to be carefully addressed. It is therefore interesting to observe that microarray analysis of PCs identifies the secreted WNT antagonist FRZB/sFRP3 as a gene induced in BMPC (Figure 5) (28). Indeed, the WNT signaling pathway is important for the growth and differentiation of osteoblasts. This is illustrated by osteopenia in mice with loss of function of the WNT co-receptor LRP5 or in mice exposed to elevated levels of the WNT inhibitor DKK1 (34). It must be noted that the level of expression of FRZB/sFRP3 in BMPC, though significantly elevated as compared to memory B cells and plasmablasts, is way below the level found in most MM samples (Figure 5). We have also observed that the chemokine MIP1 alpha/MIP1A/CCL3 is induced during PC differentiation. This chemokine has been shown to be an osteoclastogenic factor (35). Microarray analysis of human PCs has revealed the preferential expression of B cell activating factor BCMA/TNFRSF17 on plasmablasts and mature PCs, revealing BCMA as a typical PC gene (Figure 5) (2, 16, 36). Transmembrane activator and calcium signal–modulating cyclophilin ligand interactor (TACI)/TNFRSF13B is a closely related receptor that is also induced during PC differentiation (Figure 5). BCMA and TACI are members of the TNF receptor family with two ligands of the TNF family: A Proliferation-Inducing Ligand APRIL/TNFSF13 and B Cell Activating Factor BAFF/TNFSF13B. In addition, BAFF also ligates a third TNFRSF receptor, BAFF-Receptor BAFFR/TNFRSF13C. Studies with knock-out and transgenic mice has shown that the BAFF/BAFFR axis has an essential role in the maturation and the survival of peripheral B cells, BCMA has a critical role for the survival of long-lived bone marrow PCs, whereas TACI participates in T cell–independent immune responses and isotype switching (37–40). The expression of APRIL in B cells and mature plasma cells (Figure 5) and the very strong expression of APRIL in osteoclasts, monocytes and the myeloid lineage (41) suggests that plasma cells are exposed to the cognate ligand of BCMA in their bone marrow niche. Interestingly, it was recently established that APRIL can bind syndecan-1, a proteoglycan that is a hallmark of PC differentiation (42). These findings strongly suggest that BCMA plays an important role in human PC survival as it does in mice, with consequences for therapeutic intervention in non-malignant or malignant plasma cell disorders like MM (discussed below).
PCs are the main hematopoietic cells that express the heparan sulfate proteoglycan syndecan-1/SDC1/CD 138 (43). In addition to PCs, preB lymphocytes may also express CD138, but not mature B lymphocytes, nor the other hematopoietic cell populations (44). This unique feature has opened the way to identify and to purify normal and malignant PCs from bone marrow or blood to homogeneity using magnetic bead selection (22, 45). SDC1 is a typical late PC gene, whose expression begins after the plasmablast stage (Figure 2). Interestingly, in addition to a role in cell adhesion by promoting homotypic cell aggregation, a crucial function for SDC1 is to be cofactor in many signalling pathways by binding heparin binding growth factors, thereby increasing the availability of these molecules to the PCs (46). The list of secreted soluble ligands sequestered by SDC1 is rising and includes Hepatocyte Growth Factor (HGF), Osteoprotegerin (OPG), Fibroblast Growth Factors (FGFs), chemokines, some members of the TGF superfamily, and very recently APRIL (42, 46, 47). Four years ago, we found a major expression of the tyrosine kinase TYRO3 in some HMCL. TYRO3 is part of a family of tyrosine kinase transmembrane receptors that also encompasses the closely related receptors MERTK and AXL. This family of tyrosine kinase is involved in several physiological processes, including amplification of platelet aggregation, control of inappropriate immune responses, spermatogenesis and regulation of osteoclastic bone resorption (48–51). In addition, these receptors are overexpressed by many tumors and can transform cultured cells in vitro (52, 53). We gathered a remarkable body of expression data regarding this signalling pathway in plasma cells. Although TYRO3 is not expressed in normal PCs or primary malignant PCs, MERTK and AXL are expressed at the terminal stage of PC differentiation as shown in Figure 5. Moreover, the expression of the ligand of these three receptors, Growth Arrest-Specific 6 (GAS6), is turned on in PCs. These observations give compelling evidence that this signalling pathway is involved in the biology of ASC. TYRO3 activation by GAS6 induces osteoclastic bone resorption in mice (49), thus this signaling axis could play a role in the physiological interaction of PCs with bone. However, this hypothesis does not clarify the meaning of the upregulation of TYRO3 in some HMCL. Therefore, careful functional analysis will be mandatory to determine the exact role of the expression of these receptors and their ligand by normal and malignant PC.
2.5. Apoptosis
Memory B cells and BMPC are cells with a prolonged survival in vivo, in contrast to plasmablasts that are cell highly prone to apoptosis and die if they are deprived of the access to a survival niche. Expression of several anti-apoptotic members of the BCL2 family varies accordingly. Memory B cells express high levels of BCL2A1/A1 and BCL2 (Figure 6). BMPC express markedly BCL2 and MCL1. In contrast, plasmablasts express no or little of these anti-apoptotic molecules. These characteristics may explain why plasmablasts are doomed to die by apoptosis as observed for plasmablasts after 8 days of in vitro differentiation of peripheral blood B lymphocytes or for plasmablasts from reactive plasmacytosis (16, 32). It is likely that in the case plasmablasts reach the appropriate bone marrow niche, they receive signals that result in the expression of antiapoptotic proteins such as BCL2 and MCL1. Another observation in line with the pre-apoptotic state of plasmablasts is the expression of caspase 6 (CASP6) by these cells (2).
Figure 6.

Apoptosis and cell cycle. Histograms show the expression of 9 genes involved in cell cycle progression or apoptosis in B-lymphocytes or plasma cells. Note that cyclin D1 (CCND1) is not expressed in normal B-lymphocytes or plasma cells (boxes are white), that CCND2 is highly overexpressed in plasmablasts, whereas CCND3 is expressed in all three cell categories with modest expression disparity across samples categories. See legend in Fig. 1B. ND: P-value not assessed because this gene was not detected in any sample.
2.6. Cell cycle
Peripheral blood memory B cells and BMPC are cells that are not cycling, in contrast to plasmablasts that can have more than 30% of the cells in the S-phase (16). It is therefore not surprising to observe in plasmablasts the very strong expression of more than one hundred genes involved in the cell cycle progression (unpublished results). Some typical examples are depicted in Figure 6, such as the Budding Uninhibited by Benzimidazoles 1 homolog (BUB1) gene or the minichromosome gene MCM2. Of note, cyclin D2 (CCND2) is the cyclin D that is highly expressed in proliferating non-malignant plasmablasts, whereas CCND1 is not expressed and CCND3 expression level does not vary markedly during PC differentiation.
2.7. Immunoglobulin secretion and the unfolded-protein response
During PC differentiation, as a consequence of the induction of PRDM1 and the repression of PAX5, Ig production is switched to a secreted form and is massively upregulated. This results in the overflow of the polypeptide processing and folding machinery in the endoplasmic reticulum (ER) and generates a stress signal to the cell. This warning is the primary signal for a highly coordinated response called the unfolded protein response (UPR) resulting in the production of ER chaperones and enzymes assisting in the protein folding. Thus, the UPR adapts the capacity of the secretory system to the load of the protein synthesis by transcriptional up-regulation of genes that function in all aspects of ER protein processing and metabolism. The link between plasma cell differentiation and UPR was demonstrated by the finding that the X-box binding-protein 1 (XBP1) basic-region leucine zipper transcription factor, which was found as the functional equivalent to the yeast Hac1p UPR activating transcription factor (54), was also shown to be required for PC differentiation (55). Microarray technology has significantly contributed to the understanding of the complex but coordinated UPR in mammalian cells. The molecular profiling induced by the expression of XBP1 was studied in mice in wild type and XBP1−/− B-cells and embryonic fibroblasts, and in the human RAJI lymphoma cell line. Major proteins involved in this coordinated UPR are schemed in Figure 7A.
Figure 7.

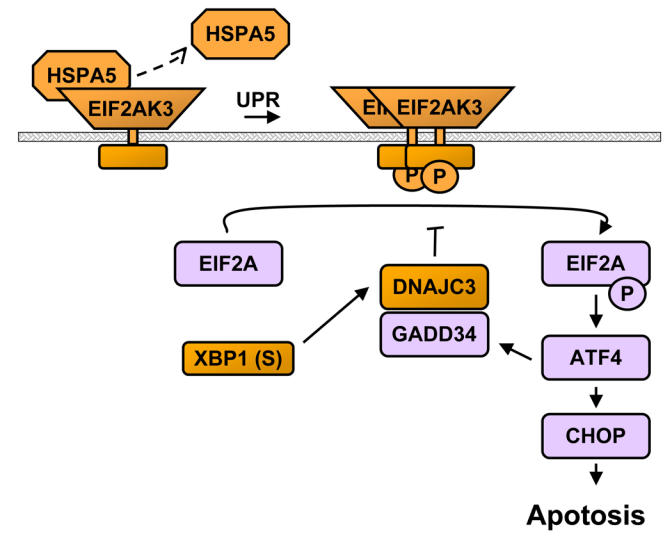
Unfolded protein response (UPR). (A) A schematic view of the UPR in plasma cells in response to the expression of XBP1 and immunoglobulins (Ig). With the increasing load of proteins in the endoplasmic reticulum (ER) due to the massive translation of Ig, the heat shock protein HSPA5/BIP is displaced from proteins such as ATF6, ERN1/IRE1 and EIF2AK3/PERK to newly synthetized Ig. The dissociation of HSPA5 from ATF6 induces the cleavage of ATF6. The nuclear form of ATF6 (ATF6(N)) induces the expression of target genes, including XBP1, by binding a ER stress response element (ERSE) in their promoter. The release of ERN1 from HSPA5 induces the homodimerization of this kinase, self-phosphorylation and activation of its endoribonuclease activity. ERN1 activity results in an unconventional splicing of XBP1: XBP1(S). XBP1(S) is in turn able to activate the UPR by binding to the UPR response element (UPRE) in target genes. UPR genes includes genes involved in ER targeting, ER membrane translocation, protein folding, oxidative protein folding, misfolded protein degradation, protein glycosylation and ER-golgi trafficking. The release of EIF2AK3 induces the activation of this kinase and the subsequent phosphorylation of EIF2A. Phosphorylation of EIF2A turns off protein translation and activates ATF4, which induces the expression of CHOP and GADD34. Overexpression of CHOP is associated induction of apoptosis. Orange boxes stand for genes that are found upregulated in plasma cells and purple boxes stand for genes whose expression does not change during normal plasma cell differentiation.
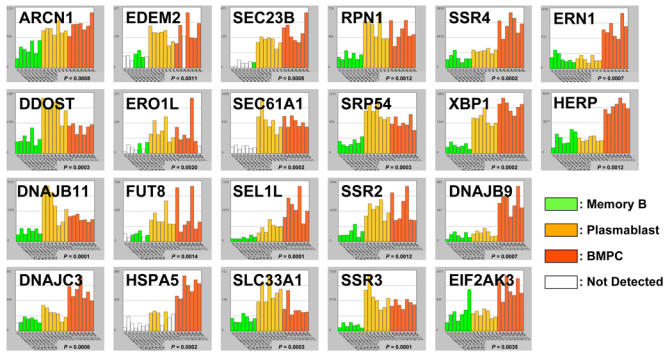
(B) Histograms show the expression of 22 genes coding for proteins involved in the UPR. See legend in Fig. 1B.
UPR is turned on in mammalian cells by the activation of three bZIP transcription factors: ATF6, ATF4 and XBP1. Following ER stress, the membrane-tethered precursor of ATF6 is relieved from its interaction with the Heat Shock 70kDa Protein 5/HSPA5/BIP, is cleaved and the N-terminal DNA-binding domain is translocated to the nucleus where it activates the transcription of XBP1 (Figure 7A). In parallel, the transmembrane kinase and endonuclease Endoplasmic Reticulum to Nucleus Signalling 1 ERN1/IRE1 is also liberated from HSPA5, resulting in the unconventional splicing of XBP1 which thereby becomes fully functional. The transcriptional activity of ATF6 and XBP1 are the corner stone of the expression of the UPR. In PCs, XBP1 expression is upregulated and spliced (56), and accordingly, many genes induced during PC differentiation are also found induced by the overexpression of XBP1 alone (57, 58). This common profile includes genes targeting proteins across the ER membrane (SRP54, RPN1, etc.), translocation of proteins across the ER membrane (SSR1, SSR3, SSR4, SEC61A1, etc.), folding of ER proteins (DNAJB9/ERdj4, HSPA5, DNAJC3, DNAJB11/HEDJ etc.), oxidative protein folding, i.e. formation of disulfide bonds (ERO1L), the degradation of misfolded protein (EDEM2, SEL1L, HERP/HERPUD1, etc.), protein glycosylation (SLC33A1, DDOST, FUT8, etc.), ER-Golgi trafficking (SEC23B, ARCN1, etc.). Interestingly, the third bZIP transcription factor, ATF4 does not seem to be active because two major ATF4 downstream targets, CHOP and GADD34, have expression level similar in BMPC and B memory cells. Activation of CHOP is part of an ER stress program that results in protein translation stop and apoptosis (59). Absence of significant activation of this pathway suggests that the physiological load of newly synthetized Ig is correctly handled by the UPR and that the stress response resulting in CHOP activation is not triggered during normal PC differentiation (57). Our current data shows the power of microarrays to investigate as a whole the expression of UPR genes in PC differentiation. Figure 7B shows 22 UPR genes that are upregulated in plasmablasts and PC compared to memory B cells.
3. Input of microarray for the understanding of malignant plasma cell dyscrasias
3.1. Short outline of malignant plasma cell dyscrasias and gene abnormalities
3.1.1. Malignant plasma cell dyscrasias
MM is a B-cell neoplasia that affects about 15 000 new patients per year in Europe and about the same number in the United States. The median age at diagnosis is 67 years. MM is characterized by the accumulation of a clone of plasma cells in the bone marrow. In a minority of patients with plasma cell leukemia (PCL), myeloma cells can grow and survive without the support of the bone marrow environment. The MM clone harbors somatic mutations of the immunoglobulin genes, which remain stable throughout the disease (60). This indicates that the “myeloma stem cell” originates from a cell that underwent antigen selection in the germinal centers, either a memory B cell or a plasma cell. High dose chemotherapy (HDT) increases the median overall survival of newly diagnosed patients to about 5–7 years in randomized clinical trials, though this is still a matter of discussion (61). The advent of new compounds such as thalidomide (62), its derivatives or bortezomib (63) has improved the treatment of patients in relapse from high dose chemotherapy and may also improve induction treatment before HDT (64). Compared with the general population, MM occurs more frequently in patients with MGUS, a pre-malignant condition, with an annual rate of transformation of MGUS into MM of about 1%. MGUS is frequent in the elderly, about 3% of the individuals over 70 years old (65).
3.1.2. Chromosome abnormalities in MM
A major advance in the biology of MM has been the identification of gene abnormalities using conventional cytogenetics or fluorescence in situ hybridization (FISH). This field was recently reviewed by Fonseca et al. (66). Karyotypic instability is a hallmark of MM (67). By metaphase cytogenetics, chromosome abnormalities can be detected in about 30% of patients with newly diagnosed MM. Using FISH on CD138-selected cells or with immunostaining of intracytoplasmic immunoglobulin light chains to identify plasma cells, chromosome aberrations can be detected in virtually all patients at the time of first diagnosis. Based on the data of metaphase cytogenetics, two partially overlapping pathogenetic pathways have been proposed: non-hyperdiploid MM (comprising MM with hypodiploid, pseudodiploid and near-tetraploid karyotypes), characterized by recurrent translocations involving the immunoglobulin heavy chain gene (IgH) on chromosome 14q32.3 and with a high incidence of 13q loss, and hyperdiploid MM associated with multiple trisomies involving chromosomes 3, 5, 7, 9, 11, 15, 19, and 21, but a lower incidence of IgH-translocations and 13q aberrations (68–70). About 50% of MM patients have hyperdiploid tumors. Recently, interphase FISH-based assays distinguishing between hyperdiploid and non-hyperdiploid MM have been reported (71, 72).
IgH-translocations are found in about 50% of patients with MGUS, 55–70% of patients with intramedullary MM, 80% of patients with primary PCL, and 90% of human myeloma cell lines (HMCL). Translocations affecting the immunoglobulin light chain genes (IgL) occur less frequently (< 20%) and mostly involve the IgL-λ locus. Chromosome partners have been identified in 40% of the cases and include chromosome 11q13, resulting in the deregulation of CCND1 (cyclinD1) and MYEOV in 16% of the patients, chromosome 4p16 resulting in the deregulation of FGFR3 and Wolf-Hirschhorn syndrome candidate 1 (WHSC1/MMSET) in 15% of MM patients, chromosome 16q22–23 resulting in the deregulation of c-maf in 5% of MM patients and chromosome 6p21 resulting in the deregulation of CCND3 (cyclin D3) in 4% of the patients. IgH-translocations define distinct entities of MM with clinical, morphologic, immunophenotypic, and therapeutic implications (66, 73, 74). Especially, the translocation t(4;14)(p16.3;q32.3) confers a bad prognosis even after high-dose therapy and autologous blood stem cell transplantation (75). IgH-translocations are also found in patients with MGUS indicating that they are early and possibly seminal events in the premalignant phase of the disease (66, 76).
We have recently described a model for the clonal evolution of MM from initiation to first diagnosis based on results from interphase FISH (72). According to this model, translocation t(11;14), hyperdiploid, and non-hyperdiploid-karyotypes each define a distinct subgroup of the disease. Furthermore, patients with additional copies of chromosome 1q21 could represent a poor prognosis group, indicated by significantly higher beta-2-microglobulin and lower hemoglobin levels. Deletions of 22q11, 8p12, 6q21 and 17p13 (TP53-locus) were found as subsequent or late events occurring in the course of the disease, but not defining subentities of MM.
Deletion of chromosome 13q14 can be found by interphase-FISH in about 50% of patients with newly diagnosed MM. This aberration has repeatedly been described to be associated with poor prognosis. Its significance was confirmed for patients after autologous and after allogenic stem cell transplantation following dose-reduced induction therapy (77, 78). However, the translocation t(4;14) is in almost all cases associated with a deletion of 13q14, and overall survival seems to be significantly shorter for patients with both t(4;14) and deletion of 13q14 than for those with deletion of 13q14 alone (77).
Deletions of chromosome 17p13 can been found in about 10–30% of patients with newly diagnosed MM (72, 79). This aberration has been reported to confer a grave prognosis for patients treated by conventional therapy. Furthermore, deletion of 17p13 was described to be an adverse prognostic factor following autologous stem cell transplantation(77, 80).
RAS mutations are found in 35–50 % of newly diagnosed patients (66). RAS mutations are rare in patients with MGUS and increase in patients with progressive disease, suggesting that they contribute to disease progression.
3.2. Gene expression profiling (GEP) in MM and patient classification
3.2.1. GEP and patient classification
Gene expression profiling of myeloma cells is thought to be utilizable to define distinct MM entities with different prognosis, and therefore stratify patients for adapted treatment. A first study comparing GEP of purified myeloma cells obtained from newly diagnosed patients with MM or MGUS, of HMCLs and of purified bone marrow plasma cells from healthy individuals was published in 2002 by the group of John Shaughnessy (81). Using hierarchical clustering, myeloma cells could be subdivided into four groups. One group comprised the HMCL whereas another group integrated the normal bone plasma cells and MGUS samples. In the “HMCL-like” myeloma cell group, patients tended to have poor-risk profile including a higher serum β2m values and unfavorable cytogenetic abnormalities. Furthermore, the same group used microarrays to define molecular signatures of cells representing the stages of human B cell development, peripheral blood B cells, tonsillar B cells, tonsillar plasma cells and bone marrow plasma cells. They showed that myeloma cells from high-risk MM has a tonsillar B cell signature whereas myeloma cells from patients with low risk feature have bone marrow or tonsillar plasma cell signature (82). Using the expression profiles of 221 MM patients assessed with Affymetrix U95 microarrays, a different classification of patients into four groups with distinct cytogenetic characteristics (ploidy status, IgH-translocations, trisomy 11) and clinical parameters (β2m, IgA, albumin, creatinin, MRI lesions, and event free survival (EFS) and overall survival (OS)) was published (83). 100 genes were identified correlating with the EFS. Three genes had independent prognostic value: Ras-related nuclear protein (RAN), Zinc finger and homeodomain protein 2 (ZHX-2) and Chromosome condensation 1-like (CHC1L) (83). Patients with high RAN expression and low ZHX-2 and CHC1L expression had a relatively shorter EFS compared to patients with low RAN and high ZHX-2 and CHC1L expression. RAN encodes for a GTPase involved in several biological pathways: shuttle of protein and RNA through the nuclear pore complex, regulation of chromosome condensation, spindle formation, nuclear assembly and cell cycle progression. CHC1L is located on chromosome 13q14.3 and is a homolog of RCC1 which is a GTP exchange factor of RAN. ZHX-2 is a negative regulator of the NF-Y transcription factor, which is involved in cell cycle control. Accordingly, a negative correlation of expressions of ZHX-2 and a panel of 30 proliferation genes was found.
Currently, published GEP classifications vary considerably. A careful statistical validation on a sufficiently high number of patients, a longer follow up and testing in a prospective clinical trial is mandatory before a GEP classification might be used for clinical decisions.
3.2.2. GEP and gene abnormalities
The first reports combining GEP and cytogenetic data indicated that the 2 most prevalent translocations in MM are associated with high expression of the deregulated oncogenes (81). In patients with a t(4;14) translocation, a high expression of WHSC1/MMSETand FRGR3 is found in 100% and 80% of cases, respectively (84, 85). The t(11;14) translocation is associated with a high CCND1 expression. CCND1 is not expressed in normal lymphoid and hematopoietic cells, particularly normal plasmablastic and plasma cells (16) (Figure 6). Using expression profiles of 65 newly-diagnosed MM-patients obtained with Affymetrix U133 A+B microarrays, we confirmed that myeloma cells with t(4;14) and t(11;14) translocations can be easily visualized by a prominent expression of FGFR3, WHSC1/MMSET or CCND genes (see Figure 8). CCND1 expression is also found in myeloma cells without t(11;14) translocation (28) (Figure 8), either in the context of a light chain translocation, or correlated with a gain of the chromosomal region 11q13. Using microarrays, Bergsagel et al. point out that a high expression of one of the three cyclin D genes – CCND1, CCND2 or CCND3 – is a general feature of MM and proposes a classification of patients with MM within 8 groups (86).
Figure 8.
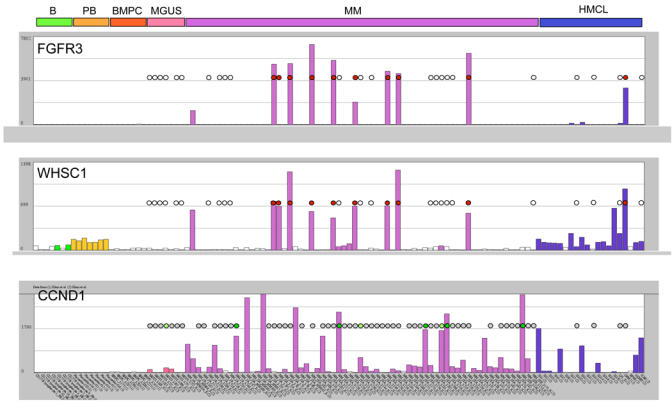
Expression of Fibroblast growth factor receptor 3 (FGFR3), Wolf-Hirschhorn syndrome candidate 1 (WHSC1/MMSET) and cyclin D1 (CCND1) in non malignant memory B lymphocytes (B) plasmablasts (PB) and bone marrow plasma cells (BMPC), in monoclonal gammapathy of unknown significance (MGUS), multiple myeloma (MM) and human myeloma cell lines (HMCL). Expression was measured by pan-genomic Affymetrix U133AB microarrays and visualized using our “Amazonia!” web site (http://amazonia.montp.inserm.fr/). See legend in Fig. 1B. The presence of t(4; 14) and t(11; 14) translocations was evidenced by FISH analysis and is indicated on the histograms by colored circles: white circle: no t(4;14); red circle: t(4;14); grey circle: no t(11;14); green circle: t(11;14) in all myeloma cells; pale green circle: t(11;14) in a myeloma cell subclone only; no circle: no FISH analysis.
Combining FISH and GEP, we identified a 6-gene predictor for four groups of patients: group 1.1 with intermediate CCND1 expression and gain of 11q13 without a translocation involving 11q13, group 1.2 with high CCND1 expression and a translocation involving 11q13, mostly t(11;14)(q13;q32.3), group 2.1 with CCND2 expression without elevated FGFR3 expression, and group 2.2 with CCCND2 expression, t(4;14) translocation and FGFR3 expression (87). This 6-gene predictor correctly classifies all patients in a training group of 65 patients, and about 90% of patients of an independent validation group comprising additional 65 patients We also found that the patients predicted to be in group 2.2 had the shortest event-free survival, in agreement with the known bad prognosis of t(4;14) (66). GEP can give some insight into the role of del13q analyzed by FISH or conventional cytogenetic (88) and indicates an upregulation of the ribosomal machinery in hyperdiploid clones with a low incidence of del13q (89). Presently, no data are published regarding the ability of microarrays to predict for del17 (P53 locus) that is associated with a poor clinical outcome after HDT (77). Thus, the combination of gene expression profiling and molecular cytogenetics like iFISH or aCGH is a promising approach and might facilitate the interpretation of expression data in the future.
3.3. GEP and the tumor microenvironment
3.3.1. Short outline of MM clone and tumor environment
Although MM is characterized by a small growth fraction, the rate of proliferation is one of the best prognostic factors (90). In a majority of patients, the survival of myeloma cells is strongly dependent on interaction with the bone marrow environment (91), including endothelial cells, osteoblasts, osteoclasts, monocytes, and polymorphonuclear leukocytes. Myeloma cells, in turn, influence the bone marrow environment, e.g. by producing VEGF that stimulates neoangiogenesis (92). Angiogenesis is a marker of disease activity (93). Interaction between myeloma cells and bone marrow stromal cells has been widely documented. In particular, myeloma cells can trigger IL-6 production in bone marrow stromal cells through an NF- B-dependent pathway (94, 95). The increased osteoclast activity in MM is probably the result of a direct contact of these cells with myeloma cells (96). The crosstalk between myeloma cells and the bone marrow environment involves chemokines and chemokine receptors, mainly CCR1 (97), CCR2 (98), MIP-1α (35) and MIP-1β (99), adhesion molecules (100), metalloproteinases (101) and production of growth factors (102). We and others identified IL-6 as a major myeloma cells growth factor in 1989 (103, 104), mainly produced by the microenvironment, in particular monocytes and stromal cells (105). IGF-1, hepatocyte growth factor, IL-10, IL-21 and more recently the epidermal growth factor family (EGF) and the BAFF/APRIL B cell growth factors were identified as myeloma cells growth factors (106–108).
3.3.2. Input of microarrays to identify novel myeloma cells growth factors
DNA arrays have proven to be very useful for identifying novel myeloma cells growth factors. In our first transcriptome study of MM, we compared the GEP of HMCL and EBV transformed cell lines using nylon macroarrays dedicated to the analysis of 268 genes coding for growth factors or their receptors, and we identified several genes whose gene products were demonstrated to be important in myeloma cells biology: the heparin binding epidermal growth factor like growth factor (HB-EGF), the WNT pathway decoyed receptor (FRZB/sFRP3), the TYRO3 receptor for GAS6 factor, the IL-6 receptor, the IGF-1 receptor, the hepatocyte growth factor activator (HGFAC) (28). The use of microarrays measuring the expression of more than 30 000 genes has confirmed and extended these early findings.
EGF family in MM
HB-EGF is expressed and used by some HMCLs as an autocrine growth factor, acting in synergy with IL-6 (28, 109). Using microarrays, we were able to screen the expression of the EGF family and their receptors and provide a general picture of the involvement of this signalling pathway in MM. The EGF family comprises 10 members and at least 4 of them can bind heparan sulfate chains: HB-EGF, amphiregulin, neuregulin-1, neuregulin-2 (110). This family binds to and induces the homo- or heterodimerization of three receptors: the EGF receptor ErbB1, ErbB3, and ErbB4. ErbB2 is a fourth member unable to bind EGF ligands. ErbB2 is a preferred heterodimerization partner for all other ErbB members and increases ErbB receptor signaling (111).
First, expression of EGF receptor family is a feature of plasma cell differentiation. Normal plasma cells express the ErbB1 and ErbB2 receptors unlike normal memory B cells or normal plasmablastic cells (112). Malignant plasma cells also expressed ErbB1, ErbB2 and in addition ErbB3 and ErbB4. Second, we found that HB-EGF is not expressed by primary myeloma cells but by the bone marrow environment, mainly by monocytes, polymorphonuclear leukocytes (107). More generally, only the EGF family members that are able to bind heparan sulfate chains (HB-EGF, amphiregulin, neuregulin-1, neuregulin-2) are able to trigger myeloma cells growth. This property is linked to the ability of these EGF members to bind at a high density to the surface of myeloma cells, through syndecan-1 (113) (Figure 9). Syndecan-1 is a heparan sulfate proteoglycan induced in plasma cell differentiation together with some EGF receptor members. As illustrated in Figure 9, one of the roles of syndecan-1 is to be a coreceptor for heparan sulfate binding EGF members favoring activation of specific ErbB receptor. Of interest, some myeloma cells acquire the capacity to produce HB-EGF initially produced by the microenvironment, which may confer an advantage for growing independently of the tumor environment. In parallel to these expression data, it was shown that the activation of ErbB receptor acts in synergy with activation of gp 130 IL-6 transducer in some myeloma cell lines (109) and in epithelial cells (114, 115). In particular, Jelinek and collaborators demonstrated that ErbB3 activation can trigger phosphorylation of interferon receptor on myeloma cells (116). We found that a pan erbB kinase inhibitor can induce apoptosis of primary myeloma cells cultures for several days together with their bone marrow environment, further emphasizing the relevance of EGF family members to trigger primary plasma cell survival (107). These findings are of interest since clinical grade inhibitors of the EGF receptor family are now under investigation in epithelial cancers (117).
Figure 9.

Syndecan-1 concentrates on the myeloma cell membrane large levels of heparan-sulfate binding epidermal growth factor (HB-EGF) family members that are produced by the tumor environment or by myeloma cells. This concentration step is critical for the activity of these growth factors on myeloma cells.
BAFF/APRIL growth factors
Another example for the usefulness of microarrays in investigating the mechanisms of the growth of myeloma cells is provided by studies on BAFF and APRIL. These growth factors are essential for nonmalignant B lymphocyte and plasma cell development (see above). In an initial comparison of expression profiles of normal plasmablasts, bone marrow plasma cells, and B cells, we found that TACI and BCMA genes were overexpressed by plasma cells (16). We and others further demonstrated that BAFF and APRIL can support the growth of myeloma cells and that conversely an inhibitor of BAFF and APRIL can induce apoptosis of primary myeloma cells (108, 118). BAFF and APRIL genes are mainly expressed by the tumor environment, in particular monocytes and polynuclear cells (41). Of interest, we found a high production of APRIL in osteoclasts whereas bone marrow stromal cells did neither express BAFF nor APRIL (41). We also found that the gene coding for the APRIL receptor, TACI, had a clear-cut expression pattern in HMCL, being either “absent” or “present” (using the Affymetrix “call”). Respective data were confirmed by RT-PCR. Regarding primary myeloma cells, patients with myeloma cells highly expressing TACI (TACI++ myeloma cells) have a gene signature linked with microenvironment dependence in agreement with the production of these factors mainly by the tumor environment. Conversely, patients with myeloma cells weakly expressing TACI (TACI−/+ myeloma cells) have a plasmablastic gene signature. This was not found for other BAFF or APRIL receptors, BCMA or BAFF-R. Recent data on APRIL might help to understand the underlying mechanism. APRIL, unlike BAFF, is able to strongly bind to syndecan-1 (42). Of these two, only APRIL can bind at a high density to the surface of myeloma cells. This binding was abrogated by pretreatment of APRIL with heparin or of myeloma cells with heparitinase (unpublished observation). As BAFF does not bind TACI, the property of APRIL to be concentrated at a high density on the myeloma cells membrane by syndecan-1 likely favors the emergence of myeloma cells that express the APRIL receptor TACI. This may explain the relevance of the microarray signature linked to the expression of TACI. Of note, we also found that some autonomous growing cell lines use APRIL as autocrine growth factor, in particular RPMI8226 (108). Thus, an interesting analogy exists between the results for APRIL/TACI and those for the EGF family. Both are important myeloma cells growth factors, in part due to the ability of syndecan-1 to concentrate them at a high density at the myeloma cells membrane. They are mainly produced by the bone marrow environment, but in some patients, myeloma cells can acquire the ability to express them and to become progressively independent of the tumor environment.
3.3.3. GEP and the interaction of myeloma cells with bone cells
DNA microarrays can also be used to gain insight in the interaction of myeloma cells with osteoblasts, osteoclasts and bone marrow stromal cells. Comparing the expression profile of myeloma cells from patients with or without osteolytic bone lesions, DKK1 was found to be overexpressed in the first group (119). DKK1 is an inhibitor of the WNT pathway and recombinant DKK1 is able to block the differentiation of mesenchymal stem cells into osteoblasts. Of note, some WNT family members are also myeloma cells growth factors (120) and a high expression of WNT5A is often found in patients with MM and is a growth factor for myeloma cells (120, 121). Thus, an overexpression of DKK1 in myeloma cells could possibly block the activation of the WNT pathway in myeloma cells and therefore the growth of myeloma cells. DKK1- myeloma cells have a plasmablastic phenotype (119). Using ATLAS macroarrays, HMCLs were found to overexpress the FRZB/sFRP3 gene (28). FRZB/FRP3 is a decoyed receptor for members of the WNT family blocking the activation of WNT receptors, and blocking also the differentiation of MSC into osteoblasts. As FRZB/FRP3 mRNA and protein are highly expressed by myeloma cells, FRZB/FRP3 might block bone formation in MM. The EGF members could also be involved in a blockade of bone formation in MM. Indeed, amphiregulin and HB-EGF produced by myeloma cells and/or the tumor environment are able to block the differentiation of MSC into osteoblasts (122, 123). We also reported a high expression of genes which may contribute to the interactions of myeloma cells with bone cells: GAS6, legumain and cystatin C (16, 121). HMCLs expressed TYRO3 and malignant and normal plasma cells expressed the two related receptors, AXL and MERTK (see Figure 5). TYRO3 is a receptor with kinase activity, which is expressed in mature osteoclasts in the bone marrow. The ligand of these receptors is GAS6 which is produced by normal and malignant PCs (Figure 5) (16).
4. Conclusion
Microarrays are a very powerful technology and give a precise overview of the known mechanisms involved in normal B-lymphocyte and plasma cell development and their physiological interaction with other cell populations, especially the bone marrow environment. The challenge will be to integrate to our knowledge of plasma cell biology the numerous genes that microarrays detect as induced or repressed during PC differentiation and that were never before described in this differentiation pathway. Similarly, microarrays will help to investigate the biology of plasma cell dyscrasias, the complex interactions between myeloma cells and the bone marrow environment and the major mechanisms of myelomagenesis underlying the overlapping distribution of a plethora of cytogenetic aberrations. Furthermore, it is likely that using advanced biostatistic approaches, a risk classification based on the expression profiling of the myeloma clone will provide a guide for a tailored treatment targeting myeloma cells and the tumor environment.
Acknowledgments
This work was supported by grants from the Ligue Nationale Contre le Cancer (équipe labellisée), Paris, France
References
- 1.Slifka MK, Ahmed R. Long-lived plasma cells: a mechanism for maintaining persistent antibody production. Curr Opin Immunol. 1998;10:252–258. doi: 10.1016/s0952-7915(98)80162-3. [DOI] [PubMed] [Google Scholar]
- 2.Tarte K, Zhan F, De Vos J, Klein B, Shaughnessy J., Jr Gene expression profiling of plasma cells and plasmablasts: toward a better understanding of the late stages of B-cell differentiation. Blood. 2003;102:592–600. doi: 10.1182/blood-2002-10-3161. [DOI] [PubMed] [Google Scholar]
- 3.Piskurich JF, Lin KI, Lin Y, Wang Y, Ting JP, Calame K. BLIMP-I mediates extinction of major histocompatibility class II transactivator expression in plasma cells. Nat Immunol. 2000;1:526–32. doi: 10.1038/82788. [DOI] [PubMed] [Google Scholar]
- 4.Shapiro-Shelef M, Lin KI, McHeyzer-Williams LJ, Liao J, McHeyzer-Williams MG, Calame K. Blimp-1 is required for the formation of immunoglobulin secreting plasma cells and pre-plasma memory B cells. Immunity. 2003;19:607–20. doi: 10.1016/s1074-7613(03)00267-x. [DOI] [PubMed] [Google Scholar]
- 5.Shaffer AL, Lin KI, Kuo TC, Yu X, Hurt EM, Rosenwald A, et al. Blimp-1 orchestrates plasma cell differentiation by extinguishing the mature B cell gene expression program. Immunity. 2002;17:51–62. doi: 10.1016/s1074-7613(02)00335-7. [DOI] [PubMed] [Google Scholar]
- 6.Lin Y, Wong K, Calame K. Repression of c-myc transcription by Blimp-1, an inducer of terminal B cell differentiation. Science. 1997;276:596–9. doi: 10.1126/science.276.5312.596. [DOI] [PubMed] [Google Scholar]
- 7.Shaffer AL, Yu X, He Y, Boldrick J, Chan EP, Staudt LM. BCL-6 represses genes that function in lymphocyte differentiation, inflammation, and cell cycle control. Immunity. 2000;13:199–212. doi: 10.1016/s1074-7613(00)00020-0. [DOI] [PubMed] [Google Scholar]
- 8.Phan RT, Dalla-Favera R. The BCL6 proto-oncogene suppresses p53 expression in germinal-centre B cells. Nature. 2004;432:635–9. doi: 10.1038/nature03147. [DOI] [PubMed] [Google Scholar]
- 9.Fujita N, Jaye DL, Geigerman C, Akyildiz A, Mooney MR, Boss JM, et al. MTA3 and the Mi-2/NuRD complex regulate cell fate during B lymphocyte differentiation. Cell. 2004;119:75–86. doi: 10.1016/j.cell.2004.09.014. [DOI] [PubMed] [Google Scholar]
- 10.Lin KI, Angelin-Duclos C, Kuo TC, Calame K. Blimp-1-dependent repression of Pax-5 is required for differentiation of B cells to immunoglobulin M-secreting plasma cells. Mol Cell Biol. 2002;22:4771–80. doi: 10.1128/MCB.22.13.4771-4780.2002. [DOI] [PMC free article] [PubMed] [Google Scholar]
- 11.Muto A, Hoshino H, Madisen L, Yanai N, Obinata M, Karasuyama H, et al. Identification of Bach2 as a B-cell-specific partner for small maf proteins that negatively regulate the immunoglobulin heavy chain gene 3′ enhancer. Embo J. 1998;17:5734–43. doi: 10.1093/emboj/17.19.5734. [DOI] [PMC free article] [PubMed] [Google Scholar]
- 12.Lin H, Grosschedl R. Failure of B-cell differentiation in mice lacking the transcription factor EBF. Nature. 1995;376:263–7. doi: 10.1038/376263a0. [DOI] [PubMed] [Google Scholar]
- 13.Mittrucker HW, Matsuyama T, Grossman A, Kundig TM, Potter J, Shahinian A, et al. Requirement for the transcription factor LSIRF/IRF4 for mature B and T lymphocyte function. Science. 1997;275:540–543. [Google Scholar]
- 14.Corcoran LM, Hasbold J, Dietrich W, Hawkins E, Rallies A, Nutt SL, et al. Differential requirement for OBF-1 during antibody-secreting cell differentiation. J Exp Med. 2005;201:1385–96. doi: 10.1084/jem.20042325. [DOI] [PMC free article] [PubMed] [Google Scholar]
- 15.Honma S, Kawamoto T, Takagi Y, Fujimoto K, Sato F, Noshiro M, et al. Dec1 and Dec2 are regulators of the mammalian molecular clock. Nature. 2002;419:841–4. doi: 10.1038/nature01123. [DOI] [PubMed] [Google Scholar]
- 16.Tarte K, De Vos J, Thykjaer T, Zhan F, Fiol G, Costes V, et al. Generation of polyclonal plasmablasts from peripheral blood B cells: a normal counterpart of malignant plasmablasts. Blood. 2002;100:1113–22. [PubMed] [Google Scholar]
- 17.Pellat-Deceunynck C, Bataille R. Normal and malignant human plasma cells: proliferation, differentiation, and expansions in relation to CD45 expression. Blood Cells Mol Dis. 2004;32:293–301. doi: 10.1016/j.bcmd.2003.12.001. [DOI] [PubMed] [Google Scholar]
- 18.Robillard N, Pellat-Deceunynck C, Bataille R. Phenotypic characterization of the human myeloma cell growth fraction. Blood. 2005;105:4845–8. doi: 10.1182/blood-2004-12-4700. [DOI] [PubMed] [Google Scholar]
- 19.Terstappen L, Steen J, Seger-Nolten MJ, Loken MR. Identification and characterization of plasma cells in normal bone marrow by high resolution flow cytometry. 1990;9:1739–1747. [PubMed] [Google Scholar]
- 20.Mahmoud MS, Ishikawa H, Fujii R, Kawano MM. Induction of CD45 expression and proliferation in U-266 myeloma cell line by interleukin-6. Blood. 1998;92:3887–97. [PubMed] [Google Scholar]
- 21.Medina F, Segundo C, Brieva JA. Purification of human tonsil plasma cells: pre-enrichment step by immunomagnetic selection of CD31(+) cells. Cytometry. 2000;39:231–4. doi: 10.1002/(sici)1097-0320(20000301)39:3<231::aid-cyto9>3.0.co;2-g. [DOI] [PubMed] [Google Scholar]
- 22.Zhan F, Hardin J, Bumm K, Zheng M, Tian E, Crowley J, et al. Molecular Profiling of Newly Diagnosed Multiple Myeloma. Blood. 2001;98:733a. [Google Scholar]
- 23.Odendahl M, Mei H, Hoyer BF, Jacobi AM, Hansen A, Muehlinghaus G, et al. Generation of migratory antigen-specific plasma blasts and mobilization of resident plasma cells in a secondary immune response. Blood. 2005;105:1614–21. doi: 10.1182/blood-2004-07-2507. [DOI] [PubMed] [Google Scholar]
- 24.Kunkel EJ, Butcher EC. Plasma-cell homing. Nat Rev Immunol. 2003;3:822–9. doi: 10.1038/nri1203. [DOI] [PubMed] [Google Scholar]
- 25.Ma Q, Jones D, Springer TA. The chemokine receptor CXCR4 is required for the retention of B lineage and granulocytic precursors within the bone marrow microenvironment. Immunity. 1999;10:463–71. doi: 10.1016/s1074-7613(00)80046-1. [DOI] [PubMed] [Google Scholar]
- 26.Hargreaves DC, Hyman PL, Lu TT, Ngo VN, Bidgol A, Suzuki G, et al. A coordinated change in chemokine responsiveness guides plasma cell movements. J Exp Med. 2001;194:45–56. doi: 10.1084/jem.194.1.45. [DOI] [PMC free article] [PubMed] [Google Scholar]
- 27.Cyster JG. Chemokines and cell migration in secondary lymphoid organs. Science. 1999;286:2098–102. doi: 10.1126/science.286.5447.2098. [DOI] [PubMed] [Google Scholar]
- 28.De Vos J, Couderc G, Tarte K, Jourdan M, Requirand G, Delteil MC, et al. Identifying intercellular signaling genes expressed in malignant plasma cells by using complementary DNA arrays. Blood. 2001;98:771–780. doi: 10.1182/blood.v98.3.771. [DOI] [PubMed] [Google Scholar]
- 29.Wright G, Tan B, Rosenwald A, Hurt EH, Wiestner A, Staudt LM. A gene expression-based method to diagnose clinically distinct subgroups of diffuse large B cell lymphoma. Proc Natl Acad Sci U S A. 2003;100:9991–6. doi: 10.1073/pnas.1732008100. [DOI] [PMC free article] [PubMed] [Google Scholar]
- 30.Kopf M, Baumann H, Freer G, Freudenberg M, Earners M, Kishimoto T, et al. Impaired immune and acute-phase responses in interleukin-6-deficient mice. Nature. 1994;368:339–342. doi: 10.1038/368339a0. [DOI] [PubMed] [Google Scholar]
- 31.Suematsu S, Matsuda T, Aozasa K, Akira S, Nakano N, Ohno S, et al. IgG1 plasmacytosis in interleukin 6 transgenic mice. Proceedings of the National Academy of Sciences of the United States of America. 1989;86:7547–7551. doi: 10.1073/pnas.86.19.7547. [DOI] [PMC free article] [PubMed] [Google Scholar]
- 32.Jego G, Bataille R, Pellat-Deceunynck C. Interleukin-6 is a growth factor for nonmalignant human plasmablasts. Blood. 2001;97:1817–22. doi: 10.1182/blood.v97.6.1817. [DOI] [PubMed] [Google Scholar]
- 33.Seidl S, Kaufmann H, Drach J. New insights into the pathophysiology of multiple myeloma. Lancet Oncol. 2003;4:557–64. doi: 10.1016/s1470-2045(03)01195-1. [DOI] [PubMed] [Google Scholar]
- 34.Logan CY, Nusse R. The Wnt signaling pathway in development and disease. Annu Rev Cell Dev Biol. 2004;20:781–810. doi: 10.1146/annurev.cellbio.20.010403.113126. [DOI] [PubMed] [Google Scholar]
- 35.Han JH, Choi SJ, Kurihara N, Koide M, Oba Y, Roodman GD. Macrophage inflammatory protein-1 alpha is an osteoclastogenic factor in myeloma that is independent of receptor activator of nuclear factor kappaB ligand. Blood. 2001;97:3349–53. doi: 10.1182/blood.v97.11.3349. [DOI] [PubMed] [Google Scholar]
- 36.Claudio JO, Masih-Khan E, Tang H, Goncalves J, Voralia M, Li ZH, et al. A molecular compendium of genes expressed in multiple myeloma. Blood. 2002;100:2175–86. doi: 10.1182/blood-2002-01-0008. [DOI] [PubMed] [Google Scholar]
- 37.Salzer U, Chapel HM, Webster AD, Pan-Hammarstrom Q, Schmitt-Graeff A, Schlesier M, et al. Mutations in TNFRSF13B encoding TACI are associated with common variable immunodeficiency in humans. Nat Genet. 2005;37:820–8. doi: 10.1038/ng1600. [DOI] [PubMed] [Google Scholar]
- 38.Mackay F, Schneider P, Rennert P, Browning J. BAFF AND APRIL: a tutorial on B cell survival. Annu Rev Immunol. 2003;21:231–64. doi: 10.1146/annurev.immunol.21.120601.141152. [DOI] [PubMed] [Google Scholar]
- 39.O’Connor BP, Raman VS, Erickson LD, Cook WJ, Weaver LK, Ahonen C, et al. BCMA is essential for the survival of long-lived bone marrow plasma cells. J Exp Med. 2004;199:91–8. doi: 10.1084/jem.20031330. [DOI] [PMC free article] [PubMed] [Google Scholar]
- 40.Ng LG, Mackay CR, Mackay F. The BAFF/APRIL system: life beyond B lymphocytes. Mol Immunol. 2005;42:763–72. doi: 10.1016/j.molimm.2004.06.041. [DOI] [PubMed] [Google Scholar]
- 41.Moreaux J, Cremer FW, Reme T, Raab M, Mahtouk K, Kaukel P, et al. The level of TACI gene expression in myeloma cells is associated with a signature of microenvironment dependence versus a plasmablastic signature. Blood. 2005 doi: 10.1182/blood-2004-11-4512. [DOI] [PMC free article] [PubMed] [Google Scholar]
- 42.Ingold K, Zumsteg A, Tardivel A, Huard B, Steiner QG, Cachero TG, et al. Identification of proteoglycans as the APRIL-specific binding partners. J Exp Med. 2005;201:1375–83. doi: 10.1084/jem.20042309. [DOI] [PMC free article] [PubMed] [Google Scholar]
- 43.Costes V, Magen V, Legouffe E, Durand L, Baldet P, Rossi JF, et al. The Mi 15 monoclonal antibody (anti-syndecan-1) is a reliable marker for quantifying plasma cells in paraffin-embedded bone marrow biopsy specimens. Hum Pathol. 1999;30:1405–11. doi: 10.1016/s0046-8177(99)90160-0. [DOI] [PubMed] [Google Scholar]
- 44.Volpe CP, Lundgren A, Aints A, Mohamed AJ, Jaakkola P, Christensson B, et al. Proximal promoter of the murine syndecan-1 gene is not sufficient for the developmental pattern of syndecan expression in B lineage cells. Am J Hematol. 2001;67:20–6. doi: 10.1002/ajh.1071. [DOI] [PubMed] [Google Scholar]
- 45.Sun RX, Lu ZY, Wijdenes J, Brochier J, Hertog C, Rossi JF, et al. Large scale and clinical grade purification of syndecan-1+ malignant plasma cells. Journal of Immunological Methods. 1997;205:73–79. doi: 10.1016/s0022-1759(97)00056-2. [DOI] [PubMed] [Google Scholar]
- 46.Bernfield M, Gotte M, Park PW, Reizes O, Fitzgerald ML, Lincecum J, et al. Functions of cell surface heparan sulfate proteoglycans. Annu Rev Biochem. 1999;68:729–77. doi: 10.1146/annurev.biochem.68.1.729. [DOI] [PubMed] [Google Scholar]
- 47.Borset M, Hjertner O, Yaccoby S, Epstein J, Sanderson RD. Syndecan-1 is targeted to the uropods of polarized myeloma cells where it promotes adhesion and sequesters heparin-binding proteins. Blood. 2000;96:2528–36. [PubMed] [Google Scholar]
- 48.Lu Q, Gore M, Zhang Q, Camenisch T, Boast S, Casagranda F, et al. Tyro-3 family receptors are essential regulators of mammalian spermatogenesis. Nature. 1999;398:723–8. doi: 10.1038/19554. [DOI] [PubMed] [Google Scholar]
- 49.Katagiri M, Hakeda Y, Chikazu D, Ogasawara T, Takato T, Kumegawa M, et al. Mechanism of stimulation of osteoclastic bone resorption through Gas6/Tyro 3, a receptor tyrosine kinase signaling, in mouse osteoclasts. J Biol Chem. 2001;276:7376–82. doi: 10.1074/jbc.M007393200. [DOI] [PubMed] [Google Scholar]
- 50.Lu Q, Lemke G. Homeostatic regulation of the immune system by receptor tyrosine kinases of the Tyro 3 family. Science. 2001;293:306–11. doi: 10.1126/science.1061663. [DOI] [PubMed] [Google Scholar]
- 51.Angelillo-Scherrer A, de Frutos P, Aparicio C, Melis E, Savi P, Lupu F, et al. Deficiency or inhibition of Gas6 causes platelet dysfunction and protects mice against thrombosis. Nat Med. 2001;7:215–21. doi: 10.1038/84667. [DOI] [PubMed] [Google Scholar]
- 52.Lan Z, Wu H, Li W, Wu S, Lu L, Xu M, et al. Transforming activity of receptor tyrosine kinase tyro3 is mediated, at least in part, by the PI3 kinase-signaling pathway. Blood. 2000;95:633–8. [PubMed] [Google Scholar]
- 53.van Ginkel PR, Gee RL, Shearer RL, Subramanian L, Walker TM, Albert DM, et al. Expression of the receptor tyrosine kinase Axl promotes ocular melanoma cell survival. Cancer Res. 2004;64:128–34. doi: 10.1158/0008-5472.can-03-0245. [DOI] [PubMed] [Google Scholar]
- 54.Yoshida H, Matsui T, Yamamoto A, Okada T, Mori K. XBP1 mRNA is induced by ATF6 and spliced by IRE1 in response to ER stress to produce a highly active transcription factor. Cell. 2001;107:881–91. doi: 10.1016/s0092-8674(01)00611-0. [DOI] [PubMed] [Google Scholar]
- 55.Reimold AM, Iwakoshi NN, Manis J, Vallabhajosyula P, Szomolanyi-Tsuda E, Gravallese EM, et al. Plasma cell differentiation requires the transcription factor XBP-1. Nature. 2001;412:300–7. doi: 10.1038/35085509. [DOI] [PubMed] [Google Scholar]
- 56.Iwakoshi NN, Lee AH, Vallabhajosyula P, Otipoby KL, Rajewsky K, Glimcher LH. Plasma cell differentiation and the unfolded protein response intersect at the transcription factor XBP-1. Nat Immunol. 2003;4:321–9. doi: 10.1038/ni907. [DOI] [PubMed] [Google Scholar]
- 57.Shaffer AL, Shapiro-Shelef M, Iwakoshi NN, Lee AH, Qian SB, Zhao H, et al. XBP1, downstream of Blimp-1, expands the secretory apparatus and other organelles, and increases protein synthesis in plasma cell differentiation. Immunity. 2004;21:81–93. doi: 10.1016/j.immuni.2004.06.010. [DOI] [PubMed] [Google Scholar]
- 58.Lee AH, Iwakoshi NN, Glimcher LH. XBP-1 regulates a subset of endoplasmic reticulum resident chaperone genes in the unfolded protein response. Mol Cell Biol. 2003;23:7448–59. doi: 10.1128/MCB.23.21.7448-7459.2003. [DOI] [PMC free article] [PubMed] [Google Scholar]
- 59.Marciniak SJ, Yun CY, Oyadomari S, Novoa I, Zhang Y, Jungreis R, et al. CHOP induces death by promoting protein synthesis and oxidation in the stressed endoplasmic reticulum. Genes Dev. 2004;18:3066–77. doi: 10.1101/gad.1250704. [DOI] [PMC free article] [PubMed] [Google Scholar]
- 60.Bakkus MH, Heirman C, Van Riet I, Van Camp B, Thielemans K. Evidence that multiple myeloma Ig heavy chain VDJ genes contain somatic mutations but show no intraclonal variation. Blood. 1992;80:2326–2335. [PubMed] [Google Scholar]
- 61.Harousseau JL, Moreau P, Altai M, Facon T, Avet-Loiseau H. Stem-cell transplantation in multiple myeloma. Best Pract Res Clin Haematol. 2005;18:603–18. doi: 10.1016/j.beha.2005.01.005. [DOI] [PubMed] [Google Scholar]
- 62.Singhal S, Mehta J, Desikan R, Ayers D, Roberson P, Eddlemon P, et al. Antitumor activity of thalidomide in refractory multiple myeloma. N Engl J Med. 1999;341:1565–71. doi: 10.1056/NEJM199911183412102. [DOI] [PubMed] [Google Scholar]
- 63.Richardson PG, Barlogie B, Berenson J, Singhal S, Jagannath S, Irwin D, et al. A phase 2 study of bortezomib in relapsed, refractory myeloma. N Engl J Med. 2003;348:2609–17. doi: 10.1056/NEJMoa030288. [DOI] [PubMed] [Google Scholar]
- 64.Cavo M, Zamagni E, Tosi P, Tacchetti P, Cellini C, Cangini D, et al. Superiority of thalidomide and dexamethasone over vincristine-doxorubicindexamethasone (VAD) as primary therapy in preparation for autologous transplantation for multiple myeloma. Blood. 2005;106:35–9. doi: 10.1182/blood-2005-02-0522. [DOI] [PubMed] [Google Scholar]
- 65.Kyle RA, Therneau TM, Rajkumar SV, Offord JR, Larson DR, Plevak MF, et al. A long-term study of prognosis in monoclonal gammopathy of undetermined significance. N Engl J Med. 2002;346:564–9. doi: 10.1056/NEJMoa01133202. [DOI] [PubMed] [Google Scholar]
- 66.Fonseca R, Barlogie B, Bataille R, Bastard C, Bergsagel PL, Chesi M, et al. Genetics and cytogenetics of multiple myeloma: a workshop report. Cancer Res. 2004;64:1546–58. doi: 10.1158/0008-5472.can-03-2876. [DOI] [PubMed] [Google Scholar]
- 67.Pratt G. Molecular aspects of multiple myeloma. Mol Pathol. 2002;55:273–83. doi: 10.1136/mp.55.5.273. [DOI] [PMC free article] [PubMed] [Google Scholar]
- 68.Smadja NV, Bastard C, Brigaudeau C, Leroux D, Fruchart C. Hypodiploidy is a major prognostic factor in multiple myeloma. Blood. 2001;98:2229–38. doi: 10.1182/blood.v98.7.2229. [DOI] [PubMed] [Google Scholar]
- 69.Smadja NV, Leroux D, Soulier J, Dumont S, Arnould C, Taviaux S, et al. Further cytogenetic characterization of multiple myeloma confirms that 14q32 translocations are a very rare event in hyperdiploid cases. Genes Chromosomes Cancer. 2003;38:234–9. doi: 10.1002/gcc.10275. [DOI] [PubMed] [Google Scholar]
- 70.Fonseca R, Debes-Marun CS, Picken EB, Dewald GW, Bryant SC, Winkler JM, et al. The recurrent IgH translocations are highly associated with nonhyperdiploid variant multiple myeloma. Blood. 2003;102:2562–7. doi: 10.1182/blood-2003-02-0493. [DOI] [PubMed] [Google Scholar]
- 71.Wuilleme S, Robillard N, Lode L, Magrangeas F, Beds H, Harousseau JL, et al. Ploidy, as detected by fluorescence in situ hybridization, defines different subgroups in multiple myeloma. Leukemia. 2005;19:275–8. doi: 10.1038/sj.leu.2403586. [DOI] [PubMed] [Google Scholar]
- 72.Cremer FW, Bila J, Buck I, Kartal M, Hose D, Ittrich C, et al. Genes Chromosomes Cancer. 2005. Delineation of distinct subgroups of multiple myeloma and a model for clonal evolution based on interphase cytogenetics. [DOI] [PubMed] [Google Scholar]
- 73.Garand R, Avet-Loiseau H, Accard F, Moreau P, Harousseau JL, Bataille R. t(11;14) and t(4;14) translocations correlated with mature lymphoplasmacytoid and immature morphology, respectively, in multiple myeloma. Leukemia. 2003;17:2032–5. doi: 10.1038/sj.leu.2403091. [DOI] [PubMed] [Google Scholar]
- 74.Moreau P, Facon T, Leleu X, Morineau N, Huyghe P, Harousseau JL, et al. Recurrent 14q32 translocations determine the prognosis of multiple myeloma, especially in patients receiving intensive chemotherapy. Blood. 2002;100:1579–83. doi: 10.1182/blood-2002-03-0749. [DOI] [PubMed] [Google Scholar]
- 75.Gertz MA, Lacy MQ, Dispenzieri A, Greipp PR, Litzow MR, Henderson KJ, et al. Clinical implications of t(11;14)(q13;q32), t(4;14)(p16.3;q32), and -17p13 in myeloma patients treated with high-dose therapy. Blood. 2005 doi: 10.1182/blood-2005-04-1411. [DOI] [PMC free article] [PubMed] [Google Scholar]
- 76.Bergsagel PL, Chesi M, Nardini E, Brents LA, Kirby SL, Kuehl WM. Promiscuous translocations into immunoglobulin heavy chain switch regions in multiple myeloma. Proceedings of the National Academy of Sciences of the United States of America. 1996;93:13931–13936. doi: 10.1073/pnas.93.24.13931. [DOI] [PMC free article] [PubMed] [Google Scholar]
- 77.Gertz MA, Lacy MQ, Dispenzieri A, Greipp PR, Litzow MR, Henderson KJ, et al. Clinical implications of t(11;14)(q13;q32), t(4;14)(p16.3;q32), and -17p13 in myeloma patients treated with high-dose therapy. Blood. 2005 doi: 10.1182/blood-2005-04-1411. [Epub ahead of print] [DOI] [PMC free article] [PubMed] [Google Scholar]
- 78.Kroger N, Schilling G, Einsele H, Liebisch P, Shimoni A, Nagler A, et al. Deletion of chromosome band 13q14 as detected by fluorescence in situ hybridization is a prognostic factor in patients with multiple myeloma who are receiving allogeneic dose-reduced stem cell transplantation. Blood. 2004;103:4056–61. doi: 10.1182/blood-2003-12-4435. [DOI] [PubMed] [Google Scholar]
- 79.Drach J, Ackermann J, Fritz E, Kromer E, Schuster R, Gisslinger H, et al. Presence of a p53 gene deletion in patients with multiple myeloma predicts for short survival after conventional-dose chemotherapy. Blood. 1998;92:802–809. [PubMed] [Google Scholar]
- 80.Chang H, Qi C, Yi QL, Reece D, Stewart AK. p53 gene deletion detected by fluorescence in situ hybridization is an adverse prognostic factor for patients with multiple myeloma following autologous stem cell transplantation. Blood. 2005;105:358–60. doi: 10.1182/blood-2004-04-1363. [DOI] [PubMed] [Google Scholar]
- 81.Zhan F, Hardin J, Kordsmeier B, Bumm K, Zheng M, Tian E, et al. Global gene expression profiling of multiple myeloma, monoclonal gammopathy of undetermined significance, and normal bone marrow plasma cells. Blood. 2002;99:1745–57. doi: 10.1182/blood.v99.5.1745. [DOI] [PubMed] [Google Scholar]
- 82.Zhan F, Tian E, Bumm K, Smith R, Barlogie B, Shaughnessy J., Jr Gene expression profiling of human plasma cell differentiation and classification of multiple myeloma based on similarities to distinct stages of late-stage B-cell development. Blood. 2003;101:1128–40. doi: 10.1182/blood-2002-06-1737. [DOI] [PubMed] [Google Scholar]
- 83.Harousseau JL, Shaughnessy J, Jr, Richardson P. Multiple myeloma. Hematology (Am Soc Hematol Educ Program) 2004:237–56. doi: 10.1182/asheducation-2004.1.237. [DOI] [PubMed] [Google Scholar]
- 84.Chesi M, Bergsagel PL, Kuehl WM. The enigma of ectopic expression of FGFR3 in multiple myeloma: a critical initiating event or just a target for mutational activation during tumor progression. Curr Opin Hematol. 2002;9:288–93. doi: 10.1097/00062752-200207000-00005. [DOI] [PubMed] [Google Scholar]
- 85.Santra M, Zhan F, Tian E, Barlogie B, Shaughnessy J., Jr A subset of multiple myeloma harboring the t(4;14)(p16;q32) translocation lacks FGFR3 expression but maintains an IGH/MMSET fusion transcript. Blood. 2003;101:2374–6. doi: 10.1182/blood-2002-09-2801. [DOI] [PubMed] [Google Scholar]
- 86.Bergsagel PL, Kuehl WM, Zhan F, Sawyer J, Barlogie B, Shaughnessy J., Jr Cyclin D dysregulation: an early and unifying pathogenic event in multiple myeloma. Blood. 2005;106:296–303. doi: 10.1182/blood-2005-01-0034. [DOI] [PMC free article] [PubMed] [Google Scholar]
- 87.Hose D, Rossi JF, Ittrich C, DeVos J, Benner A, Reme T, et al. A New Molecular Classification of Multiple Myeloma Using Gene Expression Profiling and Fluorescence In Situ Hybridisation as Predictor for Event Free Survival. Blood. 2004;104(Abstract 73) [Google Scholar]
- 88.Shaughnessy J, Jacobson J, Sawyer J, McCoy J, Fassas A, Zhan F, et al. Continuous absence of metaphase-defined cytogenetic abnormalities, especially of chromosome 13 and hypodiploidy, ensures long-term survival in multiple myeloma treated with Total Therapy I: interpretation in the context of global gene expression. Blood. 2003;101:3849–56. doi: 10.1182/blood-2002-09-2873. [DOI] [PubMed] [Google Scholar]
- 89.Cremer FW, De Vos J, Hose D, Rossi JF, Ittrich C, Reme T, et al. Multiple myeloma: global expression profiling indicates upregulation of the ribosomal machinery in hyperdiploid clones. Blood. 2004;1004(abstract 1421) [Google Scholar]
- 90.Greipp PR, Katzmann JA, ‘Fallen WM, Kyle RA. Value of beta 2-microglobulin level and plasma cell labeling indices as prognostic factors in patients with newly diagnosed myeloma. 1988;72:219–223. [PubMed] [Google Scholar]
- 91.Gu ZJ, De Vos J, Rebouissou C, Jourdan M, Zhang XG, Rossi JF, et al. Agonist anti-gp130 transducer monoclonal antibodies are human myeloma cell survival and growth factors. Leukemia. 2000;14:188–97. doi: 10.1038/sj.leu.2401632. [DOI] [PubMed] [Google Scholar]
- 92.Dankbar B, Padro T, Leo R, Feldmann B, Kropff M, Mesters RM, et al. Vascular endothelial growth factor and interleukin-6 in paracrine tumor-stromal cell interactions in multiple myeloma. Blood. 2000;95:2630–6. [PubMed] [Google Scholar]
- 93.Vacca A, Ribatti D, Presta M, Minischetti M, Iurlaro M, Ria R, et al. Bone marrow neovascularization, plasma cell angiogenic potential, and matrix metalloproteinase-2 secretion parallel progression of human multiple myeloma. Blood. 1999;93:3064–73. [PubMed] [Google Scholar]
- 94.Uchiyama H, Barut BA, Mohrbacher AF, Chauhan D, Anderson KC. Adhesion of human myeloma-derived cell lines to bone marrow stromal cells stimulates interleukin-6 secretion. Blood. 1993;82:3712–3720. [PubMed] [Google Scholar]
- 95.Hideshima T, Chauhan D, Richardson P, Mitsiades C, Mitsiades N, Hayashi T, et al. NF-kappa B as a therapeutic target in multiple myeloma. J Biol Chem. 2002;277:16639–47. doi: 10.1074/jbc.M200360200. [DOI] [PubMed] [Google Scholar]
- 96.Yaccoby S, Wezeman MJ, Henderson A, Cottler-Fox M, Yi Q, Barlogie B, et al. Cancer and the microenvironment: myeloma-osteoclast interactions as a model. Cancer Res. 2004;64:2016–23. doi: 10.1158/0008-5472.can-03-1131. [DOI] [PubMed] [Google Scholar]
- 97.Hurt EM, Wiestner A, Rosenwald A, Shaffer AL, Campo E, Grogan T, et al. Overexpression of c-maf is a frequent oncogenic event in multiple myeloma that promotes proliferation and pathological interactions with bone marrow stroma. Cancer Cell. 2004;5:191–9. doi: 10.1016/s1535-6108(04)00019-4. [DOI] [PubMed] [Google Scholar]
- 98.Vande Broek I, Asosingh K, Vanderkerken K, Straetmans N, Van Camp B, Van Riet I. Chemokine receptor CCR2 is expressed by human multiple myeloma cells and mediates migration to bone marrow stromal cell-produced monocyte chemotactic proteins MCP-1, -2 and -3. Br J Cancer. 2003;88:855–62. doi: 10.1038/sj.bjc.6600833. [DOI] [PMC free article] [PubMed] [Google Scholar]
- 99.Abe M, Hiura K, Wilde J, Moriyama K, Hashimoto T, Ozaki S, et al. Role for macrophage inflammatory protein (MIP)-1 alpha and MIP-1beta in the development of osteolytic lesions in multiple myeloma. Blood. 2002;100:2195–202. [PubMed] [Google Scholar]
- 100.Van Riet I, Vanderkerken K, de Greef C, Van Camp B. Homing behaviour of the malignant cell clone in multiple myeloma. Med Oncol. 1998;15:154–64. doi: 10.1007/BF02821934. [DOI] [PubMed] [Google Scholar]
- 101.Vande Broek I, Asosingh K, Allegaert V, Leleu X, Facon T, Vanderkerken K, et al. Bone marrow endothelial cells increase the invasiveness of human multiple myeloma cells through upregulation of MMP-9: evidence for a role of hepatocyte growth factor. Leukemia. 2004;18:976–82. doi: 10.1038/sj.leu.2403331. [DOI] [PubMed] [Google Scholar]
- 102.Klein B, Tarte K, Jourdan M, Mathouk K, Moreaux J, Jourdan E, et al. Survival and proliferation factors of normal and malignant plasma cells. International Journal of Hematology. 2003;78:106–113. doi: 10.1007/BF02983377. [DOI] [PMC free article] [PubMed] [Google Scholar]
- 103.Kawano M, Hirano T, Matsuda T, Taga T, Horii Y, Iwato K, et al. Autocrine generation and essential requirement of BSF-2/IL-6 for human multiple myeloma. Nature. 1988;332:83–85. doi: 10.1038/332083a0. [DOI] [PubMed] [Google Scholar]
- 104.Klein B, Zhang XG, Jourdan M, Content J, Houssiau F, Aarden L, et al. Paracrine rather than autocrine regulation of myeloma-cell growth and differentiation by interleukin-6. Blood. 1989;73:517–526. [PubMed] [Google Scholar]
- 105.Portier M, Rajzbaum G, Zhang XG, Altai M, Rusalen C, Wijdenes J, et al. In vivo interleukin 6 gene expression in the tumoral environment in multiple myeloma. Eur J Immunol. 1991;21:1759–62. doi: 10.1002/eji.1830210727. [DOI] [PubMed] [Google Scholar]
- 106.Klein B, Jourdan M, De Vos J, Mathouk K, Moreaux J, Tarte K, et al. Survival and proliferation factors of human myeloma cells. In: Bergsagel PL, Kuehl M, editors. Recent Advances in the Biology of Multiple Myeloma. Humana Press; 2003. [Google Scholar]
- 107.Mahtouk K, Jourdan M, De Vos J, Hertogh C, Fiol G, Jourdan E, et al. An inhibitor of the EGF receptor family blocks myeloma cell growth factor activity of HB-EGF and potentiates dexamethasone or anti-IL-6 antibody-induced apoptosis. Blood. 2004;103:1829–37. doi: 10.1182/blood-2003-05-1510. [DOI] [PMC free article] [PubMed] [Google Scholar]
- 108.Moreaux J, Legouffe E, Jourdan E, Quittet P, Reme T, Lugagne C, et al. BAFF and APRIL protect myeloma cells from apoptosis induced by interleukin 6 deprivation and dexamethasone. Blood. 2004;103:3148–57. doi: 10.1182/blood-2003-06-1984. [DOI] [PMC free article] [PubMed] [Google Scholar]
- 109.Wang YD, De Vos J, Jourdan M, Couderc G, Lu ZY, Rossi JF, et al. Cooperation between heparin-binding EGF-like growth factor and interleukin-6 in promoting the growth of human myeloma cells. Oncogene. 2002;21:2584–2592. doi: 10.1038/sj.onc.1205355. [DOI] [PubMed] [Google Scholar]
- 110.Harris RC, Chung E, Coffey RJ. EGF receptor ligands. Exp Cell Res. 2003;284:2–13. doi: 10.1016/s0014-4827(02)00105-2. [DOI] [PubMed] [Google Scholar]
- 111.Graus-Porta D, Beerli RR, Daly JM, Hynes NE. ErbB-2, the preferred heterodimerization partner of all ErbB receptors, is a mediator of lateral signaling. Embo J. 1997;16:1647–55. doi: 10.1093/emboj/16.7.1647. [DOI] [PMC free article] [PubMed] [Google Scholar]
- 112.Mahtouk K, Hose D, Reme T, De Vos J, Jourdan M, Moreaux J, et al. Expression of EGF-family receptors and amphiregulin in multiple myeloma. Amphiregulin is a growth factor for myeloma cells. Oncogene. 2005;24:3512–24. doi: 10.1038/sj.onc.1208536. [DOI] [PMC free article] [PubMed] [Google Scholar]
- 113.Klein B, Hose D, Mahtouk K, De Vos J, Reme T, Moos M, et al. Identification of intercellular communication signals involved in multiple myeloma with microarrays. Haematologica/the hematology journal. 2005;100 [Google Scholar]
- 114.Qiu Y, Ravi L, Kung HJ. Requirement of ErbB2 for signalling by interleukin-6 in prostate carcinoma cells. Nature. 1998;393:83–5. doi: 10.1038/30012. [DOI] [PubMed] [Google Scholar]
- 115.Badache A, Hynes NE. Interleukin 6 inhibits proliferation and, in cooperation with an epidermal growth factor receptor autocrine loop, increases migration of T47D breast cancer cells. Cancer Res. 2001;61:383–91. [PubMed] [Google Scholar]
- 116.Walters DK, French JD, Arendt BK, Jelinek DF. Atypical expression of ErbB3 in myeloma cells: cross-talk between ErbB3 and the interferon-alpha signaling complex. Oncogene. 2003;22:3598–607. doi: 10.1038/sj.onc.1206512. [DOI] [PubMed] [Google Scholar]
- 117.Albanell J, Gascon P. Small molecules with EGFR-TK inhibitor activity. Curr Drug Targets. 2005;6:259–74. doi: 10.2174/1389450053765888. [DOI] [PubMed] [Google Scholar]
- 118.Novak AJ, Darce JR, Arendt BK, Harder B, Henderson K, Kindsvogel W, et al. Expression of BCMA, TACI, and BAFF-R in multiple myeloma: a mechanism for growth and survival. Blood. 2004;103:689–94. doi: 10.1182/blood-2003-06-2043. [DOI] [PubMed] [Google Scholar]
- 119.Tian E, Zhan F, Walker R, Rasmussen E, Ma Y, Barlogie B, et al. The role of the Wnt-signaling antagonist DKK1 in the development of osteolytic lesions in multiple myeloma. N Engl J Med. 2003;349:2483–94. doi: 10.1056/NEJMoa030847. [DOI] [PubMed] [Google Scholar]
- 120.Derksen PW, Tjin E, Meijer HP, Klok MD, MacGillavry HD, van Oers MH, et al. Illegitimate WNT signaling promotes proliferation of multiple myeloma cells. Proc Natl Acad Sci U S A. 2004;101:6122–7. doi: 10.1073/pnas.0305855101. [DOI] [PMC free article] [PubMed] [Google Scholar]
- 121.De Vos J, Thykjaer-Andersen T, Tarte K, Ensslen M, Raynaud P, Requirand G, et al. Comparison of gene expression profiling between malignant and normal plasma cells with oligonucleotide arrays. Oncogene. 2002;21:6848–6857. doi: 10.1038/sj.onc.1205868. [DOI] [PubMed] [Google Scholar]
- 122.Krampera M, Pasini A, Rigo A, Scupoli MT, Tecchio C, Malpeli G, et al. HB-EGF/HER-1 signaling in bone marrow mesenchymal stem cells: inducing cell expansion and reversibly preventing multilineage differentiation. Blood. 2005;106:59–66. doi: 10.1182/blood-2004-09-3645. [DOI] [PubMed] [Google Scholar]
- 123.Qin L, Tamasi J, Raggatt L, Li X, Feyen JH, Lee DC, et al. Amphiregulin is a novel growth factor involved in normal bone development and in the cellular response to parathyroid hormone stimulation. J Biol Chem. 2005;280:3974–81. doi: 10.1074/jbc.M409807200. [DOI] [PubMed] [Google Scholar]