Abstract
Osteoblasts respond to repetitive strain by activating stretch-activated, nonselective cation channels (SA-CAT) and increasing matrix protein production. SA-CAT channels are thought to be responsible for mechano-transduction in osteoblasts, although the molecular identity of the SA-CAT channel has previously been unknown. We have demonstrated that both the UMR-106 osteoblast-like cell line and human osteoblasts in primary culture express the α-subunit of the epithelial sodium channel (α-ENaC). The ENaC gene product is closely related to a class of proteins that confer touch sensitivity to Caenorhabditis elegans and are referred to as degenerins. A cDNA clone was obtained of the entire coding region of rat α-ENaC (α-rENaC). Sequence analysis indicated that the osteoblast clone’s sequence was identical to that originally cloned from rat colon. The α-rENaC cDNA was cloned into an expression plasmid and transfected into LM(TK−) cells, a null cell for SA-CAT activity. Stable transfectants expressed mRNA and the expected 74-kDa protein corresponding to α-rENaC. Reconstitution of α-rENaC resulted in the expression of a 24.2 ± 1.0 psec SA-CAT channel (PNa:PK = 1.1 ± 0.1). The channel is calcium permeable (PNa:PCa = 1.4 ± 0.1) and highly selective for cations over anions (PNa:PCl ≫ 20). The channel is only active after negative pressure is applied to cell attached patches, cell swelling, or patch excision. These results represent the first heterologous expression of an SA-CAT channel in a mammalian cell system and provide evidence that the ENaC/degenerin family of proteins are capable of mediating both transepithelial sodium transport and are involved in signal transduction by mechano-sensitive cells such as osteoblasts.
Stretch-activated cation channels (SA-CAT) have been described in a number of tissues including Xenopus oocyte (1), Xenopus muscle (2), skeletal muscle (3), smooth muscle cells (4), tumor cells (5, 6), various epithelial cells (7–12), endothelial cells (13), and osteoblasts (14–16). These channels typically have a medium conductance of 20–40 psec, are nonselective for monovalent cations, and undergo an increase in channel open probability (Po) with increased mechanical strain (for a complete review see ref. 17). SA-CAT channels mediate a variety of functions in mechanically sensitive cells. However, the molecular identity of these SA-CAT has not been elucidated.
Osteoblasts, the cells responsible for synthesizing new bone matrix proteins, are mechano-sensitive cells and respond to chronic intermittent mechanical strain by increasing their rate of mitosis and reorienting themselves within the applied strain field (18). Chronic intermittent mechanical strain causes osteoblasts to increase production of bone matrix proteins, including type I collagen (19), and leads to increased SA-CAT Po and increased sensitivity to activation by strain (15). The SA-CAT of the osteoblast has been characterized previously (14–16) and has been shown to be partially dependent on the expression and function of the α1C-subunit of the l-type, voltage-activated calcium channel (16).
We have been interested in determining the molecular identity of the SA-CAT of the osteoblast and recently became aware of the similarity in base pair sequence of the α-subunit of the rat epithelial sodium channel (α-rENaC) cloned from colon (20) and degenerins, a class of proteins that confer touch sensitivity to Caenorhabditis elegans (21–23). Even more recently the α-subunit of the bovine epithelial sodium channel (α-bENaC) has been shown to exhibit a pressure-induced increase in Po when inserted into lipid bilayers and subjected to a hydrostatic pressure gradient (24). We have examined the possibility that a similar gene may encode the SA-CAT channel in osteoblast cells. We have determined that an mRNA identical to α-rENaC is expressed by osteoblasts. This study was done to determine if the gene product homologous to α-rENaC was capable of expressing functional SA-CAT similar to those described previously in osteoblasts.
MATERIALS AND METHODS
Cell Culture.
UMR-106.01 cells (passages 12–18) and LM(TK−)cells were grown in Dulbecco’s modified Eagle’s medium (DMEM; GIBCO) with 10% fetal bovine serum (FBS) in tissue culture flasks (Becton Dickinson). Cells were fed twice weekly and maintained in a humidified atmosphere of 95% air/5% CO2 at 37°C.
Primary cultures of human bone marrow stromal cells (HBMC) were prepared as described by Cheng et al. (25). Briefly, bone marrow was harvested from surgical specimens of human ribs within 1 hr of the surgical procedure. Mononuclear cells were isolated from adipocytes, fat tissue, granulocytes, and red blood cells by centrifugation. Cells were seeded in tissue culture flasks at a density of 4 × 10⁵ cells per cm2 in α-minimum essential medium containing 10% heat-inactivated FBS and allowed to attach undisturbed at 37°C in an atmosphere of 95% air/5% CO2. At confluence, bone marrow stromal cells were passed one time to increase cell number and harvested for isolation of poly(A+) RNA.
Reverse Transcription (RT)–PCR of α-rENaC.
Poly(A+) RNA (1 μg) purified from UMR-106.01 cells or primary HBMC was reverse-transcribed with SUPERSCRIT II RT (GIBCO/BRL) using oligo(dT) primer. The first-strand cDNAs were amplified by PCR with primers specific for both the α-rENaC cDNA (20) and the human α-subunit cDNA (α-hENaC) (26). For the F1 fragment (see Results and Fig. 1), the primers were 5′-TGAGCCTGCCTTTATGGATGAT-3′ (base pairs 1233–1254, sense) and 5′-CACTGGCTGCCCAGGTTGGA-3′ (base pairs 1807–1826, antisense). These primers were also used to detect the human F1 fragment in HBMC. For the PF fragment (see Results and Fig. 1), the primers were 5′-ATGATGCTGGACCACACCAGA-3′ (base pairs 79–99, sense) and 5′-GCGACAGGTGAAGATGAAGTTGCC-3′ (base pairs 988-1011, antisense). PCR amplification was carried out for 30 cycles at 94°C, 56°C, and 72°C for 1 min during each cycle. The products (PF and F1 fragments) of the PCR reactions were cloned into the PCR II vector (Invitrogen) (TA/PF and TA/F1) and sequenced.
Figure 1.
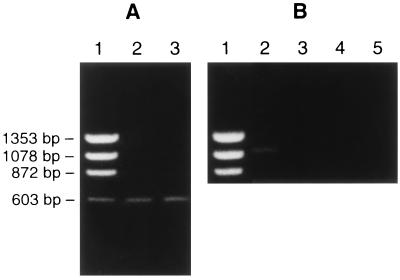
Analysis of RT-PCR products from UMR-106.01 cells and primary cultures of HBMC indicating the presence or absence of expression of α-, β-, or γ-ENaC mRNA. (A) Lanes: 1, DNA molecular weight markers; 2, expected 0.6-kb α-rENaC product from UMR-106.01 cell RNA; 3, expected 0.6-kb α-hENaC product from HBMC RNA. (B) Lanes: 1, DNA molecular weight markers; 2, expected 1.1-kb β-rENaC product from UMR-106.01 cell RNA; 3, no RT control for β-rENaC product from UMR-106.01 cell RNA; 4, negative result for the expected 1.1-kb γ-rENaC product from UMR-106.01; 5, no RT control for γ-rENaC product from UMR-106.01 cell RNA.
RT-PCR of the β- and γ-Subunits.
Poly(A+) RNA (1 μg) was reverse-transcribed with SUPERSCRIT II RT (GIBCO/BRL) using oligo(dT) primer. The first-strand cDNAs were amplified by PCR with primers specific for the rat and human cDNAs (27, 28). For the β-subunit, the rat primers were 5′-TCCTAGCCTGTCTGTTTTGGAACG-3′ (base pairs 1803–1826, sense) and 5′-CAGAGTCTGTTGGTCAGGGGTAGACCC-3′ (base pairs 1872–1898, antisense) and the human primers were 5′-AACTGGGGCATGACAGAGAAGGCAC-3′(base pairs 826–850, sense) and 5′-CCCATCCAGAAGCCAAACTGGCCA-3′ (base pairs 1569–1592, antisense). For the γ-subunit, the rat primers were 5′-CTTCGATGGGATGTCCTGTGATGCC-3′ (base pairs 884–908, sense) and 5′-CAGAGCTGGATTATCCTGGCCTTGCC-3′ (base pairs 1864–1889, antisense) and the human primers were 5′-GGAATCAATGCCATCCAGGAGTGGT-3′ (base pairs 686–710, sense) and 5′-CATCTCAATACTGTTGGCTGGGCTC-3′ (base pairs 1576–1600, antisense). PCR amplification was carried out for 30 cycles at 94°C and 56°C for 1 min and 72°C for 2 min during each cycle. The products of the PCR reactions were cloned into the PCR II vector (Invitrogen) and sequenced.
cDNA Library Screening.
A UMR-106.01 cDNA library cloned into the ZAPII vector (Stratagene) was plated and 5 × 10⁵ plaques were transferred to nitrocellulose filters (Schleicher & Schuell). The filters were hybridized overnight with the F1 fragment, which was labeled by random priming with 32P[dCTP] (3000 Ci/mmol; 1 Ci = 37 GBq; Amersham) in the hybridization buffer [2× pipes buffer (0.8 M NaCl/20 mM pipes, pH 6.5)/50% formamide/0.5% SDS/100 μg/ml sonicated salmon sperm DNA (Sigma)] at 42°C. The filters were washed 2 times for 15 min in 2× SSC/0.1% SDS at room temperature and 2 times for 30 min in 0.2× SSC/0.5% SDS at 60°C. The filters were exposed to Kodak Omat X-AR film at −70°C. Positive plaques on duplicate filters were picked and rescreened resulting in the isolation of clone B (CB) from the library. The pBluescript SK/CB (pSK/CB) was excised for sequencing.
Preparation of Transfection Vector.
TA/PF was digested with NotI and XbaI to create 0.9- and 3.9-kb fragments. The pSK/CB was digested with NotI and XbaI to make 0.4- and 4.4-kb fragments. The 0.9 kb of the TA/PF fragment and the 4.4-kb fragment of pSK/CB were ligated together by T4 DNA ligase to form the pSK/α-rENaC plasmid. The pSK/α-rENaC contained the full-length coding region of α-rENaC cDNA. pSK/α-rENaC was digested with EcoRV to cut the full-length coding region of α-rENaC cDNA out of the pSK vector. The EcoRV fragment encompassed the full-length coding region of the α-rENaC cDNA and was cloned into the expression vector pCEP4 (Invitrogen) using XhoI site as a cloning site, which was filled in by Klenow enzyme to create a blunt-end site. The pCEP4/α-rENaC plasmid was sequenced.
Expression of α-rENaC in LM(TK−).
LM(TK−) cells were seeded at a density of about 30% confluence and were transfected on following day with either the pCEP4 plasmid or the pCEP4/α-rENaC plasmid using Transfectam (Promega) according the manufacturer’s instructions. Cells that expressed the transfected gene were selected with hygromycin B (Boehringer Mannheim) at a final concentration of 600 μg/ml in the culture medium. Cells were seeded in 6-well culture plates coated with type I collagen (Flexcell International, McKeesport, PA) for patch-clamp experiments.
Northern Blot Analysis.
Poly(A+) RNA was isolated from LM/α-rENaC cells and LM/pCEP4 cells with the mini-ribosep mRNA isolation kit (Collaborative Biomedical Products, Bedford, MA). RNA was electrophoresed on a 1% denaturing formaldehyde agarose gel and transferred to a Nytran membrane (Schleicher & Schuell). The RNA membrane was hybridized with EcoRV fragment of α-rENaC cDNA (corresponding to the full-length coding region of α-rENaC cDNA), which was labeled by random priming with 32P[dCTP] (Amersham) in hybridization buffer [50% formamide/6× SSPE/10× Denhardt’s solution/0.5% SDS/1 × background quencher (Tel-Test, Friendswood, TX)] overnight at 42°C. The membrane was washed 2 times for 15 min in 2× SSC/0.1% SDS at room temperature and 2× for 30 min in 0.2× SSC/0.1% SDS at 60°C. The membrane was exposed to Kodak Omat X-AR film at −70°C.
Western Blot Analysis.
UMR-106.01, LM/α-rENaC, and LM/pCEP4 cells were first washed twice with PBS and then lysed in sample buffer [62.5 mM Tris, pH 6.8/10% glycerol (wt/vol)/2% SDS/2.5 mM EDTA/2.5 mM EGTA/100 mM DTT/0.001% bromophenol blue]. The cell lysates were boiled for 10 min and pelleted in a microcentrifuge for 10 min at 4°C. The supernatants were collected. Protein concentrations were determined with a Bio-Rad assay kit (Bio-Rad). Protein (100 μg) was loaded in each lane and separated on SDS/8% PAGE gel. The gel was then electroblotted to a polyvinylidene difluoride membrane (Millipore) by wet–dry transfer (Enprotech, Natick, MA). Nonspecific protein binding was blocked with 5% nonfat dry milk powder dissolved in PBS. The blot was incubated for 3 hr with a 1:1000 dilution of a primary polyclonal antibody to α-rENaC, which was generously provided by Peter Smith (29). Immunoreactivity was detected with peroxidase-conjugated goat anti-rabbit IgG at a 1:1000 dilution (Sigma). The immune complex was visualized by an enhanced chemiluminescence detection kit (Amersham) following the manufacturer’s instructions.
Patch-Clamp Protocols.
Single-channel and whole-cell current signals were amplified with a List EPC-7 patch-clamp amplifier (Adams-List, Westbury, NY), filtered at 1 kHz with an 8-pole Bessel filter (Frequency Devices, Haverhille, MA). A Digidata 1200 interface (Axon Instruments, Foster City, CA) was used to digitize the filtered signal at 2 kHz and data were stored on the hard drive of a 386DX computer (Dell Computers, Austin, TX). Data were acquired and analyzed using the pClamp 6 software suite (Axon Instruments). All experiments were done at room temperature.
The current–voltage analysis protocol consisted of holding inside-out patches at a pipet potential of +70 mV and stepping from +100 to −100 mV in 10-mV steps. Each voltage was held for 4 sec. During the first 2-sec period, no suction was applied to the pipet and during the last 2-sec period of each voltage step −40 mmHg suction was applied to the pipet. In between voltage steps the patch was held at +70 mV without suction for 2 sec. Current transitions were measured and plotted against the concurrent holding voltage.
For whole-cell recordings the nystatin perforated patch technique was used to measure whole cell currents under voltage-clamp conditions. We added nystatin (400 μg/ml) to a pipette solution containing: 12 mM NaCl, 64 mM KCl, 28 mM K2SO4, 47 mM sucrose, 1 mM MgCl2, 0.5 mM EGTA, 20 mM Hepes (pH 7.3) during sonication to solubilize the nystatin in aqueous solution. Pipets were frontfilled with nystatin-free solution and backfilled with the nystatin mixture to permeabilize cell-attached patches. This concentration of nystatin consistently provided access resistances of <50 MΩ within 20–30 min of seal formation. We selected cells in confluent colonies for patching. Negative cell polarization, the persistence of a large capacitive current spike in response to a 20-mV voltage pulse at the end of the experiment, and the ability to reseal the patch in the outside-out configuration were used as criteria to confirm that the perforated patch configuration remained intact throughout the experimental period. Prior to data collection the membrane capacitance and series pipet resistance were compensated. The current–voltage analysis protocol consisted of holding the nystatin perforated patches at a pipet potential of −20 mV and stepping from −100 to +100 mV in 10-mV steps. Each voltage was held for 4 sec. In between voltage steps the patch was held at −20 mV for 2 sec. Currents measured during the final 2 sec of each voltage step were averaged and plotted against the concurrent holding voltage. Data are expressed as mean ± SEM.
RESULTS
We used the RT-PCR on poly(A+) RNA from UMR-106.01 cells and HBMC to determine if α-rENaC and α-hENaC mRNA could be detected. A PCR fragment (Fig. 1A) of the expected size (0.6 kb) was obtained for the α-subunit from both rat and human osteoblast cells. Both rat and human PCR fragments were subsequently sequenced and found to be identical to previously cloned rat and human α-subunits, respectively (20, 26). We further examined UMR-106.01 cells and HBMC for the presence of the β- and γ-subunits of rENaC and hENaC. A PCR fragment was obtained for the β-subunit from UMR-106.01 cells of the expected size (Fig. 1B, 1.1 kb) and was subsequently sequenced and found to be identical to the previously cloned rat β-subunit (20). However, no product of the expected 0.91-kb size for the β-subunit was detected in HBMC (data not shown). No evidence for expression of the γ-subunit was found in either UMR-106.01 cells (Fig. 1B) or HBMC (data not shown). To confirm that the human β-subunit primers were effective in producing PCR products, they were tested on the UMR-106.01 cells. The human primer sequences were chosen to be 100% homologous with both the rat and human published sequences. With these primers we also obtained bands of the expected molecular weight for β-rENaC from the UMR-106.01 cells. We feel, therefore, that species-specific sequence differences of the primers were unlikely to have caused the negative result for β-ENaC in the human cells. Based on these results, we decided to concentrate our efforts on the cloning and expression of the α-subunit, since it was expressed in both primary cultures of HBMC and in UMR-106.01 cells.
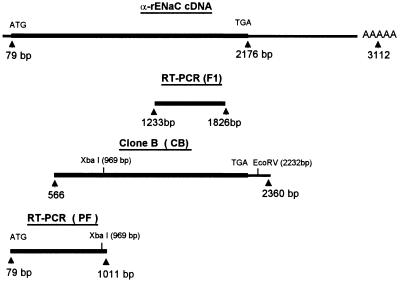
The F1 PCR fragment (Fig. 2) was ligated into the PCR II vector for sequencing. The sequence of the F1 fragment was identical to the α-rENaC cDNA sequence (20). To obtain the full-length coding region of α-rENaC cDNA, a UMR-106.01 cDNA library was screened using the F1 fragment as a probe. A positive clone (Fig. 2, clone B) consisted of the sequence from 566-2360 bp, but was missing the 5′ end of the α-rENaC cDNA. The clone of the 5′ end of α-rENaC (Fig. 2, PF) was obtained using RT-PCR from UMR-106.01 cells poly(A+) RNA.
Figure 2.
Schematic maps of α-rENaC cDNA, cDNA cloned from a UMR-106.01 cDNA library, and RT-PCR fragments from UMR-106.01 poly(A) RNA. Numbering of bases is according to α-rENaC cDNA (20). Thick lines indicate the coding region and thin lines indicate the untranslated region. Restriction enzymes are illustrated by the smaller text above the bars, with the site of cleavage indicated by a base pair number in parentheses.
To obtain the full-length cDNA coding region, the cloned PF and B fragments were digested by restriction enzymes and ligated together. The α-rENaC cDNA was sequenced and inserted into the pCEP4 expression vector to construct pCEP4/α-rENaC plasmid. The entire α-rENaC cDNA coding region from the UMR-106.01 cell line was identical to the α-rENaC cDNA originally cloned from rat colon (20). Plasmids of pCEP4 and pCEP4/α-rENaC were transfected separately into LM(TK−) cells. LM(TK−) is a mouse fibroblast cell line in which no functional SA-CAT activity was observed in any of 30 normal and pCEP4-transfected cells tested. Cells transfected with pCEP4 only were designated LM/pCEP4 and those transfected with α-rENaC were designated LM/α-rENaC.
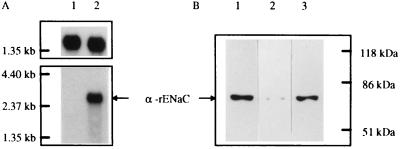
Expression of α-rENaC messenger RNA was verified by Northern blotting of mRNA from LM/α-rENaC cells and was absent from the parent LM(TK−) cells or LM/pCEP4 cells (Fig. 3A). Expression of the α-rENaC protein was verified by Western blot analysis, which indicated an ≈74-kDa protein (Fig. 3B), consistent with predicted size of α-rENaC protein previously cloned from rat taste cells and expressed in HEK-293 cells (30). Both UMR-106.01 cells and LM/α-rENaC cells had a much higher expression of the 74-kDa protein than did LM/pCEP4 cells (Fig. 3B), although the latter did express trace levels of an immunoreactive protein of similar molecular weight.
Figure 3.
(A) Northern blot analysis of α-rENaC mRNA expression. Each lane contained 2 μg of poly(A+) RNA. Lane 1, LM/pCEP4 cells; lane 2, LM/α-rENaC cells. Molecular mass markers are shown on left. Membrane was first hybridized with α-rENaC cDNA probe (Lower). The same membrane was stripped and reprobed with glyceraldehyde phosphate dehydrogenase cDNA (Upper) to verify equal mRNA loading. (B) Immunoblot analysis for α-rENaC protein in UMR-106.01 cells (lane 1), LM/pCEP4 cells (lane 2), and LM/α-rENaC cells (lane 3). Molecular mass markers are shown on right.
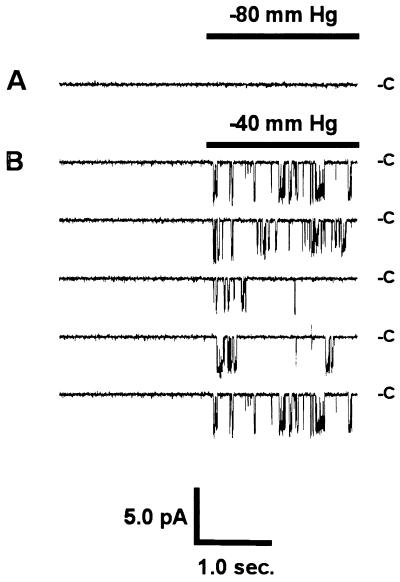
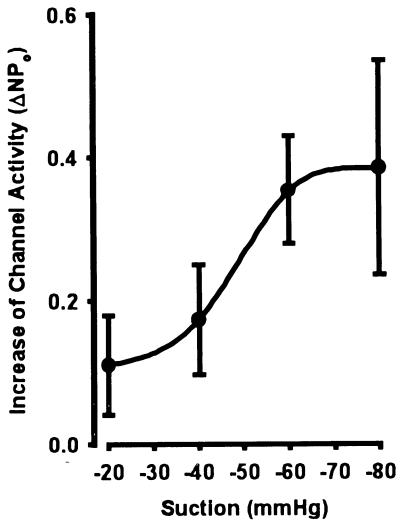
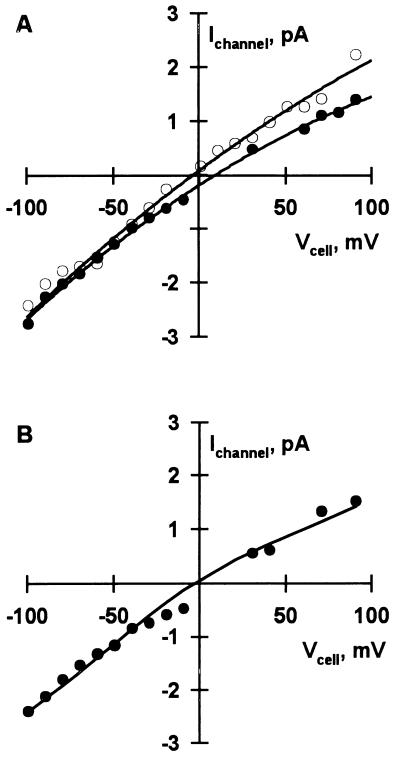
To characterize the biophysical properties of the expressed protein, ion channels were studied in LM/pCEP4 and LM/α-rENaC cells using patch clamp techniques. No SA-CAT activity was observed in 30-cell attached patches of parent LM cells or LM/pCEP4 cells subjected to pulses of negative pressure up to −90 mmHg (Fig. 4A). However, stretch-activated channel activity was observed in 23 of 79 patches (P < 0.0005) of LM/α-rENaC cells (Fig. 4B). Po of the reconstituted channels was increased in a graded manner with increased negative pressure on the pipet (Fig. 5). Po was increased by a maximum of 0.39 ± 0.15 (n = 5, P < 0.05) at −80 mmHg. After observing stretch-activated ion channels in a cell attached patch, the patch was excised to the inside-out configuration and subjected to asymmetrical solutions so current–voltage (I–V) plots could be constructed to determine the ion selectivity of the channels. Expressed α-rENaC channels had a conductance of 24.2 ± 1.0 pS (n = 10) when activated in symmetrical NaCl Ringer’s solutions (Fig. 6A). The permeability of expressed channels to Na+ when bathed with symmetrical NaCl solutions was 4.8 × 10⁻⁸ ± 0.5 × 10⁻⁸ cm/sec (n = 5). The permeability to Na+ decreased to 2.9 × 10⁻⁸ ± 0.2 × 10⁻⁸ cm/sec (P < 0.05, n = 3) with 75 mM Ca2+ bathing the cytosolic side of the membrane. Expressed α-rENaC channels were nonselective with regard to Na+ and K+ (PNa:PK of 1.1 ± 0.1, n = 5) (Fig. 6A). The stretch-activated α-rENaC channel was highly selective for cations with a PNa:PCl > 20 (Fig. 6A). We calculated a PNa:PCa of 1.4 ± 0.1 (n = 3) for expressed α-rENaC (Fig. 6B) indicating that the channel is capable of conducting calcium currents.
Figure 4.
(A) Single-channel current records from cell-attached patches of LM(TK−) fibroblasts. In the parent cell line and LM/pCEP4 transfected cells no SA-CAT activity was observed at negative pressures from 0 mmHg to −90 mmHg. (B) LM/α-rENaC cells expressed SA-CAT channel activity at negative pipet pressures greater than −30 mmHg. Records shown were recorded sequentially during a 2-sec on/2-sec off square wave pulse of regulated negative pressure applied to the patch pipet through a computer-controlled solenoid valve. Current level measured when channels were closed is indicated by C and downward deflections indicate individual channel openings. The patch was hyperpolarized by 50 mV relative to the cell.
Figure 5.
Increase in channel activity in cell-attached patches of LM/α-rENaC transfected cells plotted as a function of negative pipet pressure. Data were calculated by comparing NPo before and after a 2-sec square wave pulse of regulated negative pressure applied to the patch pipet through a computer-controlled solenoid valve. Patches (n = 15) were hyperpolarized by 50 mV relative to the cell. All increases of NPo were significantly different from control (P < 0.05).
Figure 6.
Typical current–voltage (I–V) plots of single channels observed in LM/α-rENaC cells. Pipet solution was constant throughout experiment and contained: 142 mM NaCl, 5.5 mM KCl, 1 mM MgCl2, 2 mM EGTA, 8 mM Hepes (pH 7.4). Data were fit to a modified GHK equation (34), which permitted calculation of PNa and selectivity ratios for K+, Ca2+, and Cl−. (A) Open circles represent single-channel currents obtained with a bath solution containing: 144 mM KCl, 1 mM MgCl2, 10 mM Hepes (pH 7.3). Note that the reversal potential near 0 mV indicates a selectivity ratio, PNa:PK ≈ 1. Solid circles represent single-channel currents obtained with a bath solution containing: 65 mM NaCl, 5.5 mM KCl, 1 mM MgCl2, 1 mM CaCl2, 2 mM EGTA, 154 mM mannitol, 8 mM Hepes (pH 7.4). Note that the reversal potential shift to more positive potentials was nearly equal to the theoretical limit of 17 mV indicating a cation-selective channel, PNa:PCl > 20. (B) I–V plot obtained with a bath solution containing: 75 mM CaCl2, 5.5 mM KCl, 1 mM MgCl2, 60 mM mannitol, 8 mM Hepes (pH 7.4). The channel had a PNa = 2.7 × 10⁻⁸ cm/sec and a PNa:PCa = 1.2.
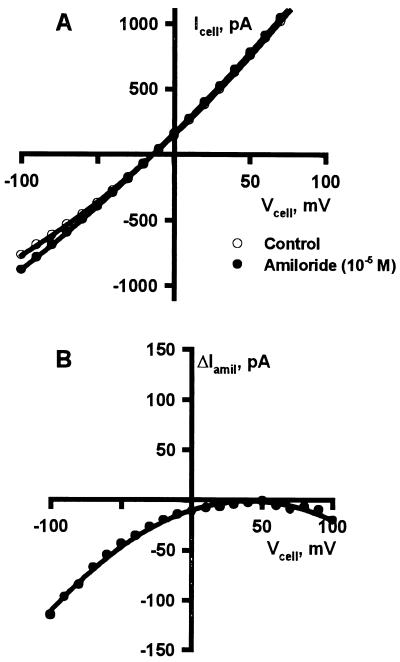
The epithelial sodium channel is inhibited by submicromolar concentrations of the diuretic amiloride (31, 32). To test for amiloride-sensitive currents in LM/α-rENaC cells we swelled cells while maintaining nystatin-perforated patches. When plasma membrane conductance reached a steady-state subsequent to swelling, amiloride (10 μM) was added. In three of six cells tested an apparent voltage-dependent amiloride block was observed (Fig. 7), which represented 15 ± 6% of total cell conductance. In the remainder of the LM/α-rENaC cells and all LM/pCEP4 and LM(TK)− control cells, no significant amiloride-inhibitable current was observed. Amiloride was not added prior to swelling because single-channel studies had shown that SA-CAT does not contribute significantly to the basal conductance of nonstretched cells. Furthermore, the amiloride-sensitive component of whole cell conductance is small enough to require paired measurements for detection given the variability of whole-cell conductance between individual cells.
Figure 7.
Representative I–V plots of amiloride-sensitive, whole-cell currents observed in LM/α-rENaC cells. (A) I–V plots of whole-cell currents prior to (open circles) and after (solid circles) exposure to amiloride. (B) Plot of the difference in current at each voltage in A to illustrate the voltage-dependent block observed. Cells were swollen by exposure to a 185 mOsm/kg bath solution containing: 65 mM NaCl, 5.5 mM KCl, 1 mM MgCl2, 1 mM CaCl2, 2 mM EGTA, 30 mM mannitol, 8 mM Hepes (pH 7.4). After the swelling-induced increase in cell conductance reached steady-state values and control I–V curves were recorded, amiloride (10 μM) was added. I–V relations recorded after addition of amiloride were subtracted from control curves and the resulting difference plots are illustrated.
DISCUSSION
These data show that osteoblast-like osteosarcoma cells (UMR-106.01) and primary cultures of HBMC express a protein with identical primary sequence to the α-subunit of the epithelial sodium channel expressed in rats and humans, respectively. Furthermore, we have demonstrated through functional expression of the protein in fibroblasts, that it manifests itself as a SA-CAT on the plasma membrane. The epithelial sodium channel is normally expressed as a hetero-multimer, presumably made up of three homologous subunits α, β, and γ (27). When these subunits have been coexpressed in Xenopus oocytes they combine to form a plasma membrane channel that is highly selective for sodium over potassium and monovalent cations over anions (27). The heteromeric protein also exhibits the slow gating kinetics with mean open and mean closed times as long as several seconds and a low conductance (≈4 ps) characteristic of the epithelial sodium channel described in a number of epithelial tissues and cell lines (27). However, when α-rENaC is expressed alone forming monomeric or homo-multimeric channels or is expressed with either one but not both of the other subunits, the biophysical properties are greatly different from those of the hetero-multimeric sodium selective channel. When rENaC expression is deficient in either or both of the β- or γ-subunits, no appreciable amiloride-sensitive current is observed (27). Therefore, it is not surprising that we have not observed channels resembling the phenotype of the epithelial sodium channel in osteoblasts or the LM/α-rENaC cells. The stoichiometry of α-, β-, and γ-subunit combination is unknown for the hetero-multimeric channel. If heterogeneity exists among channels with regard to the stoichiometry of subunit combination, it may be possible for a number of channel phenotypes to be observed in tissues expressing one or more of the known subunits including, but not limited, to the phenotype described here for monomeric or homo-multimeric channels made up entirely of the α-subunit.
When α-bENaC is inserted into artificial lipid bilayers without the β- and γ-subunits it exhibits characteristics very similar to those of SA-CAT described in a number of tissues (17, 24). Notably, there was a striking similarity between the SA-CAT observed in LM/α-rENaC cells and the stretch-activated and swelling-activated channels found in the osteoblast-like cells of the UMR-106.01 cell line. Expressed α-rENaC channels had a conductance of 24 psec compared with 28 psec for the swelling-activated osteoblast channel (16). A similar conductance was also reported for the SA-CAT in osteoblasts subjected to chronic intermittent mechanical strain (15). Both the α-rENaC channel and the stretch-activated channel from osteoblasts were nonselective with regard to Na+ and K+ (14–16). The primary difference in ion selectivity was that whereas the osteoblast swelling-activated channel had low selectivity for cations over anions of ≈6:1 (16), the α-rENaC channel was nearly ideally selective for cations with a PNa:PCl > 20. The high selectivity for cations over anions is however similar to that previously reported for the SA-CAT of osteoblasts (14, 16). Both the stretch-activated and swelling-activated channels of osteoblasts are permeable to calcium as were reconstituted α-rENaC channels, which had a PCa similar to that reported for the swelling-activated channel of the osteoblast (16). However, the permeability of α-rENaC channels to Na+ was reduced in the presence of high calcium concentrations unlike that of the swelling-activated channel of osteoblasts. While we recognize that the effects of 75 mM Ca2+ on sodium permeability may not be indicative of physiological regulation, the data are presented to illustrate a biophysical difference between the expressed channel and the swelling-activated channel native to osteoblast cells.
To begin to examine the effects of multiple subunit coexpression we have cloned and coexpressed the α- and β-subunits from UMR-106.01 cells in LM(TK−) fibroblasts and, in preliminary experiments, found no differences in channel properties from those where the α-subunit was expressed alone. Therefore, it appears that the β-subunit does not change the ability of the α-subunit to stretch-activate. More work will be required to determine exactly what role the β- and γ-subunits play in the determination of channel phenotype.
The epithelial sodium channel is inhibited by sub-micromolar concentrations of the diuretic amiloride (31, 32), whereas mechano-sensitive channels are inhibited by amiloride concentrations of from 50 μM to 1 mM (32). Preliminary experiments indicated a small (≈5%) amiloride-sensitive current across the plasma membranes of osteoblasts subjected to membrane strain by hypotonic swelling. When LM/α-rENaC cells were swelled, we observed that amiloride (10 μM) produced a voltage-dependent decrease in plasma membrane conductance in some but not all cells tested. We chose the 10-μM concentration because the native epithelial sodium channel would be completely blocked at this concentration with minimal effect on other cellular processes. However, when α-bENaC was studied in lipid bilayers the concentration of amiloride required for one-half maximal inhibition of the channel was found to be 25 μM (24). The affinity of stretched α-bENaC for amiloride is therefore much closer to that of the mechano-sensitive channel of cochlear hair cells and Xenopus oocytes than that of the epithelial sodium channel (22). If α-rENaC has a similar sensitivity when expressed in LM/α-rENaC cells, we would expect only about 20% inhibition of channel activity, producing minimal inhibition of total plasma membrane conductance (24). We chose not to use a higher concentration amiloride because it has been shown to enter cells and have a multiplicity of effects (32, 33). Heterogeneous expression of α-rENaC within the population of LM/α-rENaC cells may have contributed to the inconsistency of the amiloride block since we could not correlate the α-rENaC expression level of individual cells with the cells amiloride-sensitive current. We conclude that the SA-CAT channels observed in LM/α-rENaC cells are subject to a voltage-sensitive block by amiloride, which is illustrated by the rectification of the amiloride-sensitive currents illustrated in Fig. 7B. Amiloride has been shown to block the epithelial sodium channel by voltage-sensitive binding to the channel protein (31, 32). Note that a similar rectification would occur under the conditions of our experiment if the amiloride-sensitive conductance was sodium selective. We interpret the rectification of the whole-cell currents as due only to a voltage-dependent block by amiloride, because we have observed no sodium selective channels in single-channel patches of LM(TK−), LM/pCEP4, or LM/α-rENaC cells. These data indicate that expression of cloned α-rENaC channels from osteoblasts, like α-bENaC channels observed in artificial lipid bilayers (24), reconstitute functional stretch-activated ion channels.
We have demonstrated that the biophysical properties of expressed osteoblast α-rENaC channels measured in LM/α-rENaC cells are indistinguishable from the SA-CAT channels described in osteoblasts. These results represent the first identification at the molecular level and reconstitution of a SA-CAT from a mechano-sensitive mammalian cell, and they provide evidence that the ENaC/degenerin family of proteins are not only capable of mediating transepithelial sodium transport but are involved in signal transduction by mechano-sensitive cells such as osteoblasts. The SA-CAT of the osteoblast is regulated by membrane strain and participates in signal transduction pathways leading to regulation of bone growth. More generally, ENaC may be implicated as a multipurpose channel, which not only mediates sodium transport in epithelial tissues but may also transduce mechanical signals in other cell types for such purposes as initiating volume regulatory responses and sensing fluid flow-through transduction of membrane strain created by fluid shear at the surfaces of epithelial and nonepithelial cells. The molecular manipulation of this channel may provide insight into the developmental and disease processes of bone growth in humans as well as mechano-sensitive mechanisms of nonosteogenic tissues.
Acknowledgments
We thank Ulises Alvarez for his excellent technical assistance, Dr. Nicola Partridge for providing the UMR-106.01 cell cDNA library, Dr. Peter Smith for providing the antibody used in the Western blots for α-rENaC, and Dr. Bruce Stanton for valuable discussions pertaining to this manuscript. This work was supported by a grant from the Monsanto Corporation and the National Institutes of Health (AR 39561) to K.A.H.
Footnotes
Abbreviations: SA-CAT, stretch-activated cation channel; ENaC, epithelial sodium channel; rENaC, rat epithelial sodium channel; bENaC, bovine epithelial sodium channel; hENaC, human epithelial sodium channel; HBMC, human bone marrow stromal cells; LM/pCEP4, LM(TK)− mouse fibroblast cell line transfected with the empty pCEP4 vector; LM/α-rENaC, LM(TK)− mouse fibroblast cell line transfected with the α-subunit of the rat epithelial sodium channel; RT, reverse transcription.
References
- 1.Yang X, Sachs F. Science. 1989;243:1068–1071. doi: 10.1126/science.2466333. [DOI] [PubMed] [Google Scholar]
- 2.Brehm P, Kullberg R, Moody-Corbett F. J Physiol (London) 1984;350:631–648. doi: 10.1113/jphysiol.1984.sp015222. [DOI] [PMC free article] [PubMed] [Google Scholar]
- 3.Guharay F, Sachs F. J Physiol (London) 1984;352:685–701. doi: 10.1113/jphysiol.1984.sp015317. [DOI] [PMC free article] [PubMed] [Google Scholar]
- 4.Kirber M T, Walsh J V, Singer J J. Pflügers Arch. 1988;412:339–345. doi: 10.1007/BF01907549. [DOI] [PubMed] [Google Scholar]
- 5.Falke L, Misler S. Proc Natl Acad Sci USA. 1989;86:3919–3923. doi: 10.1073/pnas.86.10.3919. [DOI] [PMC free article] [PubMed] [Google Scholar]
- 6.Christensen O, Hoffmann E. J Membr Biol. 1992;129:13–36. doi: 10.1007/BF00232052. [DOI] [PubMed] [Google Scholar]
- 7.Christensen O. Nature (London) 1987;330:66–68. doi: 10.1038/330066a0. [DOI] [PubMed] [Google Scholar]
- 8.Cooper K E, Tang J M, Rae J L, Eisenberg R S. J Membr Biol. 1986;93:259–269. doi: 10.1007/BF01871180. [DOI] [PubMed] [Google Scholar]
- 9.Ubl J, Murer H, Kolb H A. J Membr Biol. 1988;104:223–232. doi: 10.1007/BF01872324. [DOI] [PubMed] [Google Scholar]
- 10.Hurst A, Hunter M. J Physiol (London) 1990;430:13–24. doi: 10.1113/jphysiol.1990.sp018278. [DOI] [PMC free article] [PubMed] [Google Scholar]
- 11.Hunter M. Pflügers Arch. 1990;416:448–453. doi: 10.1007/BF00370753. [DOI] [PubMed] [Google Scholar]
- 12.Filipovic D, Sackin H. Am J Physiol. 1991;260:F119–F129. doi: 10.1152/ajprenal.1991.260.1.F119. [DOI] [PubMed] [Google Scholar]
- 13.Lansman J, Hallam T, Rink T. Nature (London) 1987;325:811–813. doi: 10.1038/325811a0. [DOI] [PubMed] [Google Scholar]
- 14.Duncan R, Misler S. FEBS Lett. 1989;251:17–21. doi: 10.1016/0014-5793(89)81420-6. [DOI] [PubMed] [Google Scholar]
- 15.Duncan R, Hruska K. Am J Physiol. 1994;267:F909–F916. doi: 10.1152/ajprenal.1994.267.6.F909. [DOI] [PubMed] [Google Scholar]
- 16.Duncan R, Kizer N L, Barry E L, Friedman P A, Hruska K A. Proc Natl Acad Sci USA. 1996;93:1864–1869. doi: 10.1073/pnas.93.5.1864. [DOI] [PMC free article] [PubMed] [Google Scholar]
- 17.Sackin H. In: Cellular and Molecular Physiology of Cell Volume Regulation. Strange K, editor. Ann Arbor, MI: CRC; 1994. pp. 215–240. [Google Scholar]
- 18.Buckley M J, Banes A J, Levin L G, Sumpio B E, Sato M, Jordan R, Gilbert J, Link G W, Tran Son Tay R. Bone Miner. 1988;4:225–236. [PubMed] [Google Scholar]
- 19.Harter L, Hruska K, Duncan R. Endocrinology. 1994;136:1–7. doi: 10.1210/endo.136.2.7530647. [DOI] [PubMed] [Google Scholar]
- 20.Lingueglia E, Voilley N, Waldmann R, Lazdunski M, Barbry P. FEBS Lett. 1993;318:95–99. doi: 10.1016/0014-5793(93)81336-x. [DOI] [PubMed] [Google Scholar]
- 21.Canessa C M, Horisberger J, Rossier B D. Nature (London) 1993;361:467–470. doi: 10.1038/361467a0. [DOI] [PubMed] [Google Scholar]
- 22.Palmer L G. News Physiol Sci. 1995;10:61–67. [Google Scholar]
- 23.Chalfie M, Driscoll M, Huang M. Nature (London) 1993;361:504. doi: 10.1038/361504a0. [DOI] [PubMed] [Google Scholar]
- 24.Awayda M S, Ismailov I I, Berdiev B K, Benos D J. Am J Physiol Cell Physiol. 1995;268:C1450–C1459. doi: 10.1152/ajpcell.1995.268.6.C1450. [DOI] [PubMed] [Google Scholar]
- 25.Cheng S, Yang J W, Rifas L, Zhang S, Avioli L V. Endocrinology. 1994;134:277–285. doi: 10.1210/endo.134.1.8275945. [DOI] [PubMed] [Google Scholar]
- 26.McDonald F J, Snyder P M, McCray P B, Welsh M J. Am J Physiol Lung Cell Mol Physiol. 1994;266:L728–L734. doi: 10.1152/ajplung.1994.266.6.L728. [DOI] [PubMed] [Google Scholar]
- 27.Canessa C M, Schild L, Buell G, Thorens B, Gautschi I, Horisberger J-D, Rossier B C. Nature (London) 1994;367:463–467. doi: 10.1038/367463a0. [DOI] [PubMed] [Google Scholar]
- 28.McDonald F J, Price M P, Snyder P M, Welsh M J. Am J Physiol Cell Physiol. 1995;268:C1157–C1163. doi: 10.1152/ajpcell.1995.268.5.C1157. [DOI] [PubMed] [Google Scholar]
- 29.Smith P R, Bradford A L, Dantzer V, Benos D J, Skadhauge E. Cell Tissue Res. 1993;272:121–136. doi: 10.1007/BF00323578. [DOI] [PubMed] [Google Scholar]
- 30.Li X-J, Xu R-H, Guggino W B, Snyder S H. Mol Pharmacol. 1995;47:1133–1140. [PubMed] [Google Scholar]
- 31.Smith P R, Benos D J. Annu Rev Physiol. 1991;53:509–530. doi: 10.1146/annurev.ph.53.030191.002453. [DOI] [PubMed] [Google Scholar]
- 32.Hamill O P, Lane J W, McBride D W. Trends Pharmacol. 1992;13:3–6. doi: 10.1016/0165-6147(92)90115-m. [DOI] [PubMed] [Google Scholar]
- 33.Frelin C, Vigne P, Barbry P, Lazdunski M. Kidney Int. 1987;32:785–793. doi: 10.1038/ki.1987.277. [DOI] [PubMed] [Google Scholar]
- 34.Lewis C A. J Physiol (London) 1979;286:417–445. doi: 10.1113/jphysiol.1979.sp012629. [DOI] [PMC free article] [PubMed] [Google Scholar]


