

Abstract
Mammalian soluble epoxide hydrolase (sEH) represents a highly promising new target for drug development. Chemical inhibition of this enzyme in animal models was shown to treat hypertension and vascular inflammation as well as related syndromes. Existing sEH inhibitors are relatively potent and specific. However, the low solubility and relatively fast metabolism of described sEH inhibitors make them less than therapeutically efficient, stating the need for novel inhibitor structures. Therefore, a series of α-cyanoester and α-cyanocarbonate epoxides were evaluated as potential human sEH (HsEH) substrates for the high-throughput screen (HTS) of compound libraries. (3-Phenyl-oxiranyl)-acetic acid cyano-(6-methoxy-naphthalen-2-yl)-methyl ester (PHOME), which displayed the highest aqueous stability and solubility, was selected for the development of an HTS assay with long incubation times at room temperature. Concentrations of HsEH and PHOME were optimized to ensure assay sensitivity, reliability, and reproducibility. Assay validation, which employed these optimized concentrations, resulted in good accuracy (60–100%) and high precision (<7% relative standard deviation). In addition, an overall Z′ value of 0.7 proved the system’s robustness and potential for HTS. The developed assay system will be a valuable tool to discover new structures for the therapeutic inhibition of sEH to treat various cardiovascular diseases.
Keywords: Soluble epoxide hydrolase inhibition, α-Cyanoester, High-throughput screen, Fluorescent assay
Soluble epoxide hydrolase (sEH, EC 3.3.3.2)1 catalyzes the addition of a water molecule to an epoxide resulting in the corresponding diol [1]. Endogenous substrates for sEH include epoxyeicosatrienoic acids (EETs), which are known for their vasodilatory effects as well as for their antiinflammatory actions [2–5]. Recent results indicate the potential of this enzyme as a novel drug target by means of its chemical inhibition leading to the accumulation of EETs and other lipid epoxides in the organism. sEH inhibition experiments in rodent models have shown a successful treatment of hypertension [6–8] and inflammatory diseases [9,10] as well as protection against renal damage caused by hypertension [8,11]. Furthermore, sEH inhibition was suggested as potential therapy for ischemic stroke [12].
Highly potent and selective inhibitors for sEH were developed in our laboratory [13–18] and used to describe the biology associated with sEH [5,19]. Although medicinal chemistry approaches were used to increase their inhibitory activity and solubility [16–18], the latest compounds reported still do not possess physical properties to produce a successful pharmaceutical [20]. For example, the sEH inhibitor AUDA (12-[3-adamantane-1-yl-ureido]-dodecanoic acid) is only 30% orally available and thus can work only with careful formulation. This is due to less than optimal pharmacokinetic properties [21]. Thus, although sEH urea-based inhibitors are good in vitro and are valuable experimental tools, they should be improved toward higher biological availability and stability for possible future orally administered in vivo drugs. Therefore, there is a need for novel sEH inhibitor structures and optimized urea, amide, and carbamate inhibitors.
To select structures leading to potent sEH inhibitors, it is necessary to develop a robust and sensitive enzymatic screening tool. A 96-well plate spectrophotometric assay was used to develop the first generation of sEH inhibitors; however, this assay was not sensitive enough to distinguish among the best compounds, and the instability of the corresponding substrate requires short incubation times [13,15,22]. In addition, several radiochemical and chromatographic assays were developed [23]. Unfortunately, they are too slow and labor intensive to screen large compound libraries. To obtain higher sensitivity and a rapid response, we recently reported a series of novel fluorescent substrates and the development of a rapid kinetic fluorescent assay for sEH inhibition [24]. The reaction mechanism of these initially nonfluorescent structures is based on the hydrolysis of their epoxide moiety by the enzyme, followed by an intra-molecular cyclization, and resulting in the release of a cyanohydrin (Fig. 1). Under basic conditions, the cyanohydrin rapidly decomposes into a cyanide ion as well as the highly fluorescent 6-methoxy-2-naphthaldehyde, which is characterized by a large Stoke’s shift. This assay is approximately two orders of magnitude more sensitive than the previous spectrophotometric assay [24]. Although this later assay is very useful to measure inhibition potency quickly and sensitively, it does not allow the screen of a compound library in a high-throughput screen (HTS) manner because of the relatively low solubility and stability of the substrate. Therefore, we report here the development of a fluorescent endpoint assay with long incubation times at room temperature conditions for human soluble epoxide hydrolase (HsEH).
Fig. 1.
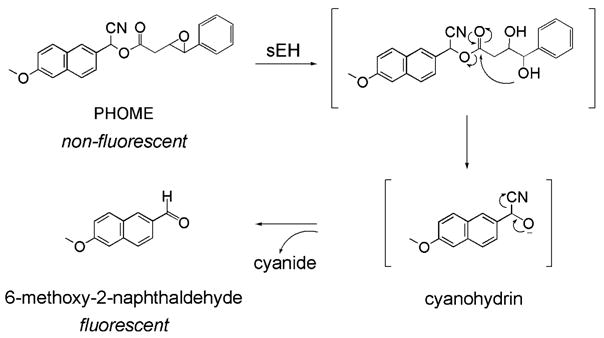
Reaction mechanism of (3-phenyl-oxiranyl)-acetic acid cyano-(6-methoxy-naphthalen-2-yl)-methyl ester (PHOME) with sEH. This compound was selected as substrate for the long-term fluorescent endpoint assay developed in the current study.
Materials and methods
Enzymes and reagents
Recombinant HsEH was produced, purified, analyzed, and quantified as described previously [25,26]. All chemicals and reagents were purchased from Sigma Chemical (St. Louis, MO, USA) unless otherwise indicated. Fluorescent substrates were synthesized as described by Jones and coworkers [24]. 6-Methoxy-2-naphthaldehyde was purchased from Avocado Research Chemicals (Heysham, UK). Inhibitors were made previously in the laboratory [13,15]. For both substrates and inhibitors, 100× solutions in dimethyl sulfoxide (DMSO) were prepared and kept at −20 °C until used.
Determination of aqueous solubility, aqueous stability, and Michaelis–Menten parameters
Aqueous solubility and Michaelis–Menten parameters of all fluorescent sEH substrates were determined and carried out as described previously [24]. In brief, aqueous solubility was determined by adding varying concentrations of substrate in DMSO to 25mM BisTris–HCl buffer (pH 7.0) containing 0.1 mg/ml bovine serum albumin (BSA) in a final ratio of 1:99 (v/v). Insolubility of the inhibitor was indicated by the increase in turbidity of the water solution. The turbidity was measured as absorbance at 800 nm on a SpectraMax 340PC384 microplate reader (Molecular Devices, Sunnyvale, CA, USA) at 30 °C. Experiments to determine Michaelis–Menten parameters were carried out by testing a constant HsEH concentration with various final substrate concentrations in 25 mM BisTris–HCl buffer (pH 7.0) containing 0.1 mg/ml BSA. Enzyme concentrations were 9.4, 2.8, 9.4, 2.8, 141.7, 2.8, 5.7, and 5.7 nM for substrates 2 through 9 (cf. Table 1), respectively. Fluorescence was monitored for 10min every 30 s with a SpectraFluor Plus fluorescent plate reader (Tecan Systems, San Jose, CA, USA) using the following settings: excitation wavelength, 330 nm (bandwidth, 20nm); emission wavelength, 465 nm (bandwidth, 20nm); manual gain, 60; integration time, 40 μs; number of flashes, 3; temperature, 30 °C. Linear regression analyses were performed to calculate initial velocities (υ). Lineweaver–Burk transformation of the resulting data was carried out. Subsequent linear regression analysis of seven data points supported the calculation of the desired Michaelis–Menten parameters. Buffer-catalyzed hydrolysis rates, and thus aqueous stabilities, were determined by means of a SpectraFluor Plus fluorescent plate reader. This instrument monitored the appearance of 6-methoxy-2-naphthaldehyde for 10min every 30s employing the above-described settings. For this purpose, 1-mM DMSO stock solutions of all compounds were diluted 1:99 (v/v) with 25 mM BisTris–HCl buffer (pH 7.0) containing 0.1 mg/ml BSA, and 200μl of the resulting mixtures was examined in 30 replicates. Subsequently, hydrolysis rates were calculated by linear regression analyses.
Table 1.
Ranges for apparent limit of solubility, autohydrolysis rates, and kcat/Km ratios of Xuorescent substrates for sEH in aqueous solution
| Substrate
|
Apparent limit of solubility (μM) | Autohydrolysis rate (pmol min−1) | HsEH kcat/Km (s−1 μM−1) | |
|---|---|---|---|---|
| Structure | #a | |||
|
|
2 | 25 < LS < 50 | 5.0 ± 0.3 | 0.093 ± 0.007 |
|
3 | 50 < LS < 75 | 1.6 ± 0.4 | 0.115 ± 0.004 |
|
|
4 | 25 < LS < 50 | 1.8 ± 0.4 | 0.027 ± 0.001 |
|
|
5 | 25 < LS < 50 | 2.1 ± 0.4 | 0.194 ± 0.009 |
|
|
6 | 25 < LS < 50 | 2.0 ± 0.4 | 0.00119 ± 0.00002 |
|
|
7 | 15 < LS < 25 | 3.6 ± 0.7 | 0.556 ± 0.073 |
|
|
8 | 25 < LS < 50 | 6.4 ± 0.3 | 0.554 ± 0.018 |
|
|
9 | 15 < LS < 25 | 2.3 ± 0.1 | 0.387 ± 0.084 |
Note. Apparent limit of solubility (LS) was determined by photometric turbidity analysis at 800 nm. Autohydrolysis rates of 10-μM substrate solutions are given as averages ± standard deviations (n = 30). SpeciWcity constants kcat/Km values are provided as means ± standard deviations (n = 3).
Substrate numbers (#) correspond to those in Jones and coworkers [24].
Endpoint assay optimization
Optimization of the endpoint assay was performed with techniques similar to those described for a kinetic assay employing sEH [24]. A checkerboard assay, which tested combinations of several final concentrations of (3-phenyl-oxiranyl)-acetic acid cyano-(6-methoxy-naphthalen-2-yl)-methyl ester (PHOME, 15–50 μM) and serial dilutions of HsEH (0–0.33μg/well) in 25mM BisTris–HCl buffer (pH 7.0) containing 0.1 mg/ml BSA, was carried out. Enzyme and substrate concentrations, optimized for a signal/background ratio of 4–5 and the lowest possible protein concentrations to enhance assay sensitivity, were confirmed in quadruplicate. Appearance of the reporter molecule 6-methoxy-2-naphthaldehyde was detected at room temperature for 2 h every 3 min with a SpectraMax M2 microplate reader (Molecular Devices) and the following instrumental settings: excitation wavelength, 316nm; emission wavelength, 460nm (cutoff, 455nm); number of reads per well, 3. The excitation and emission maxima of 6-methoxy-2-naphthaldehyde were determined earlier by the same plate reader under assay conditions.
Inhibitor assays
Inhibitors were tested for their IC50 values with the fluorescent endpoint assay system and compared with similar data generated by the method of Jones and coworkers [24]. Therefore, PHOME at a final concentration of 50 μM (final DMSO content/well was 1%) and apparently homogeneous HsEH at 3 nM were employed under room temperature conditions. Prior to the addition of substrate, inhibitors were incubated with the enzyme for 10 min. Fluorescence measurements were obtained on a SpectraMax M2 microplate reader with the above-mentioned settings in two different ways. For one set of experiments, single endpoint readings were taken after a 60-min reaction time in darkness (n ≥25); for the other set of experiments, fluorescence monitoring was carried out for 60 min every 3 min (n = 3). IC50 values were determined by linear regression analyses employing at least three replicated data points at different concentrations in the linear range of the resulting inhibition curve (between 20 and 80% enzyme activity reduction).
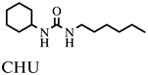
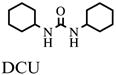
In addition, assay validation for the endpoint assay system was performed. Therefore, inhibitors at single concentrations as well as their carrier DMSO were incubated individually for 10 min with HsEH as described above (n = 4). Final concentrations of inhibitors were 10 μM CEU (1-cyclohexyl-3-ethyl urea), 0.1 μM CHU (1-cyclohexyl-3-hexyl urea), 10 μM DCU (1,3-dicyclohexyl urea), 0.1 μM CDU (1-cyclohexyl-3-dodecyl urea), and 0.1 μM AUDA. After the addition of substrate (final concentration of PHOME, 50 μM; total assay volume, 200 μl), the black 96-well polystyrene assay plates (Greiner Bio-One, Longwood, FL, USA) were sealed and kept in the dark at room temperature. After 1 h, the fluorescent signal was acquired once with a SpectraMax M2 plate reader employing the above-mentioned settings. After further 30-min incubation, measurements were repeated. Assay evaluation was performed four times per day on 3 consecutive days to detect variations within a plate as well as from plate to plate and from day to day.
Evaluation of candidate stop solutions
Several chemicals were tested for their suitability as stop solution for the fluorescent endpoint system employing HsEH. Thus, they were examined for their ability to prohibit enzyme–substrate interactions and substrate autohydrolysis as well as to maintain the existing fluorescent signal.
Reactions were conducted using optimized assay conditions. After 1 h in darkness under room temperature conditions, 50 μl of the potential stop solutions was added to the reactions as well as to 50 μl of 25 mM BisTris–HCl buffer (pH 7.0) containing 0.1 mg/ml BSA as a control. Initially, 20 different stop solutions were tested (for details, see Supplemental information). After the addition of candidate stop solutions, the fluorescent signals of all reactions were monitored every minute for at least 10 min as described above. For the initial screen of stop solutions, reactions were carried out without replicates, whereas the later experiments that employed Zn(NO3)2 and ZnSO4 solutions of various concentrations were conducted in triplicate. The resulting data were further analyzed relative to the respective reference—the variant where buffer was added instead of a candidate stop solution. Hydrolysis rates were determined by linear regression analyses employing the plate reader’s software SoftMax Pro 4.7.
To evaluate the influence of Zn(NO3)2 and ZnSO4 on stopping the PHOME assay, we first tested the effect of their final concentrations (0.5–200 mM) on enzyme activity. During a second step, we evaluated the influence of the two zinc salts on the fluorescent signal of 6-methoxy-2-naphthaldehyde. Calibration curves were obtained as described previously [24] in the absence or presence of 200 mM of Zn(NO3)2 or ZnSO4. Subsequently, 50 μl of buffer, 1 M Zn(NO3)2 solution (dissolved in water), or 1 M ZnSO4 solution (dissolved in water) was added to a set of standard solutions (final assay volume of 250 μl), resulting in data for three distinct standardization curves containing seven data points each. Single fluorescence readings were taken again with a SpectraMax M2 microplate reader and using the corresponding detection setup. Subsequently, data were analyzed by linear regression analyses.
Results and discussion
High-throughput enzyme assays for screening large compound libraries are generally set up as endpoint tests with comparatively long reaction times [27–29], in contrast to rapid kinetic assay systems such as the ones reported for IC50 determinations of sEH inhibitors [22,24,30]. These conditions allow multiple 96-well, 384-well, or higher density well plates to be set up in parallel by hand or simple robotics. In addition, slight variations in incubation time or conditions will not significantly alter the resulting screening data with on-plate calibrations. Due to the lack of such a method for sEH, we evaluated the recently developed fluorescent substrates for sEH [24] with regard to this particular application.
Substrate characterization and selection
Candidate substrates were tested for aqueous solubility. The resulting turbidity data, which were determined via a change in absorbance at 800 nm, revealed that the aryl ester PHOME (Fig. 1; compound 3 in Jones and coworkers [24]) is the most soluble compound under the conditions employed (Table 1). It represented the only structure in this series of compounds that was still soluble above a final concentration of 50 μM. This finding was surprising because carbonate compounds, like the majority of the tested substrates, are generally known to display better aqueous solubility than are esters. Bilinear regression analysis allowed the calculation of the apparent limit of solubility of PHOME. It was found to be 58 ± 7 μM (mean ± SD, n = 3). In addition, the aqueous stability of this particular compound was the highest of all the compounds tested. It also had a hydrolysis rate that is approximately half of that for the substrate used for inhibition potency measurement [24] (Table 1). Due to solubility limitations, we were generally only able to accurately obtain the specificity constant kcat/Km (Table 1). For the combination PHOME/HsEH, the obtained value was 0.115 s−1 μM−1, which is in the middle of the range of the acquired values. In addition, kcat/Km ratios showed PHOME to be turned over roughly fivefold slower than compound 7 [24]. Nevertheless, due to the higher solubility of PHOME and by employing the Lineweaver–Burk conversion, Km and Vmax values of this particular substrate could be acquired. They were found to be 272 μM and 1.08 nmol min−1, respectively.
Altogether, these findings favored PHOME as substrate for a long-incubation endpoint assay for HsEH and thus for an HTS assay. Its comparatively high solubility and low autohydrolysis rate will allow a near steady-state reaction for more than 60 min of incubation time using comparatively low enzyme concentrations. This will decrease total cost and increase sensitivity for the screening of chemical libraries. In addition, the midrange kcat/Km value of the combination HsEH/PHOME ensures that the enzymatic reactions occur neither too slow nor too fast. The first option could cause a too narrow separation band between maximum and minimum enzyme activities, whereas the second option could interfere with the relatively long reaction time and the steady-state condition of the reaction. However, both prospects should be avoided in this particular application.
Assay conditions and optimization
The assay optimization process was performed with the following conditions held constant: (i) the employed buffer was 25 mM BisTris–HCl (pH 7.0) containing 0.1 mg/ml BSA, (ii) the total assay volume was 200 μl with a final DMSO concentration of 1% (v/v) originating from the substrate stock solutions, (iii) the assay reaction time was 1 h as a compromise between enzyme activity decay (HsEH half-life is >8 h at 25 °C in the assay conditions used [31]) and sensitivity increase over time, and (iv) the experiments were conducted at room temperature (23 ± 2 °C) to simplify analysis.
Optimization of the substrate and enzyme concentration was done in a checkerboard experiment in which [PHOME] varied from 15 to 50 μM and [HsEH] varied from 0 to 26nM (Table 2). Optimized concentrations of HsEH and PHOME were found to be 3 nM and 50 μM, respectively. These concentrations of enzyme and substrate ensured a linear substrate hydrolysis over a period of 1 h with minimal enzyme amount. Furthermore, a resulting signal/background ratio of at least 4 after 60min still provided the desired assay sensitivity. Interestingly, the reporter molecule appearance maintained a linear correlation (r2 = 0.994) after 90 min of incubation (Fig. 2A). After this time period, only approximately 30% of the total substrate amount was consumed. Therefore, endpoint readings of the developed inhibitor test can be taken anytime between 60 and 90min after the reaction is started by the addition of substrate, still ensuring steady-state conditions and a constant substrate turnover rate.
Table 2.
Results of the checkerboard assay for the optimization of HsEH and PHOME concentrations
| [PHOME] (μM) | [HsEH] (nM)
|
|||||||||||
|---|---|---|---|---|---|---|---|---|---|---|---|---|
| 26.1 | 13.1 | 6.5 | 3.3 | 2.6 | 1.6 | 1.3 | 0.8 | 0.7 | 0.4 | 0.3 | 0 | |
| 50 | 0.838 | 0.991 | 0.997 | 0.998 | 0.998 | 0.998 | 0.999 | 0.998 | 0.998 | 0.998 | 0.996 | 0.976 |
| 12.4 | 10.8 | 7.3 | 4.3 | 3.8 | 2.6 | 2.3 | 1.8 | 1.6 | 1.4 | 1.3 | 1.0 | |
| 86 | 74 | 48 | 26 | 22 | 14 | 11 | 8 | 7 | 5 | 4 | 2 | |
| 45 | 0.818 | 0.990 | 0.997 | 0.997 | 0.997 | 0.997 | 0.997 | 0.997 | 0.997 | 0.995 | 0.995 | 0.928 |
| 22.3 | 20.2 | 12.9 | 7.2 | 5.7 | 4.0 | 3.1 | 2.4 | 2.0 | 1.7 | 1.4 | 1.0 | |
| 95 | 86 | 54 | 28 | 21 | 14 | 10 | 7 | 5 | 4 | 3 | 0.5 | |
| 40 | 0.791 | 0.988 | 0.997 | 0.998 | 0.998 | 0.997 | 0.998 | 0.998 | 0.997 | 0.997 | 0.996 | 0.947 |
| 23.6 | 22.1 | 15.3 | 8.4 | 6.8 | 4.6 | 3.4 | 2.8 | 2.3 | 1.8 | 1.7 | 1.0 | |
| 100 | 94 | 64 | 33 | 26 | 17 | 11 | 8 | /6 | 4 | 3 | 1 | |
| 35 | 0.730 | 0.952 | 0.997 | 0.998 | 0.997 | 0.997 | 0.997 | 0.996 | 0.997 | 0.996 | 0.997 | 0.953 |
| 23.0 | 21.7 | 16.5 | 9.3 | 7.5 | 5.0 | 3.8 | 2.9 | 2.5 | 2.0 | 1.6 | 1.0 | |
| 100 | 97 | 73 | 40 | 31 | 19 | 14 | 10 | 8 | 6 | 4 | 1 | |
| 30 | 0.671 | 0.932 | 0.997 | 0.998 | 0.998 | 0.997 | 0.997 | 0.998 | 0.998 | 0.996 | 0.997 | 0.887 |
| 24.0 | 23.4 | 19.9 | 11.2 | 8.8 | 5.8 | 4.6 | 3.4 | 2.8 | 2.2 | 1.9 | 1.0 | |
| 100 | 62 | 53 | 29 | 22 | 4 | 10 | 7 | 5 | 4 | 3 | 1 | |
| 25 | 0.579 | 0.841 | 0.985 | 0.998 | 0.998 | 0.998 | 0.998 | 0.998 | 0.997 | 0.997 | 0.996 | 0.889 |
| 20.9 | 20.3 | 19.0 | 11.7 | 9.7 | 6.0 | 4.8 | 3.5 | 2.9 | 2.2 | 1.8 | 1.0 | |
| 100 | 100 | 97 | 58 | 47 | 28 | 21 | 14 | 11 | 7 | 6 | 1 | |
| 20 | 0.521 | 0.761 | 0.937 | 0.815 | 0.998 | 0.998 | 0.998 | 0.998 | 0.998 | 0.997 | 0.997 | 0.963 |
| 20.4 | 18.3 | 18.3 | 7.3 | 11.0 | 7.4 | 5.4 | 4.2 | 3.2 | 2.5 | 2.1 | 1.0 | |
| 100 | 100 | 100 | 41 | 60 | 39 | 28 | 20 | 14 | 10 | 8 | 1 | |
| 15 | 0.474 | 0.701 | 0.874 | 0.998 | 0.998 | 0.998 | 0.998 | 0.998 | 0.998 | 0.998 | 0.998 | 0.958 |
| 19.1 | 18.6 | 17.3 | 14.8 | 11.9 | 7.6 | 5.7 | 4.2 | 3.4 | 2.5 | 2.3 | 1.0 | |
| 100 | 100 | 100 | 100 | 80 | 50 | 36 | 25 | 19 | 13 | 11 | 2 | |
Note. The three numbers given for each combination of concentrations represent, from top to bottom, (i) the squared linear correlation coefficient (r2) for 60 min of incubation time, (ii) the signal/background ratio after 60 min, and (iii) the percentage of substrate that was turned over after 60 min.
Fig. 2.
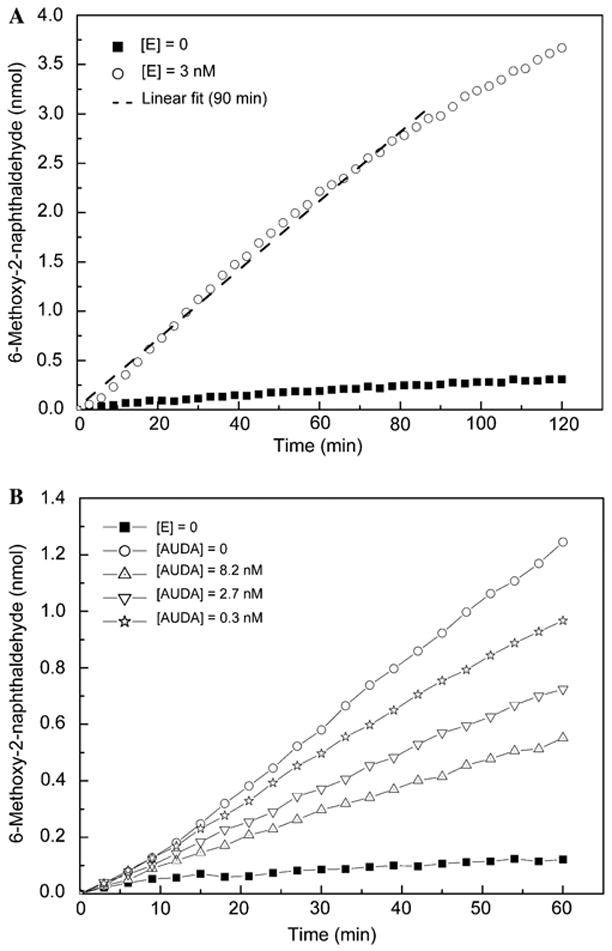
Time course of 6-methoxy-2-naphthaldehyde concentration for optimized endpoint assay conditions: [E]final (HsEH) = 3 nM; [S]final (PHOME) = 50 μM; 25 mM BisTris–HCl buffer (pH 7.0) containing 0.1 mg/ml BSA; 200 μl assay volume. (A) Normalized 2-h monitoring of the enzymatic reaction in comparison with autohydrolysis of the substrate. The dashed line is the linear regression of the first 90 min of the enzymatic reaction (r2 = 0.994). (B) Impact of three different concentrations of AUDA, an sEH inhibitor, on the substrate turnover rate as well as maximal (noninhibited) and minimal (autohydrolysis) enzyme activities.
The mechanism of the fluorescent substrate decomposition basically occurs in three steps: epoxide hydrolysis, intramolecular cyclization, and conversion of the cyanohydrin into 6-methoxy-2-naphthaledehyde (cf. Fig. 1). The optimized substrate and enzyme concentrations force the epoxide hydrolysis by HsEH to be the rate-limiting step of the reaction mechanism, and this is critical for the applicability of the assay. During the checkerboard assay, linear increase of the initial substrate turnover rate was demonstrated with an increasing protein amount up to 0.33 μg/well at 50 μM (Fig. 3). This represents roughly 10 times more protein than that used in the optimized test system. Linear regression analysis of the corresponding data confirmed the proportional relation with a correlation coefficient of 0.999. If either the intramolecular cyclization or the cyanohydrin conversion step was the rate-limiting reaction, the increase in initial velocity increase would plateau at a certain protein concentration and thus not be linear anymore.
Fig. 3.
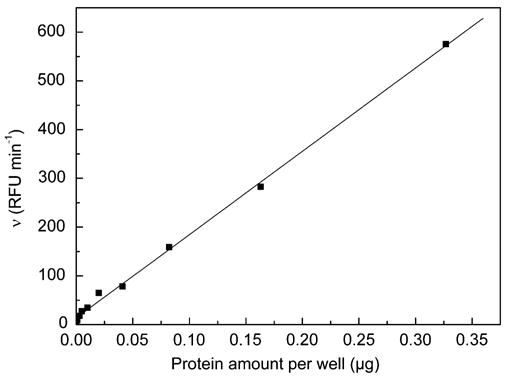
Increase of initial velocity (υ) caused by increasing HsEH amounts per well at a PHOME concentration of 50 μM.
The optimized HsEH concentration of 3 nM is three times greater than that used in the rapid kinetic fluorescent assay as reported by Jones and coworkers [24] suggesting less sensitivity. However, this reduction can be compensated for by a longer reaction time. The PHOME substrate concentration of 50 μM is similar to that used in the previously described NEPC (4-nitrophenyl-trans-2,3-epoxy-3-phenylpropyl carbonate) colorimetric assay and the [3H]tDPPO (trans-1,3-diphenylpropene oxide) radiochemical assay [23,30].
Assay validation
To validate the assay, we first investigated its ability to differentiate between and classify known inhibitors of various potencies. IC50 values of previously characterized sEH inhibitors were determined employing the endpoint assay system by continuously monitoring 6-methoxy-2-naphthaldehyde appearance (Fig. 2B) as well as by taking only single fluorescent measurements after a reaction time of 1 h. In contrast to the kinetic fluorescent assay for sEH [24], which was used to test the same inhibitors, enzyme–inhibitor incubation was allowed to take place for 10 min (vs. 5 min) with regard to the future application of the assay. This time was selected to simplify the handling of multiple plates and to allow slow-binding inhibitors to fully inhibit the enzyme. Of course, this substrate also can be used for real-time assays.
IC50 values obtained in a kinetic or endpoint mode with PHOME as substrate are similar for CHU, DCU, and AUDA but differ for CEU and CDU (Table 3). The fourfold difference in the IC50 values for CEU probably reflects the overall low sensitivity of the assay system for high IC50 values. In contrast, we have no explanation for the twofold difference between the IC50 values obtained for CDU. However, both modes of detection yield the same ranking of the investigated inhibitors. Therefore, the assay developed in this study could be employed either as an endpoint assay or as a kinetic test to rank inhibitors. The ranking of all tested inhibitors with the substrate PHOME was in accordance with the kinetic fluorescent assay described by Jones and coworkers [24]. In addition, the obtained values were quite similar to those determined via the latter assay employing compound 7 (Table 3), suggesting that the PHOME assay is as sensitive and efficient as the previously described test system [24] to rank potent inhibitors. Furthermore, the assay using substrate 3 could distinguish between very potent inhibitors (CDU and AUDA) in accordance with the [3H]tDPPO assay and in contrast to the NEPC test (Table 3). Thus, the newly developed assay system is highly sensitive and covers a wide range of IC50 values. However, the inhibitors CHU and DCU could not be differentiated statistically by their IC50 values employing HsEH and PHOME, even though previous examinations were able to do so employing other test systems. The reason for this might be the prolonged enzyme–inhibitor incubation time, which was shown previously to result in divergent IC50 values [30]. This is, of course, not significant for a screening assay system and can be addressed, if necessary, by direct comparison of the compounds. Nevertheless, these experimental results confirmed the suitability of the developed fluorescent endpoint assay using PHOME for sEH inhibition tests.
Table 3.
IC50 values of sEH inhibitors determined with various test systems employing HsEH
| Substrate | Mode of measurement | 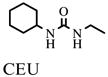 |
 |
 |
||
|---|---|---|---|---|---|---|
| PHOME | Continuous | 9800 ± 2700 | 29 ± 13 | 33 ± 7 | 19 ± 2 | 4.6 ± 0.6 |
| Endpoint | 39,600 ± 4300 | 33 ± 3 | 35 ± 4 | 8.1 ± 0.5 | 5.5 ± 0.5 | |
| 7a | Continuous | 7500 ± 130 | 25 ± 0.1 | 52 ± 1 | 7.0 ± 0.2 | 3.2 ± 0.1 |
| NEPCa | Continuous | 42,000 ±2000 | 70 ± 20 | 160 ± 10 | 100 ± 10 | 100 ± 10 |
| [3H]tDPPOa | Endpoint | ND | 221 ± 2 | 63 ± 0.3 | 85.2 ± 0.5 | 69 ± 2 |
Note. Values (in nM) are given as means ± standard deviations (n ≥3). ND, not determined.
IC50 values are as reported previously (see Ref. [24] and references therein).
In a second experiment, we determined the accuracy and precision of the endpoint assay with PHOME as substrate. Fluorescence was measured after 60 and 90 min of incubation at room temperature. To evaluate the coefficient of variation (CV) of the assay and its accuracy, we measured the inhibition effect of five inhibitors of various potencies at one concentration each in quadruplicate on every plate. The experiment was repeated four times per day on 3 consecutive days. Because the results after 60 and 90 min of incubation time were similar, Table 4 displays only the results of the longer incubation time. Intraplate relative standard deviations (or CVs) were found to be between 0.3 and 6.2%. The average CV of all acquired values was 2.4%. As shown in Table 4, interplate variations ranged from 2 to 7% and over the 3 days variations were less than 6.5%.
Table 4.
Precision and accuracy data and Z′ values acquired from the fluorescent endpoint system validation
| Nominal inhibition (%) | Day 1
|
Day 2
|
Day 3
|
Interday precisionb (CV %) | ||||
|---|---|---|---|---|---|---|---|---|
| Mean accuracya (%) | Precisiona (CV %) | Mean accuracya (%) | Precisiona (CV %) | Mean accuracya (%) | Precisiona (CV %) | |||
| Blank | — | 3.4 | 2.2 | 3.4 | 4.6 | |||
| Control | — | 4.6 | 7.3 | 6.7 | 6.2 | |||
| Inhibitors | ||||||||
| CEU | 5 | 95.2 | 5.2 | 71.3 | 3.9 | 59.0 | 3.5 | 5.0 |
| CHU | 35 | 97.9 | 3.7 | 92.4 | 2.0 | 70.0 | 6.2 | 5.7 |
| CDU | 55 | 99.9 | 2.5 | 95.0 | 3.9 | 88.6 | 2.6 | 5.7 |
| AUDA | 65 | 98.9 | 3.5 | 98.9 | 2.2 | 87.1 | 2.5 | 6.0 |
| DCU | 95 | 98.6 | 2.8 | 99.8 | 3.0 | 98.3 | 2.9 | 4.9 |
| Z′ | 0.8c | 0.8c | 0.7c | 0.7d | ||||
Note. Mean accuracy was determined by calculating the ratio of the determined inhibition percentage divided by the nominal value and multiplying it by 100%. Precision or coefficient of variation (CV) values represent standard deviations of fluorescent signal divided by the mean fluorescent signal of maximum enzyme activity and multiplied by 100%.
Intraday (n = 16).
Intraday (n = 48).
Intraday average (n = 4).
Interday average (n = 12).
Overall, the assay gives good accuracy on the first day (>95%), but it slowly decreases over the next 2 days to reach only 60% for CEU on day 3. We generally observed less inhibition on the second day and even less on the third day for all of the inhibitors. This suggests that the loss of accuracy could be caused by degradation of the inhibitors over the test period due to suboptimal storage conditions at room temperature. Finally, to quantify the assay performance, we calculated the Z′ factor, which represents a statistical parameter indicating the robustness of assays for HTS [32]. In this case, values between 0.7 and 0.8 were found, demonstrating that the assay holds a large separation band between samples and blank signals and thereby confirming its suitability for HTS. Except for DCU, whose inhibitory impact on the HsEH activity was extremely high (and thus the corresponding fluorescent signal was too close to the blank signal), we obtained Z values [32] between 0.6 and 0.8. This means, that the assay has a separation band between 0 and 90% of inhibition in which it can differentiate inhibitors from each other. All of these findings establish the reliability and reproducibility of the developed fluorescent endpoint HTS system for sEH inhibition.
Determination of a candidate stop solution
The search for an appropriate stop solution was carried out to increase flexibility of the fluorescent endpoint assay for HsEH. If it was possible to stop an ongoing substrate hydrolysis reaction and conserve the current signal, the endpoint assay could potentially be interrupted anytime between 60 and 90 min after the addition of substrate. Most important, the quantification of the fluorescent signal could be achieved independently from the assay starting time, and this would significantly improve the adaptability of the system. A total of 20 chemicals and solutions were tested for their potential to function as stop solutions for the described fluorescent endpoint assay system (see Supplementary material). Zn(NO3)2 and ZnSO4, which are known to inhibit the C-terminal epoxide hydrolase and N-terminal phosphatase activity of sEH [33,34], were able to significantly inhibit the enzymatic reaction. We found that final concentrations of at least 0.1 M of these two salts are necessary to stop the enzymatic reaction. In addition, a final ZnSO4 concentration of at least 0.2 M enhanced the fluorescent signal of the reporter molecule by approximately 35%, whereas the same concentration of Zn(NO3)2 reduced it by 20% (see Supplemental information). However, the signal/noise ratio was not changed because both the sample and background fluorescences were increased. If needed, high concentrations of ZnSO4 can be used as stop solutions to inhibit the sEH activity with no decrease in fluorescence intensity. Data in this study were generated without stop solutions to simplify the assay and because our plate design provided internal controls.
Further applications
In the current article, we have described the development of the fluorescent HTS assay for a specific application: HTS of chemical libraries to find new inhibitors for HsEH. Although this use is important, the technology could be extended to other applications. It could be used in combination with other epoxide hydrolases or other enzymes that hydrolyze epoxides to diols [35]. Furthermore, because the substrates contain an ester or carbonate function, esterases or lipases could also hydrolyze these compounds and yield a fluorescent response [36,37]. To illustrate this, we report data in the Supplementary material that prove that the previously described series of fluorescent substrates for sEH [24] are excellent substrates for other EHs and esterases. Furthermore, similar products are excellent cytochrome P450 substrates [38,39]. Thus, as a cautionary note, sEH activity tests of cells or cell lysates are not recommended with these compounds. This system as formatted requires at least partially purified enzyme and/or judicious use of enzyme inhibitors for proper performance.
Epoxide hydrolases, especially from microorganisms, are used for the production of chiral epoxides [40]. If used as a competitive substrate, the fluorescent assay developed in this study could be easily employed to screen libraries of pure oxirane enantiomers and to determine the enantio-selectivity of a particular enzyme.
The cyanohydrin rearrangement concept leading to the formation of a fluorescent aldehyde used in this study for HsEH has also been used for esterases and P450 assay development (for more details about synthesis and assay optimization, see Refs. [36–39]). This concept can be extended to other fluorescent aldehydes to shift excitation and emission maxima. Alternatively, the assay can be set up to yield an absorbance or luminescent signal.
Conclusion
In the current study, we have developed and validated a fluorescent endpoint assay for the HTS of human soluble epoxide hydrolase inhibition. The option of employing ZnSO4 at a final concentration greater than 0.1 M as stop solution was provided. This test system will facilitate the HTS of large compound libraries with the objective to discover currently unknown potent sEH inhibitors leading to novel drugs for cardiovascular disease treatment.
Supplementary Material
Acknowledgments
N.M. Wolf was supported by the Bavarian Research Foundation (Bayerische Forschungsstiftung). P.D. Jones was supported by an NIH Institutional Pre- and Postdoctoral Training Grant (T32 DK07355) and by an NIH/NHLBI Ruth L. Kirschstein–NRSA Grant (F32 HL078096). This study was supported in part by NIEHS Grant ES02710, NIEHS Superfund Grant P42 ES04699, NHLBI STTR Grant R41 HL078016, and NIH/NINDS Grant R03 NS050841.
Abbreviations used
- sEH
soluble epoxide hydrolase
- EET
epoxyeicos-atrienoic acid
- AUDA
12-(3-adamantane-1-yl-ureido)-dodecanoic acid
- HTS
high-throughput screen
- HsEH
human soluble epoxide hydrolase
- DMSO
dimethyl sulfoxide
- BSA
bovine serum albumin
- PHOME
(3-phenyl-oxiranyl)-acetic acid cyano-(6-methoxy-naphthalen-2-yl)-methyl ester
- CEU
1-cyclohexyl-3-ethyl urea
- CHU
1-cyclohexyl-3-hexyl urea
- DCU
1,3-dicyclohexyl urea
- CDU
1-cyclohexyl-3-dodecyl urea
- NEPC
4-nitrophenyl-trans-2,3-epoxy-3-phenylpropyl carbonate
- [3H]tDPPO
trans-1,3-diphenylpropene oxide
- CV
coefficient of variation
Appendix A. Supplementary data
Supplementary data associated with this article can be found, in the online version, at doi:10.1016/j.ab.2006.04.045.
References
- 1.Oesch F. Mammalian epoxide hydrases: inducible enzymes catalysing the inactivation of carcinogenic and cytotoxic metabolites derived from aromatic and olefinic compounds. Xenobiotica. 1973;3:305–340. doi: 10.3109/00498257309151525. [DOI] [PubMed] [Google Scholar]
- 2.Harder DR, Campbell WB, Roman RJ. Role of cytochrome P-450 enzymes and metabolites of arachidonic acid in the control of vascular tone. J Vasc Res. 1995;32:79–92. doi: 10.1159/000159080. [DOI] [PubMed] [Google Scholar]
- 3.Campbell WB, Gebremedhin D, Pratt PF, Harder DR. Identification of epoxyeicosatrienoic acids as endothelium-derived hyperpolarizing factors. Circ Res. 1996;78:415–423. doi: 10.1161/01.res.78.3.415. [DOI] [PubMed] [Google Scholar]
- 4.Node K, Huo Y, Ruan X, Yang B, Spiecker M, Ley K, Zeldin DC, Liao JK. Anti-inflammatory properties of cytochrome P450 epoxygenase-derived eicosanoids. Science. 1999;285:1276–1279. doi: 10.1126/science.285.5431.1276. [DOI] [PMC free article] [PubMed] [Google Scholar]
- 5.Newman JW, Morisseau C, Hammock BD. Epoxide hydrolases: their roles and interactions with lipid metabolism. Prog Lipid Res. 2005;44:1–51. doi: 10.1016/j.plipres.2004.10.001. [DOI] [PubMed] [Google Scholar]
- 6.Imig JD, Zhao X, Capdevila JH, Morisseau C, Hammock BD. Soluble epoxide hydrolase inhibition lowers arterial blood pressure in angiotensin II hypertension. Hypertension. 2002;39:690–694. doi: 10.1161/hy0202.103788. [DOI] [PubMed] [Google Scholar]
- 7.Yu Z, Xu F, Huse LM, Morisseau C, Draper AJ, Newman JW, Parker C, Graham L, Engler MM, Hammock BD, Zeldin DC, Kroetz DL. Soluble epoxide hydrolase regulates hydrolysis of vasoactive epoxyeicosatrienoic acids. Circ Res. 2000;87:992–998. doi: 10.1161/01.res.87.11.992. [DOI] [PubMed] [Google Scholar]
- 8.Imig JD, Zhao X, Zaharis CZ, Olearczyk JJ, Pollock DM, Newman JW, Kim IH, Watanabe T, Hammock BD. An orally active epoxide hydrolase inhibitor lowers blood pressure and provides renal protection in salt-sensitive hypertension. Hypertension. 2005;46:975–981. doi: 10.1161/01.HYP.0000176237.74820.75. [DOI] [PMC free article] [PubMed] [Google Scholar]
- 9.Schmelzer KR, Kubala L, Newman JW, Kim IH, Eiserich JP, Hammock BD. Soluble epoxide hydrolase is a therapeutic target for acute inflammation. Proc Natl Acad Sci USA. 2005;102:9772–9777. doi: 10.1073/pnas.0503279102. [DOI] [PMC free article] [PubMed] [Google Scholar]
- 10.Smith KR, Pinkerton KE, Watanabe T, Pedersen TL, Ma SJ, Hammock BD. Attenuation of tobacco smoke-induced lung inflammation by treatment with a soluble epoxide hydrolase inhibitor. Proc Natl Acad Sci USA. 2005;102:2186–2191. doi: 10.1073/pnas.0409591102. [DOI] [PMC free article] [PubMed] [Google Scholar]
- 11.Zhao X, Yamamoto T, Newman JW, Kim IH, Watanabe T, Hammock BD, Stewart J, Pollock JS, Pollock DM, Imig JD. Soluble epoxide hydrolase inhibition protects the kidney from hypertension-induced damage. J Am Soc Nephrol. 2004;15:1244–1253. [PubMed] [Google Scholar]
- 12.Dorrance AM, Rupp N, Pollock DM, Newman JW, Hammock BD, Imig JD. An epoxide hydrolase inhibitor, 12-(3-adamantan-1-yl-ureido)dodecanoic acid (AUDA), reduces ischemic cerebral infarct size in stroke-prone spontaneously hypertensive rats. J Cardiovasc Pharmacol. 2005;46:842–848. doi: 10.1097/01.fjc.0000189600.74157.6d. [DOI] [PMC free article] [PubMed] [Google Scholar]
- 13.Morisseau C, Goodrow MH, Dowdy D, Zheng J, Greene JF, Sanborn JR, Hammock BD. Potent urea and carbamate inhibitors of soluble epoxide hydrolases. Proc Natl Acad Sci USA. 1999;96:8849–8854. doi: 10.1073/pnas.96.16.8849. [DOI] [PMC free article] [PubMed] [Google Scholar]
- 14.Nakagawa Y, Wheelock CE, Morisseau C, Goodrow MH, Hammock BG, Hammock BD. 3-D QSAR analysis of inhibition of murine soluble epoxide hydrolase (MsEH) by benzoylureas, arylureas, and their analogues. Bioorg Med Chem Lett. 2000;8:2663–2673. doi: 10.1016/s0968-0896(00)00198-x. [DOI] [PubMed] [Google Scholar]
- 15.Morisseau C, Goodrow MH, Newman JW, Wheelock CE, Dowdy DL, Hammock BD. Structural refinement of inhibitors of urea-based soluble epoxide hydrolases. Biochem Pharmacol. 2002;63:1599–1608. doi: 10.1016/s0006-2952(02)00952-8. [DOI] [PubMed] [Google Scholar]
- 16.McElroy NR, Jurs PC, Morisseau C, Hammock BD. QSAR and classification of murine and human soluble epoxide hydrolase inhibition by urea-like compounds. J Med Chem. 2003;46:1066–1080. doi: 10.1021/jm020269o. [DOI] [PubMed] [Google Scholar]
- 17.Kim IH, Morisseau C, Watanabe T, Hammock BD. Design, synthesis, and biological activity of 1,3-disubstituted ureas as potent inhibitors of the soluble epoxide hydrolase of increased water solubility. J Med Chem. 2004;47:2110–2122. doi: 10.1021/jm030514j. [DOI] [PubMed] [Google Scholar]
- 18.Kim IH, Heirtzler FR, Morisseau C, Nishi K, Tsai HJ, Hammock BD. Optimization of amide-based inhibitors of soluble epoxide hydrolase with improved water solubility. J Med Chem. 2005;48:3621–3629. doi: 10.1021/jm0500929. [DOI] [PMC free article] [PubMed] [Google Scholar]
- 19.Morisseau C, Hammock BD. Epoxide hydrolases: mechanisms, inhibitor designs, and biological roles. Annu Rev Pharmacol Toxicol. 2005;45:311–333. doi: 10.1146/annurev.pharmtox.45.120403.095920. [DOI] [PubMed] [Google Scholar]
- 20.Lipinski CA, Lombardo F, Dominy BW, Feeney PJ. Experimental and computational approaches to estimate solubility and permeability in drug discovery and development settings. Adv Drug Deliv Rev. 2001;46:3–26. doi: 10.1016/s0169-409x(00)00129-0. [DOI] [PubMed] [Google Scholar]
- 21.Watanabe T, Schulz D, Morisseau C, Hammock BD. High-throughput pharmacokinetic method: cassette dosing in mice associated with minuscule serial bleedings and LC–MS–MS analysis. Anal Chim Acta. 2006;559:37–44. doi: 10.1016/j.aca.2005.11.049. [DOI] [PMC free article] [PubMed] [Google Scholar]
- 22.Dietze EC, Kuwano E, Hammock BD. Spectrophotometric substrates for cytosolic epoxide hydrolase. Anal Biochem. 1994;216:176–187. doi: 10.1006/abio.1994.1023. [DOI] [PubMed] [Google Scholar]
- 23.Borhan B, Mebrahtu T, Nazarian S, Kurth MJ, Hammock BD. Improved radiolabeled substrates for soluble epoxide hydrolase. Anal Biochem. 1995;231:188–200. doi: 10.1006/abio.1995.1520. [DOI] [PubMed] [Google Scholar]
- 24.Jones PD, Wolf NM, Morisseau C, Whetstone P, Hock B, Hammock BD. Fluorescent substrates for soluble epoxide hydrolase and application to inhibition studies. Anal Biochem. 2005;343:66–75. doi: 10.1016/j.ab.2005.03.041. [DOI] [PMC free article] [PubMed] [Google Scholar]
- 25.Wixtrom RN, Silva MH, Hammock BD. Affnity purification of cytosolic epoxide hydrolase using derivatized epoxy-activated Sepharose gels. Anal Biochem. 1988;169:71–80. doi: 10.1016/0003-2697(88)90256-4. [DOI] [PubMed] [Google Scholar]
- 26.Beetham JK, Tian T, Hammock BD. cDNA cloning and expression of a soluble epoxide hydrolase from human liver. Arch Biochem Biophys. 1993;305:197–201. doi: 10.1006/abbi.1993.1411. [DOI] [PubMed] [Google Scholar]
- 27.Venhorst J, Onderwater RC, Meerman JH, Vermeulen NP, Commandeur JN. Evaluation of a novel high-throughput assay for cytochrome P450 2D6 using 7-methoxy-4-(aminomethyl)-coumarin. Eur J Pharm Sci. 2000;12:151–158. doi: 10.1016/s0928-0987(00)00150-0. [DOI] [PubMed] [Google Scholar]
- 28.Marks BD, Goossens TA, Braun HA, Ozers MS, Smith RW, Lebakken C, Trubetskoy OV. High-throughput screening assays for CYP2B6 metabolism and inhibition using fluorogenic vivid substrates. AAPS Pharm Sci. 2003;5:e18. doi: 10.1208/ps050218. [DOI] [PMC free article] [PubMed] [Google Scholar]
- 29.Soriano A, Radice AD, Herbitter AH, Langsdorf EF, Stafford JM, Chan S, Wang S, Liu YH, Black TA. Escherichia coli acetyl–coenzyme A carboxylase: characterization and development of a high-throughput assay. Anal Biochem. 2006;349:268–276. doi: 10.1016/j.ab.2005.10.044. [DOI] [PubMed] [Google Scholar]
- 30.Morisseau C, Du G, Newman JW, Hammock BD. Mechanism of mammalian soluble epoxide hydrolase inhibition by chalcone oxide derivatives. Arch Biochem Biophys. 1998;356:214–228. doi: 10.1006/abbi.1998.0756. [DOI] [PubMed] [Google Scholar]
- 31.Morisseau C, Beetham JK, Pinot F, Debernard S, Newman JW, Hammock BD. Cress and potato soluble epoxide hydrolases: purification, biochemical characterization, and comparison to mammalian enzymes. Arch Biochem Biophys. 2000;378:321–332. doi: 10.1006/abbi.2000.1810. [DOI] [PubMed] [Google Scholar]
- 32.Zhang JH, Chung TD, Oldenburg KR. A simple statistical parameter for use in evaluation and validation of high throughput screening assays. J Biomol Screen. 1999;4:67–73. doi: 10.1177/108705719900400206. [DOI] [PubMed] [Google Scholar]
- 33.Draper AJ, Hammock BD. Soluble epoxide hydrolase in rat inflammatory cells is indistinguishable from soluble epoxide hydrolase in rat liver. Toxicol Sci. 1999;50:30–35. doi: 10.1093/toxsci/50.1.30. [DOI] [PubMed] [Google Scholar]
- 34.Newman JW, Morisseau C, Harris TR, Hammock BD. The soluble epoxide hydrolase encoded by EPXH2 is a bifunctional enzyme with novel lipid phosphate phosphatase activity. Proc Natl Acad Sci USA. 2003;100:1558–1563. doi: 10.1073/pnas.0437724100. [DOI] [PMC free article] [PubMed] [Google Scholar]
- 35.Arand M, Cronin A, Adamska M, Oesch F. Epoxide hydrolases: structure, function, mechanism, and assay. Methods Enzymol. 2005;400:569–588. doi: 10.1016/S0076-6879(05)00032-7. [DOI] [PubMed] [Google Scholar]
- 36.Shan G, Hammock BD. Development of sensitive esterase assays based on α-cyano-containing esters. Anal Biochem. 2001;299:54–62. doi: 10.1006/abio.2001.5388. [DOI] [PubMed] [Google Scholar]
- 37.Wheelock CE, Wheelock ÅM, Zhang R, Stok JE, Morisseau C, Le Valley SE, Green CE, Hammock BD. Evaluation of α-cyanoesters as fluorescent substrates for examining interindividual variation in general and pyrethroid-selective esterases in human liver microsomes. Anal Biochem. 2003;315:208–222. doi: 10.1016/s0003-2697(03)00002-2. [DOI] [PubMed] [Google Scholar]
- 38.Zhang R, Kang KD, Shan G, Hammock BD. Design, synthesis, and evaluation of novel P450 fluorescent probes bearing α-cyanoether. Tetrahedron Lett. 2003;44:4331–4334. [Google Scholar]
- 39.Kang KD, Jones PD, Huang H, Zhang R, Mostovich LA, Wheelock CE, Watanabe T, Gulyaeva LF, Hammock BD. Evaluation of α-cyano ethers as fluorescent substrates for assay of cytochrome P450 enyzme activity. Anal Biochem. 2005;344:183–192. doi: 10.1016/j.ab.2005.06.032. [DOI] [PMC free article] [PubMed] [Google Scholar]
- 40.de Vries EJ, Janssen DB. Biocatalytic conversion of epoxides. Curr Opin Biotechnol. 2003;14:414–420. doi: 10.1016/s0958-1669(03)00102-2. [DOI] [PubMed] [Google Scholar]
Associated Data
This section collects any data citations, data availability statements, or supplementary materials included in this article.