Abstract
Stretching experiments with long double-stranded DNA molecules in physiological ambient revealed a force-induced transition at a force of 65 pN. During this transition between B-DNA and highly overstretched S-DNA the DNA lengthens by a factor of 1.7 of its B-form contour length. Here, we report the occurrence of this so-called B-S transition in short duplexes consisting of 30 basepairs. We employed atomic-force-microscope-based single molecule force spectroscopy to explore the unbinding mechanism of two short duplexes containing 30 or 20 basepairs by pulling at the opposite 5′ termini. For a 30-basepair-long DNA duplex the B-S transition is expected to cause a length increase of 6.3 nm and should therefore be detectable. Indeed 30% of the measured force-extension curves exhibit a region of constant force (plateau) at 65 pN, which corresponds to the B-S transition. The observed plateaus show a length between 3 and 7 nm. This plateau length distribution indicates that the dissociation of a 30-basepair duplex mainly occurs during the B-S transition. In contrast, the measured force-extension curves for a 20-basepair DNA duplex exhibited rupture forces below 65 pN and did not show any evidence of a B-S transition.
INTRODUCTION
The elastic and mechanical behavior of long double-stranded DNA has been investigated using a variety of techniques, which cover a broad range of forces from a few piconewton up to several hundred piconewtons. For example, magnetic beads (1), glass microneedles (2), optical traps (3,4), and the atomic force microscope (AFM) (5) have been used to investigate the response of long λ-DNA to externally applied forces. These stretching experiments of λ-DNA exhibit a highly cooperative transition at a force of 65–70 pN, which refers to the conversion of B-DNA into an overstretched conformation called S-DNA. Hereby the DNA molecule stretches up to a factor of 1.7 of its B-form contour length. Besides force spectroscopy experiments, molecular dynamic simulations, and various theoretical approaches give detailed insights into the processes of this so-called B-S transition (6–13).
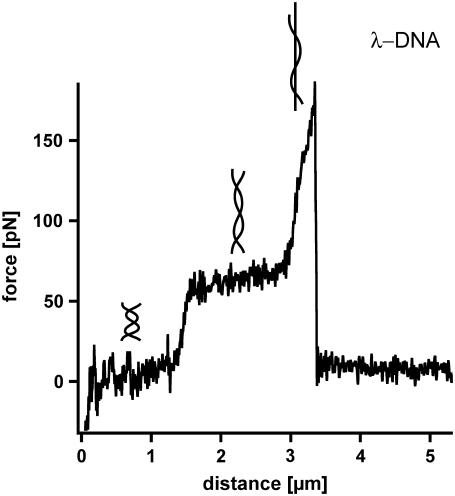
A detailed analysis of the B-S transition was performed with single molecule force spectroscopy using the AFM. In 1999, Rief et al. (5) were the first to analyze long λ-DNA with the AFM. λ-DNA was adsorbed nonspecifically to a gold surface and picked up with a cantilever in the next step. Upon retraction, the double-stranded DNA molecule, attached via the 3′ and 5′ terminus of the same strand is stretched between the cantilever tip and the gold surface until the complementary strand melts off. Fig. 1 shows a typical example of the force-extension curves for λ-DNA, which exhibits an overstretching B-S transition at a force of 65 pN. During this transition the force-extension curve shows a lengthening of the double-stranded λ-DNA by a factor of 1.7. At forces higher than 65 pN a second transition occurs, which is discussed in the literature to be a force-induced melting transition (5). During this transition the double-stranded DNA is split into two single strands. Upon further extension, the force increases drastically until the remaining single-stranded DNA finally ruptures. The B-S transition and the melting transition exhibit a significant thermodynamic difference: The B-S transition is represented by a force plateau in the force-extension curve and is independent of the pulling speed. Therefore, it can be considered as an equilibrium process within the timescale of the performed experiments. In contrast, the melting transition shows a very steep force increase and a pronounced speed dependence. Therefore this transition occurs in nonequilibrium (5). In contrast to this approach, theoretical analyses exist, which interpret the B-S transition as a force-induced melting transition (14,15). It was shown that this interpretation can quantitatively describe the thermodynamics of DNA overstretching (16).
FIGURE 1.
Force-extension curve of double-stranded λ-DNA. While retracting the cantilever from the surface with a velocity of 16 μm/s the double-stranded λ-DNA is stretched. At a force between 65 and 70 pN the well-known highly cooperative B-S transition is observed. During this transition the DNA duplex lengthens by a factor of 1.7. After this transition the force increases to a value of ∼170 pN where the DNA finally ruptures.
In addition to λ-DNA, which contains a mixture of A-T and G-C basepairs, Rief et al. measured long double-stranded poly(dG-dC) and poly(dA-dT) sequences to obtain information about the sequence dependence of the B-S transition. The B-S transition for double-stranded poly(dG-dC) also occurred at a force of 65 pN whereas the force-extension curves for poly(dA-dT) sequences showed a force of 35 pN. Further investigations of the nature of the B-S transition were carried out by Clausen-Schaumann et al., Williams et al., and Wenner et al. (17–20). They analyzed the influence of the position of attachment, the salt concentration, the temperature, and the pH on the B-S transition. If the DNA molecule was attached to the cantilever tip and the gold surface with both strands simultaneously, the overstretching transition was shifted to higher force values of 105 pN and showed less cooperativity. For salt (NaCl) concentrations higher than 150 mM, the B-S transition occurred at forces of 65 pN. For salt concentrations lower than 150 mM the force decreased and the B-S transition exhibited less cooperativity. Without any salt, the DNA molecules denatured upon stretching and very short or no B-S plateaus were observed. Further measurements showed, that the force of the B-S transition was reduced when the temperature was increased. In addition, higher and lower pH than the physiological pH of 7.4 led to lower B-S transition forces.
Whereas all above experiments have been carried out with long double-stranded DNA, which was attached randomly to gold surfaces, a different approach was followed in the experiments of Strunz et al. (21) and Pope et al. (22). Instead of attaching double-stranded DNA to a surface and picking it up nonspecifically with the cantilever tip two complementary single strands were covalently coupled to the cantilever tip and the surface. Upon approach of the cantilever tip to the surface, the complementary DNA strands hybridized and formed a duplex. Upon retraction of the cantilever tip the hybridized DNA was loaded with an increasing force until the hydrogen bonds between the two complementary strands ruptured. An advantage of this kind of measurement is that the DNA duplex is coupled to the surface and the cantilever at a defined position and that the interaction can be probed many times to gain high statistics. In addition, if oligonucleotides are used the entire sequence of the DNA duplex is known.
In Strunz et al. the measured unbinding forces of short oligonucleotides (30, 20, and 10 basepairs) were found to be a function of the applied loading rate and the number of basepairs. This indicates that the dissociation is a nonequilibrium process. In many cases the unbinding process of receptor ligand interactions can be described with a two-state model where one state represents the bound and the other state the unbound conformation of the interaction. Based on the work of Bell (23), Evans et al. developed a model to describe a two-state system under an externally applied force (24). The externally applied force reduces the unbinding barrier, which the ligand has to overcome by thermal fluctuations. This well-known Bell-Evans model was applied to analyze the obtained data for the different DNA duplexes. Because no B-S transition was observed in the measurements of Strunz et al. the unbinding of the DNA duplexes could be approximated with a two-state system and the unbinding forces showed the expected dependence on the loading rate. However, it was pointed out, that the B-S transition might be present, but could not be resolved due to experimental noise.
In this study, we performed single molecule force spectroscopy using high-resolution cantilevers to investigate DNA duplexes containing 20 and 30 basepairs concerning their conformational change during dissociation. In addition, these results were compared with measurements of 1000-basepair-long DNA duplexes.
These lengths for the short duplexes were chosen, because the data of Strunz et al. (21) suggest that the rupture forces of a 20 basepair duplex do not reach the critical force value of 65 pN whereas some rupture events for a 30 basepair duplex reach rupture forces higher than 65 pN. The measurements were performed at various loading rates to obtain a detailed picture of the presence of the B-S transition in short oligonucleotides.
MATERIALS AND METHODS
Preparation of slides and cantilevers for the measurements with λ-DNA
λ-BstEII digest DNA (length distribution, 117–8454 basepairs) was purchased from Sigma (Deisenhofen, Germany). A solution containing 123 μg/ml λ-DNA in phosphate buffered saline (PBS) was incubated on a freshly evaporated gold surface for 30 min at a temperature of 70°C. Finally the gold surface was rinsed with PBS (10 mM Na phosphate, pH 7.4, 137 mM NaCl, 2.7 mM KCl) and stored in PBS until use. The force spectroscopy experiments were performed with cantilevers (Bio-lever, Olympus, Tokyo, Japan) additionally coated with gold at room temperature.
Preparation of slides and cantilevers for the measurements with 1000-basepair-long DNA
A 1000-basepair-long DNA duplex (DNA1000s) was generated with polymerase chain reaction using 5′ thiol-modified primers. The polymerase chain reaction product was purified with gel electrophoresis followed by gel extraction. The final DNA concentration, as determined from the absorbance at 260 nm was 15 ng/μl. The DNA, diluted in H2O, was incubated on a gold surface in a humid chamber for 1 h. In the same way, the DNA was coupled to the cantilever (Bio-lever, Olympus) additionally coated with gold. After washing with H2O, the cantilever and the surface, covered with H2O were heated up to 90°C to separate the double-stranded DNA into single strands. Finally, the surfaces were rinsed with PBS to remove unbound DNA and stored in PBS until use.
Preparation of slides and cantilevers for the measurements with short oligonucleotides
Oligonucleotides modified with a thiol group at their 5′-termini (for details see Table 1; IBA GmbH, Göttingen, Germany; metabion GmbH, Martinsried, Germany) were immobilized on amino-functionalized surfaces using a hetero-bifunctional poly(ethylene glycol) (PEG) spacer (25). One oligonucleotide was immobilized on the cantilever and the oligonucleotide with the complementary sequence was coupled to the surface. The cantilevers (Bio-lever, Olympus) were cleaned as described (26). Amino-modified surfaces on the cantilevers were prepared using 3-aminopropyldimethylethoxysilane (ABCR GmbH, Karlsruhe, Germany) (26). Commercially available amino-functionalized slides (Slide A, Nexterion, Mainz, Germany) were used. From now on, both surfaces (cantilever and slide) were treated in parallel as described previously (27). They were incubated in borate buffer pH 8.5 for 1 h. This step was necessary to deprotonate the amino groups for coupling to the N-hydroxysuccinimide (NHS) groups of the heterobifunctional NHS-PEG-maleimide (molecular weigh, 5000 g/mol; Nektar, Huntsville, AL). The PEG was dissolved in a concentration of 50 mM in borate buffer at pH 8.5 and incubated on the surfaces for 1 h. In parallel, the oligonucleotides were reduced using tris (2-carboxyethyl) phosphine hydrochloride beads (Perbio Science, Bonn, Germany) to generate free thiols. After washing the surfaces with ultrapure water, a solution of the oligonucleotides (1.75 μM) was incubated on the surfaces for 1 h. Finally, the surfaces were rinsed with PBS to remove noncovalently bound oligonucleotides and stored in PBS until use.
TABLE 1.
DNA sequences
| DNA duplex | Sequence (cantilever) | Sequence (slide) |
|---|---|---|
| DNA30s | 5′SH-TTTTTTTTTTTTTTTTTTTTCG TTGGTGCGGATATCTCGGTAGTG GGATACGACGATACCGAAGACAG CTCATGTTATATTATG-3′ | 5′SH-TTTTTTTTTTTATCCCACTA CCGAGATATCCGCACCAACG-3′ |
| DNA20s | 5′SH-TTTTTTTTTTTTTTTTTTTTCG TTGGTGCGGATATCTCGGTAGTG GGATACGACGATACCGAAGACAG CTCATGTTATATTATG-3′ | 5′SH-TTTTTTTTTTCCGAGATATC CGCACCAACG-3′ |
Force spectroscopy
All force measurements were performed in PBS containing 150 mM NaCl at room temperature using an MFP-3D AFM (Asylum Research, Santa Barbara, CA). Cantilever spring constants ranged from 7 to 20 pN/nm (B-Bio-Lever and B-Bio-Lever coated with gold) and from 30 to 40 pN/nm (A-Bio-Lever and A-Bio-Lever coated with gold) and were measured as described previously (28,29). During one experiment, the approach and retract velocity were held constant, whereas the contact time on the surface was adjusted to obtain single binding events. To achieve satisfactory statistics, several hundreds of approach-retract cycles were carried out. To obtain measurements over a broad range of different loading rates, several experiments were performed each at a different retract velocity ranging from 50 nm/s to 10 μm/s.
Data extraction
The obtained data were converted into force-extension curves. From these force-extension curves, the rupture force (the force at which the DNA strands open), the rupture length, and the corresponding loading rate were determined using the software Igor Pro 5.0 (Wavemetrics, Lake Oswego, OR) and a custom-written set of procedures. The rupture force was defined as described previously (24,30). To determine the loading rate, the freely jointed chain fit (FJC) to the force-extension curve was used, according to previous studies (31).
Data analysis
To analyze the data set of one experiment, which was recorded at a constant retract velocity, the rupture forces and the corresponding loading rates were plotted in two histograms. The histograms were analyzed with two methods, which are based on the well-known Bell-Evans-model (23,24,30). For analysis of the data with the loading-rate-based method, the force and the loading rate (plotted logarithmically) histogram were fitted with a Gaussian distribution to determine the maxima of the respective histograms. These maxima were determined for each data set, ergo for each retract velocity and finally plotted in a force versus loading rate (pictured logarithmically) diagram. The maximum force represents the most probable force F*:
 |
(1) |
with kB is the Boltzmann constant, T is the temperature, Δx is the potential width, koff is the natural dissociation rate at zero force, and  is the loading rate. From a linear fit of the force versus loading rate (pictured logarithmically) plot and Eq. 1, the natural dissociation rate koff and the potential width Δx of the DNA complex can be determined. Whereas the above-mentioned method requires measurements at different retract velocities, the values for koff and Δx can be obtained from one data set measured at one retract velocity when using the following method, which was introduced by Friedsam et al. (30). It takes into account a distribution of the spacer lengths between the interaction, which needs to be measured and the surfaces. The bond rupture probability density function p(F) was calculated according to Eq. 2 for every spacer length in the measured rupture length histogram.
 |
(2) |
According to the obtained rupture force histogram the p(F) functions were weighted and finally added up. This results in a semihypothetical rupture force histogram based on the two input parameters koff and Δx, which were varied to find the best fit to the measured rupture force histogram. Therefore, the p(F)-based method also considers the shape of the measured rupture force histogram. Additionally, the probability density function p(F) was convolved with a Gaussian distribution to consider the detection noise. The standard deviation of the Gaussian distribution equals the typical noise value of the cantilever, which was used in the experiment (32).
Proof of specificity
To prove the specificity of the interactions for the measurements with DNA30s and DNA20s, the following experiments were performed. First, single-stranded DNA was measured against surfaces or cantilevers without the complementary oligonucleotide. Less than 1% nonspecific interactions were detected in ∼1000 force-extension curves. Second, measurements were performed with noncomplementary DNA strands. Thereby <4% interactions were detected. In contrast, 47% interactions were found for two complementary DNA oligonucleotides.
In addition, force clamp experiments were performed for DNA20s and DNA30s to distinguish the measured unbinding process from a so-called bulge-slipping process, dominated by the slippage of bulges in the backbone of repetitive DNA, as shown in Kühner et al. (25,33). The obtained force plateaus for DNA30s displayed equilibrium properties and did not show any discrete lengthening steps of the DNA duplex (data not shown). In addition, the obtained plateaus, which refer to the B-S transition, occurred at much higher forces than the forces of the slipping process.
RESULTS
To analyze the interaction between complementary DNA strands with various lengths (1000 basepairs, 30 basepairs, and 20 basepairs), single molecule force spectroscopy measurements were performed with an AFM.
DNA1000s
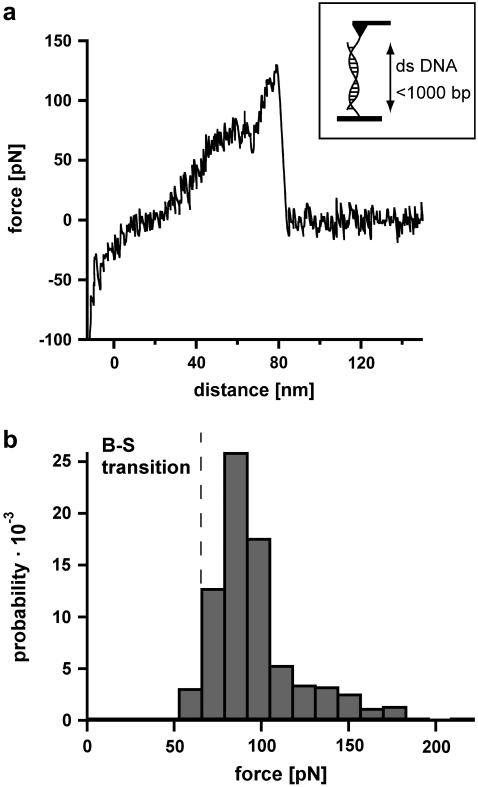
The analysis of DNA containing 1000 basepairs (DNA1000s) required the following setup (see Fig. 2 a, inset). Complementary single-stranded DNA was covalently attached to a surface and a cantilever tip at its 5′ terminus. In the next step the surface was approached with the tip of the cantilever, allowing two complementary single strands to hybridize and form a duplex. Subsequently the cantilever was retracted and the DNA duplex was loaded with an increasing force until it finally ruptured and the cantilever relaxed back into its equilibrium position. The force applied to the DNA duplex was recorded as a function of the distance between the cantilever tip and the surface. Fig. 2 a shows an example of a so-called force-extension curve of a DNA duplex with <1000 basepairs. At 65 pN the force-extension curve exhibits a region of constant force, which corresponds to the transition between B-DNA and the highly overstretched S-DNA (B-S transition). During this transition the DNA duplex lengthens by a factor of 1.7. In the example shown, incomplete hybridization of the DNA duplex results in a B-S transition length of only 25 nm. This corresponds to a hybridized DNA duplex containing 105 basepairs. The number of basepairs can be obtained from the length difference between the unstretched and the stretched conformation of the DNA duplex. The length of the unstretched DNA duplex can be calculated from the distance between two basepairs in double-stranded B-DNA, ld = 0.34 nm. Correspondingly a DNA duplex with 105 basepairs has a length of 105 × 0.34 nm = 35.7 nm. The length of the stretched DNA duplex at the end of the B-S transition then corresponds to 35.7 × 1.7 = 60.7 nm. The length difference between these two conformations (i.e., the length of the plateau) is 25 nm. Upon further extension the force increases to a value of ∼130 pN where the DNA duplex finally dissociates.
FIGURE 2.
Measurements with 1000-basepair-long double-stranded DNA (DNA1000s). (a) Example of a typical force-extension curve. The inset shows the experimental setup. Complementary single strands are attached to the tip of a cantilever and the surface. By lowering the cantilever, the two single strands hybridize and form a duplex. By retracting the cantilever from the surface the DNA duplex is loaded with force until it finally ruptures. The force-extension curve (recorded at a velocity of 632 nm/s) exhibits a B-S transition between 65 and 75 pN. Due to incomplete hybridization the B-S transition only shows a lengthening of 25 nm, which corresponds to a DNA duplex with 105 basepairs. After the B-S transition the force increases to a value of ∼130 pN where the DNA finally ruptures. (b) Histogram of the rupture forces of DNA1000s. The histogram (FWHM = 37.8 pN) clearly shows that the DNA duplex ruptures at forces higher than the B-S transition force.
Fig. 2 b shows the rupture force histogram of double-stranded DNA with up to 1000 basepairs, recorded at a velocity of 632 nm/s. The dissociation process of double-stranded DNA with up to 1000 basepairs peaks at ∼85 pN, which is significantly above the B-S transition. This leads to the conclusion that double-stranded DNA in the highly overstretched and underwound S-conformation still has a certain stability and is not separated by the transition itself. This is in accordance with Rief et al. (5), who found a second force-induced melting transition at forces higher than 65 pN. The measured rupture forces are broadly distributed (fullwidth at half-maximum (FWHM) is 37.8 pN). The width of this distribution is most likely the result of nonperfect hybridization of the long oligonucleotides or by their fragmentation during the harsh coupling reaction to the surfaces.
DNA30s
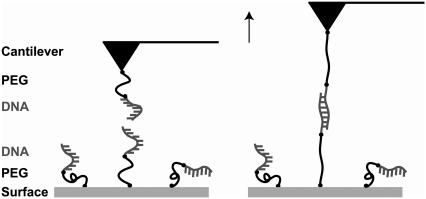
The experimental setup in Fig. 3 was used for the analysis of the short oligonucleotides containing 30 basepairs (DNA30s) and 20 basepairs (DNA20s). As stated above, the length of these duplexes was chosen because the data of Strunz et al. (21) suggest that the B-S transition might be present in a 30-basepair duplex but not in a 20-basepair duplex. The sequences of these oligonucleotides have been checked carefully to minimize self-complementarity. To reduce uncertainties due to the surface chemistry the oligonucleotides were coupled to a polyethylene glycol (PEG)-modified surface and cantilever via a thiol group at their 5′ termini. The usage of the elastic spacer PEG minimizes nonspecific interactions and maximizes the probability of detecting specific and single rupture events. Moreover, it prevents a shift to lower unbinding forces otherwise caused by thermal fluctuations of the cantilever.
FIGURE 3.
Experimental setup for the measurements with the short DNA duplexes DNA30s and DNA20s. The complementary single strands possessing a thiol-group at their 5′-termini were covalently immobilized on amino-functionalized glass slides/cantilevers using a heterobifunctional PEG spacer.
In all experiments the surface was approached with the tip of the cantilever, allowing two single complementary DNA strands to hybridize and to form a duplex. The cantilever tip was then retracted from the surface and the DNA duplex was loaded with an increasing force until it finally ruptured. Subsequently the cantilever relaxed into its equilibrium position. The force applied to the DNA duplex was recorded as a function of the distance between the cantilever tip and the surface. The elastic properties of PEG lead to a characteristic force-extension curve if an external force is applied. This force-extension curve of the PEG spacer can be fitted with a two-state FJC model with the values from the literature (31). As the complementary oligonucleotides were coupled via a PEG spacer specific interactions can be selected based on the characteristic shape of the force-extension curve resulting from the PEG spacer and the expected length of the PEG spacer.
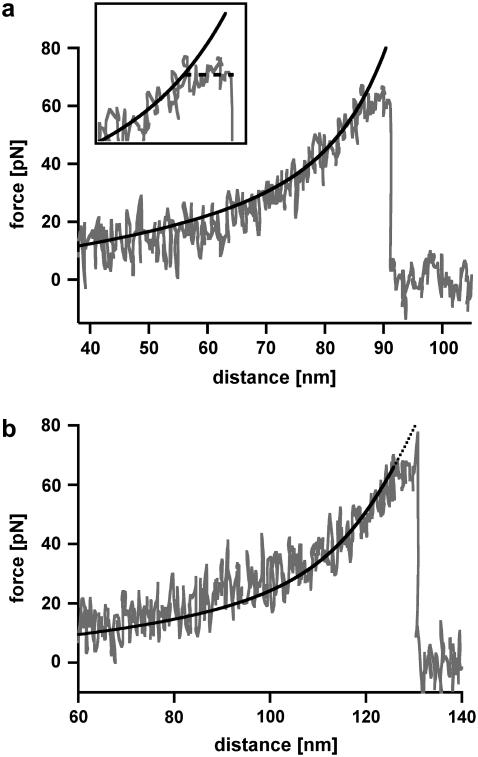
The B-S transition for an oligonucleotide with 30 basepairs (DNA30s) would lead to an extension of 6.3 nm from 9 nm in the B-conformation to 15.3 nm in the S-conformation and therefore should be detectable with high-resolution force spectroscopy. Fig. 4 shows two typical force-extension curves of DNA30s, recorded at a retract velocity of 895 nm/s. At a force of 64 pN the force-extension curve in Fig. 4 a shows a short plateau corresponding to a length of ∼6 nm. This plateau refers to the transition between the B-conformation and the S-conformation of the DNA duplex. During this B-S transition the DNA duplex dissociates. The force-extension curve in Fig. 4 b again shows a B-S transition at a force of 64 pN represented by a short plateau with a length of ∼6 nm. Upon further extension, the force increases to a value of 78 pN, where the DNA duplex finally dissociates. The black curves in Fig. 4, a and b, represent the theoretical extension behavior of the PEG spacer, modeled with a two-state FJC function, which describes the enthalpic and entropic behavior of polymers under an externally applied force (31). For both cases the FJC curve follows the force-extension curve up to the plateau of the B-S transition. At this point the DNA molecule gets elongated and the FJC-fit therefore deviates from the obtained force-extension curve.
FIGURE 4.
Measurements with 30-basepair-long double-stranded DNA (DNA30s). (a) Example of a force-extension curve of DNA30s possessing a B-S transition. The force-extension curve shows a rupture event of a hybridized 30 basepair DNA duplex, recorded at a retract velocity of 895 nm/s. At a force of 64 pN, the force-extension curve shows a short plateau with a length of ∼6 nm (see inset; it spans an area of 40 pN and 18 nm), which corresponds to the B-S transition. During this transition the double-stranded DNA dissociates. The black curve shows a two-state FJC-fit to the force-extension curve, which describes the elastic behavior of the PEG-DNA complex. The FJC-fit follows the force-extension curve up to the point where the DNA elongates due to the B-S transition. This region of constant force diverges from the FJC-fit by a value of up to 6 nm (shortly before rupture). (b) Example of a force-extension curve of DNA30s possessing a B-S transition followed by an additional force increase. At a force of 64 pN, the force-extension curve, which has been recorded at a retract velocity of 895 nm/s, shows a short plateau with a length of ∼6 nm. Again, this plateau corresponds to the B-S transition. After this transition the force increases to a value of 78 pN, where the DNA duplex finally dissociates. The elastic behavior of the PEG-DNA complex is described with a two-state FJC-fit (black curve), which follows the force-extension curve up to the plateau of the B-S transition. This example curve is representative for ∼10% of the measurements.
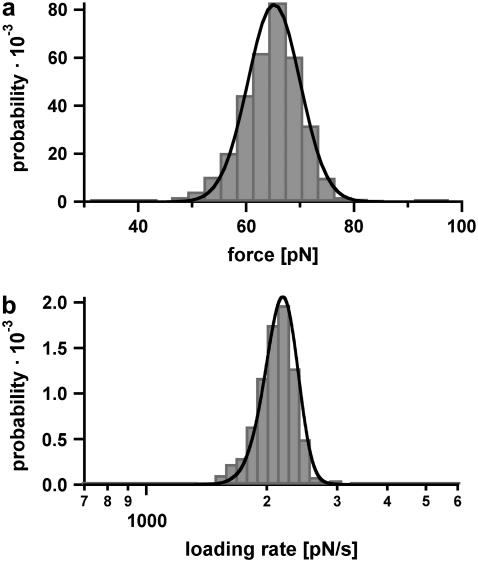
Fig. 5 a shows the measured rupture force distribution, recorded at a retract velocity of 895 nm/s. The force histogram (FWHM = 14.2 pN) contains ∼860 single rupture events and covers forces lower and higher than the critical B-S transition force. More than 50% of the experimentally obtained force-extension curves in this experiment ruptured at forces below 65 pN and therefore did not show the B-S transition. About 30% of the rupture events had short plateaus with lengths between 3 and 7 nm, before dissociating. Less than 10% of the force-extension curves exhibited rupture forces above the B-S transition and showed an additional force increase to 70–80 pN (see Fig. 4 b). The rupture force histogram was fitted in two ways: First, a Gaussian fit (not shown here) was used to determine the most probable rupture force Fmax of 65 pN. Second, the rupture force histogram was fitted with the calculated probability density function p(F) (black curve) as described in the Materials and Method section, yielding a potential width of Δx = 4.4 nm and a natural dissociation rate of koff = 7 × 10⁻²⁸ s−1. Fig. 5 b shows the corresponding histogram of the loading rates (plotted logarithmically) as computed from the FJC-fits. For the cases where the FJC-fit follows the force-extension curve until the final rupture event, the determined loading rates are reliable. However, if a B-S plateau is present, the loading rate cannot be determined precisely with this procedure. Because the analysis methods are based on a two-state model, a conformational change during the dissociation process distorts the values for koff and Δx. Therefore, the histogram in Fig. 5 b contains a certain error. The obtained histograms of the loading rates (plotted logarithmically) were fitted with a Gaussian distribution. This fit yields a maximum probability at 2697 pN s−1.
FIGURE 5.
Example of the measured rupture force and loading rate distributions for the 30-basepair duplex. (a) Histogram of the unbinding forces of DNA30s. The histogram (FWHM = 14.2 pN) contains ∼860 rupture events and exhibits rupture forces above the B-S transition of 65 pN. The histogram is fitted with the calculated probability density function p(F) (black) with Δx = 4.4 nm and koff = 7 × 10⁻²⁸ s−1. To consider the detection noise, the probability density function was convolved with a Gaussian distribution. The standard deviation of the Gaussian distribution equals the typical noise value of the cantilever that was used (4.7 pN). (b) Histogram of the loading rates of DNA30s. The obtained loading rate distribution, plotted logarithmically, is compared with the calculated probability density function  (black).
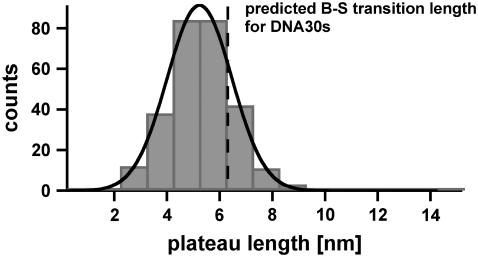
Fig. 6 shows the histogram of the measured plateau lengths for DNA30s, which refer to the B-S transition. The histogram (FWHM = 3.4 nm) contains ∼280 rupture events and was fitted with a Gaussian curve (black), which has a maximum probability at 5.2 nm. The theoretical predicted value for DNA30s equals 6.3 nm and corresponds to a probability of overlap of 66.5%. This difference is significant. The shift of the distribution of the received plateau lengths to shorter lengths is most likely due to melting of the double-stranded DNA during the B-S transition.
FIGURE 6.
Histogram of the plateau lengths of DNA30s. The histogram (FWHM = 3.4 nm) contains ∼280 rupture events and shows the corresponding plateau lengths, which refer to the B-S transition. The histogram was fitted with a Gaussian curve (black) and yielded a most probable value of 5.2 nm. The theoretically predicted value equals 6.3 nm, which is compatible with the measurements within an overlap probability of 66.5%. The smaller experimental value is most likely due to melting of the DNA duplex during the B-S transition.
DNA20s
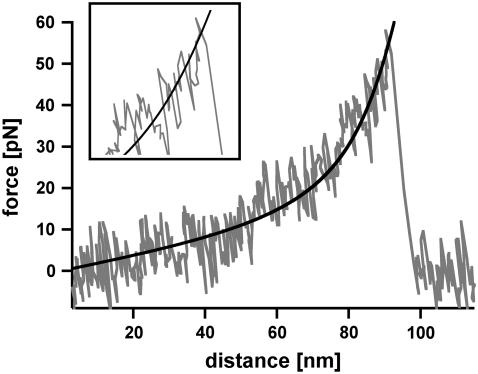
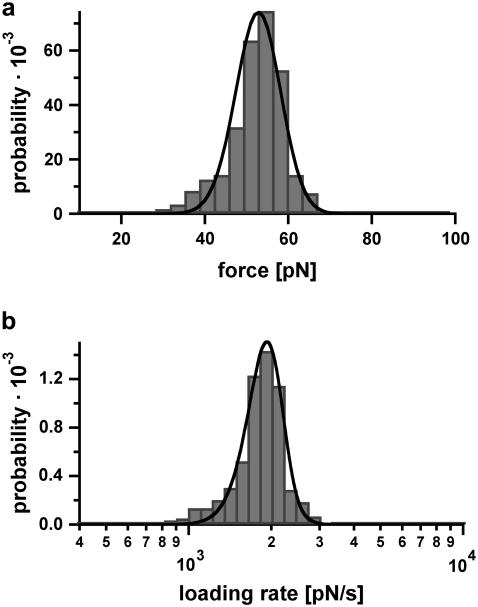
In contrast to the results obtained for DNA30s, the force-extension curves of the DNA duplex containing 20 basepairs (DNA20s) only show a sharp rupture. Fig. 7 shows a typical force-extension curve of DNA20s, recorded at a retract velocity of 1007 nm/s. The force-extension curve does not show any evidence of a B-S transition and dissociates at a force of 53 pN. Fig. 8, a and b, show the obtained rupture force and loading rate distributions, which contain ∼350 single rupture events. From a Gaussian fit to the rupture force histogram (FWHM = 13.9 pN) we obtained a most probable force of 54 pN (not shown here), which is clearly below the most probable force of DNA30s. Additionally, the rupture force distribution was fitted with the calculated probability density function p(F) (black curve) with Δx = 2.7 nm and koff = 6 × 10⁻¹³ s−1. The histogram of the loading rates (plotted logarithmically) exhibits a maximum probability at 1808 pN s−1. Compared with DNA30s, the force distribution obtained for DNA20s, which was recorded at a similar loading rate, exhibits a maximum probability at a lower force. Therefore, under equal conditions, the probability to detect the B-S transition for DNA20s is much smaller than for DNA30s, because 97% of the rupture events already take place at forces below the critical B-S transition force of 65 pN. Again the measurements were performed at various loading rates.
FIGURE 7.
Example of a typical force-extension curve of the 20-basepair DNA duplex (DNA20s). The force-extension curve shows a rupture event of a hybridized 20-basepair DNA duplex, recorded at a retract velocity of 1007 nm/s. The DNA duplex dissociates at a force of 53 pN, without showing any evidence of the B-S transition (see inset). The force-extension curve of the PEG-DNA complex follows the two-state FJC-fit (black) without possessing a measurable deviation.
FIGURE 8.
Example of the measured rupture force and loading rate distributions for the 20-basepair duplex. (a) Histogram of the unbinding forces of DNA20s. The histogram (FWHM = 13.9 pN) contains ∼350 rupture events. More than 97% of the rupture events occur at forces smaller than the B-S transition of 65 pN. The histogram is fitted with the calculated probability density function p(F) (black) with Δx = 2.7 nm and koff = 6 × 10⁻¹³ s−1. To consider the detection noise, the probability density function was convolved with a Gaussian distribution. The standard deviation of the Gaussian distribution equals the typical noise value of the cantilever, which was used (5.0 pN). (b) Histogram of the loading rates of DNA20s. The obtained loading rate distribution, plotted logarithmically, is compared with the calculated probability density function  (black).
Loading rate dependence
Further measurements for both DNA30s and DNA20s were performed to quantify the frequency at which B-S plateaus are observed at different loading rates and to be able to evaluate the data with a second analysis method (loading-rate-based method) to extract Δx and koff. Each data set for DNA20s and DNA30s was measured in one single experiment with one cantilever to avoid spring calibration errors. (If data measured with different cantilevers would be combined, the spring calibration errors could lead to an imprecise analysis of the slope.)
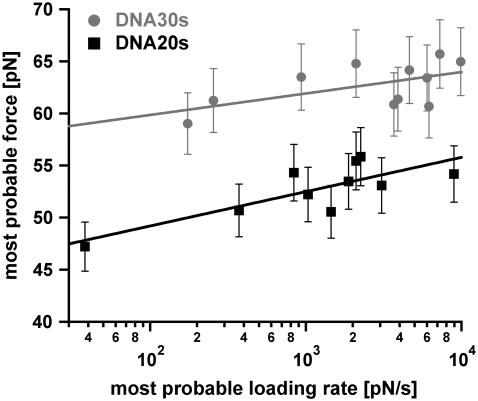
Measurements at faster loading rates result in higher rupture forces as described by the Bell-Evans model (23,24). Therefore, higher loading rates should increase the probability of reaching forces above 65 pN for DNA30s. This would result in a higher fraction of force-extension curves, which exhibit the B-S transition. Unfortunately, from the measured data we cannot confirm this effect unambiguously because the analysis of the detected plateaus for very high loading rates is difficult due to the limitation of the sampling rate of the data recording hardware. Interestingly, the data points still can be fitted with a straight line (Fig. 9). However, the inclination of the fit for DNA30s in the force versus loading rate diagram (plotted logarithmically) is very flat as would be expected when more and more DNA duplexes rupture during the B-S transition for faster loading rates.
FIGURE 9.
Diagram showing the most probable rupture force plotted against the appropriate most probable loading rate (pictured logarithmically) for DNA30s and DNA20s. The data points were gained from the Gaussian fits of the rupture force histogram and the histogram of the loading rates, plotted logarithmically. The gray data points (circles) refer to the measurements with DNA30s, the black data points (squares) correspond to DNA20s. These respective data points are fitted with a straight line according to the loading-rate-based analysis method. The values for Δx and koff are obtained from Eq. 1. For DNA30s the values are Δx = (4.63 ± 2.25) nm and koff = (9.62 × 10⁻²⁸ ± 3.23 × 10⁻²⁶) s−1. For DNA20s the values are Δx = (2.89 ± 0.77) nm and koff = (8.11 × 10⁻¹⁴ ± 7.77 × 10⁻¹³) s−1.
Because the data sets for both DNA30s and DNA20s could be fitted with a straight line, Δx and koff were obtained with the loading-rate-based method in addition. Although the p(F)-based method is an established method for the determination of Δx and koff (30,34) (J. Morfill, K. Blank, C. Zahnd, B. Luginbühl, F. Kühner, K. Gottschalk, A. Plückthun, and H. E. Gaub, unpublished data), the loading-rate-based method is the commonly used method. For DNA20s the following values for Δx and koff were obtained: Δx = (2.89 ± 0.77) nm and koff = (8.11 × 10⁻¹⁴ ± 7.77 × 10⁻¹³) s−1. For DNA30s the values are Δx = (4.63 ± 2.25) nm and koff = (9.62 × 10⁻²⁸ ± 3.23 × 10⁻²⁶) s−1. These values are in good agreement with the values obtained with the p(F)-based analysis method.
DISCUSSION
As indicated in the introduction, Strunz et al. measured the unbinding forces of short complementary oligonucleotides with 30, 20, and 10 basepairs (21). In their measurements they did not observe the B-S transition. However, it was pointed out, that a few unbinding events of the duplex, consisting of 30 basepairs, occur at forces higher than the critical force of the B-S transition. Due to experimental noise the B-S transition could not be resolved in their study. To analyze this critical force regime in greater detail, we performed single molecule force spectroscopy experiments with short DNA duplexes consisting of 20 basepairs (DNA20s) and 30 basepairs (DNA30s) with high-resolution cantilevers. To obtain good statistics, both complementary DNA strands were covalently immobilized to a cantilever tip and a surface. The use of identical chemistry on both sides (cantilever tip and surface) and the use of PEG as a spacer reduce the probability of nonspecific binding events to a minimum. Therefore, a high frequency of specific interactions allowed the measurement of a high number of force-extension curves at various loading rates. The usage of Bio-levers ensured a high force resolution and therefore a detailed analysis of the obtained data.
The recorded force-extension curves for DNA30s clearly show a deviation from the two-state FJC-fit and exhibit a region of constant force at 65 pN. By assuming that PEG follows its characteristic extension curve, we conclude that the DNA duplex is elongated by 3–7 nm (see Fig. 6) and that this lengthening refers to the transition between the B-conformation and the highly overstretched S-conformation of the DNA. The obtained force-extension curves for the oligonucleotide DNA20s do not show any deviation from the two-state FJC-fit (see Fig. 7) for all applied loading rates and mainly exhibit rupture forces below the B-S transition. We conclude that in our experimental setup the applied loading rates are not high enough to reach the critical force of the B-S transition for DNA20s. Therefore, DNA20s can be approximated with a two-state system and the methods used for the analysis of the data are applicable to this system. As expected, higher loading rates shift the rupture force distribution for DNA20s to higher values and therefore to higher rupture forces. The determined value for koff can be considered to represent the natural off-rate of this particular DNA duplex.
In contrast, many rupture events for DNA30s exhibit the typical force plateau of the B-S transition. This leads to the following problems for the analysis of the data. First, as the most probable force increases with the loading rate, one would expect, that a higher fraction of duplexes reaches the critical force of the B-S transition for higher loading rates. As indicated earlier, from the measured data we cannot confirm this effect unambiguously. However, an increasing fraction of duplexes, which reaches the B-S transition, would jolt the rupture force histogram and therefore would shift the maximum probability of the rupture force to lower forces. Second, due to the occurrence of the B-S transition for DNA30s, the determination of the loading rate by means of the two-state FJC-fit is inaccurate. Third, the fact that S-DNA is present with a certain frequency marks a “third state”. Hence, the data analysis based on a two-state system, leads to imprecise values for the potential width Δx and the dissociation rate koff. All these effects can contribute to the relatively flat slope of DNA30s in the plot of the most probable rupture forces against the corresponding most probable loading rates (Fig. 9). Therefore, for DNA30s the obtained value for koff most likely does not represent the natural off-rate although the data can be fitted with a straight line (within the statistical errors) when using the loading-rate-based analysis method.
As has been shown recently by Kühner et al. (36,37), different pulling angles φ will affect the measured rupture forces, detected by the cantilever, of short DNA duplexes. These measured rupture forces decrease by a factor of cos(φ) for increasing pulling angles and reduce the most probable rupture force of a 30-basepair duplex to a value of ∼30 pN for a pulling angle of ∼65°. In these experiments the DNA hybridizes when the cantilever comes in contact with the surface. Because the PEG-DNA complexes form random coils at the surface and the cantilever tip (see Fig. 3), the anchor points for the two hybridizing oligos are in close proximity so that the applied force is nearly vertical when the cantilever is retracted. Thus, within a window of ±10° the pulling angle has very little influence and only results in 2% smaller rupture forces. This shift in the rupture force is below the error of measurement. Therefore, small variations in the pulling angle will hardly affect the measured rupture and also B-S transition forces.
The finding that the B-S transition can be observed in short oligonucleotides has various important implications for force-based experiments with DNA oligonucleotides. Oligonucleotides have been used as DNA handles for the immobilization of RNA to different surfaces (38). In addition, DNA can be used as a force standard. This force standard can be used for detection purposes if an unknown molecular interaction exhibits a higher or lower rupture force (39). In both cases, one has to consider that the rupture of double-stranded DNA cannot be described accurately with the existing models for rupture forces above 65 pN. Whereas the existence of the B-S transition in short duplexes complicates the use of DNA oligonucleotides for the above-mentioned applications, it also opens up new opportunities for the analysis of the mechanism of sequence-specific DNA binders. The effects of cisplatin on the B-S transition (40) have been investigated in detail using λ-DNA. The possibility of using oligonucleotides provides control over the length and the sequence of the DNA duplex. Therefore, the number of potential binding sites of sequence-specific binders can be controlled exactly. Sequence-specific DNA binders are an important class of molecules because they can influence the DNA replication. Many of these are used for cancer therapies (41,42). The opportunity to investigate existing drugs and potential drug candidates may provide new insights into the binding mechanism to DNA and in turn provide design principles for new DNA binding molecules.
SUPPLEMENTARY MATERIAL
To view all of the supplemental files associated with this article, visit www.biophysj.org.
Acknowledgments
The authors thank Angelika Kardinal for the preparation of the DNA1000s, and Gregor Neuert, Elias Puchner, Ludmila Mendelevitch, and Kay Gottschalk for helpful discussions.
This work was supported by the European Union and the Deutsche Forschungsgemeinschaft.
Kerstin Blank's present address is Institut de Science et d'Ingénierie Supramoléculaires (ISIS), Laboratoire de Biologie Chimique, 8, allée Gaspard Monge, BP 70028, 67083 Strasbourg Cedex, France.
Editor: Petra Schwille.
References
- 1.Smith, S. B., L. Finzi, and C. Bustamante. 1992. Direct mechanical measurements of the elasticity of single DNA-molecules by using magnetic beads. Science. 258:1122–1126. [DOI] [PubMed] [Google Scholar]
- 2.Cluzel, P., A. Lebrun, C. Heller, R. Lavery, J. L. Viovy, D. Chatenay, and F. Caron. 1996. DNA: an extensible molecule. Science. 271:792–794. [DOI] [PubMed] [Google Scholar]
- 3.Smith, S. B., Y. J. Cui, and C. Bustamante. 1996. Overstretching B-DNA: the elastic response of individual double-stranded and single-stranded DNA molecules. Science. 271:795–799. [DOI] [PubMed] [Google Scholar]
- 4.Wang, M. D., H. Yin, R. Landick, J. Gelles, and S. M. Block. 1997. Stretching DNA with optical tweezers. Biophys. J. 72:1335–1346. [DOI] [PMC free article] [PubMed] [Google Scholar]
- 5.Rief, M., H. Clausen-Schaumann, and H. E. Gaub. 1999. Sequence-dependent mechanics of single DNA molecules. Nat. Struct. Biol. 6:346–349. [DOI] [PubMed] [Google Scholar]
- 6.Lebrun, A., and R. Lavery. 1996. Modelling extreme stretching of DNA. Nucleic Acids Res. 24:2260–2267. [DOI] [PMC free article] [PubMed] [Google Scholar]
- 7.Lavery, R., and A. Lebrun. 1999. Modelling DNA stretching for physics and biology. Genetica. 106:75–84. [DOI] [PubMed] [Google Scholar]
- 8.Lebrun, A., and R. Lavery. 1998. Modeling the mechanics of a DNA oligomer. J. Biomol. Struct. Dyn. 16:593–604. [DOI] [PubMed] [Google Scholar]
- 9.Konrad, M. W., and J. I. Bolonick. 1996. Molecular dynamics simulation of DNA stretching is consistent with the tension observed for extension and strand separation and predicts a novel ladder structure. J. Am. Chem. Soc. 118:10989–10994. [Google Scholar]
- 10.Ahsan, A., J. Rudnick, and R. Bruinsma. 1998. Elasticity theory of the B-DNA to S-DNA transition. Biophys. J. 74:132–137. [DOI] [PMC free article] [PubMed] [Google Scholar]
- 11.MacKerell, A. D., and G. U. Lee. 1999. Structure, force, and energy of a double-stranded DNA oligonucleotide under tensile loads. Eur. Biophys. J. 28:415–426. [DOI] [PubMed] [Google Scholar]
- 12.Marko, J. F. 1997. Stretching must twist DNA. Europhys. Lett. 38:183–188. [Google Scholar]
- 13.Kosikov, K. M., A. A. Gorin, V. B. Zhurkin, and W. K. Olson. 1999. DNA stretching and compression: large-scale simulations of double helical structures. J. Mol. Biol. 289:1301–1326. [DOI] [PubMed] [Google Scholar]
- 14.Rouzina, I., and V. A. Bloomfield. 2001. Force-induced melting of the DNA double helix. 1. Thermodynamic analysis. Biophys. J. 80:882–893. [DOI] [PMC free article] [PubMed] [Google Scholar]
- 15.Rouzina, I., and V. A. Bloomfield. 2001. Force-induced melting of the DNA double helix. 2. Effect of solution conditions. Biophys. J. 80:894–900. [DOI] [PMC free article] [PubMed] [Google Scholar]
- 16.Williams, M. C., I. Rouzina, and V. A. Bloomfield. 2002. Thermodynamics of DNA interactions from single molecule stretching experiments. Acc. Chem. Res. 35:159–166. [DOI] [PubMed] [Google Scholar]
- 17.Clausen-Schaumann, H., M. Rief, C. Tolksdorf, and H. E. Gaub. 2000. Mechanical stability of single DNA molecules. Biophys. J. 78:1997–2007. [DOI] [PMC free article] [PubMed] [Google Scholar]
- 18.Williams, M. C., J. R. Wenner, I. Rouzina, and V. A. Bloomfield. 2001. Entropy and heat capacity of DNA melting from temperature dependence of single molecule stretching. Biophys. J. 80:1932–1939. [DOI] [PMC free article] [PubMed] [Google Scholar]
- 19.Williams, M. C., J. R. Wenner, I. Rouzina, and V. A. Bloomfield. 2001. Effect of pH on the overstretching transition of double-stranded DNA: evidence of force-induced DNA melting. Biophys. J. 80:874–881. [DOI] [PMC free article] [PubMed] [Google Scholar]
- 20.Wenner, J. R., M. C. Williams, I. Rouzina, and V. A. Bloomfield. 2002. Salt dependence of the elasticity and overstretching transition of single DNA molecules. Biophys. J. 82:3160–3169. [DOI] [PMC free article] [PubMed] [Google Scholar]
- 21.Strunz, T., K. Oroszlan, R. Schäfer, and H. J. Güntherodt. 1999. Dynamic force spectroscopy of single DNA molecules. Proc. Natl. Acad. Sci. USA. 96:11277–11282. [DOI] [PMC free article] [PubMed] [Google Scholar]
- 22.Pope, L. H., M. C. Davies, C. A. Laughton, C. J. Roberts, S. J. Tendler, and P. M. Williams. 2001. Force-induced melting of a short DNA double helix. Eur. Biophys. J. 30:53–62. [DOI] [PubMed] [Google Scholar]
- 23.Bell, G. I. 1978. Models for specific adhesion of cells to cells. Science. 200:618–627. [DOI] [PubMed] [Google Scholar]
- 24.Evans, E., and K. Ritchie. 1999. Strength of a weak bond connecting flexible polymer chains. Biophys. J. 76:2439–2447. [DOI] [PMC free article] [PubMed] [Google Scholar]
- 25.Kühner, F., J. Morfill, R. A. Neher, K. Blank, and H. E. Gaub. 2007. Force-induced DNA slippage. Biophys. J. 92:2491–2497. [DOI] [PMC free article] [PubMed] [Google Scholar]
- 26.Neuert, G., C. Albrecht, E. Pamir, and H. E. Gaub. 2006. Dynamic force spectroscopy of the digoxigenin-antibody complex. FEBS Lett. 580:505–509. [DOI] [PubMed] [Google Scholar]
- 27.Blank, K., J. Morfill, and H. E. Gaub. 2006. Site-specific immobilization of genetically engineered variants of Candida Antarctica lipase B. ChemBioChem. 7:1349–1351. [DOI] [PubMed] [Google Scholar]
- 28.Butt, H. J., and M. Jaschke. 1995. Calculation of thermal noise in atomic-force microscopy. Nanotechnology. 6:1–7. [Google Scholar]
- 29.Hugel, T., and M. Seitz. 2001. The study of molecular interactions by AFM force spectroscopy. Macromol. Rapid Commun. 22:989–1016. [Google Scholar]
- 30.Friedsam, C., A. K. Wehle, F. Kühner, and H. E. Gaub. 2003. Dynamic single-molecule force spectroscopy: bond rupture analysis with variable spacer length. J. Phys. Condens. Matter. 15:S1709–S1723. [Google Scholar]
- 31.Oesterhelt, F., M. Rief, and H. E. Gaub. 1999. Single molecule force spectroscopy by AFM indicates helical structure of poly(ethylene-glycol) in water. N. J. Phys. 1:1–11. [Google Scholar]
- 32.Kühner, F., and H. E. Gaub. 2006. Modelling cantilever-based force spectroscopy with polymers. Polym. 47:2555–2563. [Google Scholar]
- 33.Neher, R. A., and U. Gerland. 2004. Dynamics of force-induced DNA slippage. Phys. Rev. Lett. 93:198102. [DOI] [PubMed] [Google Scholar]
- 34.Kühner, F., L. T. Costa, P. M. Bisch, S. Thalhammer, W. M. Heckl, and H. E. Gaub. 2004. LexA-DNA bond strength by single molecule force spectroscopy. Biophys. J. 87:2683–2690. [DOI] [PMC free article] [PubMed] [Google Scholar]
- 35.Reference deleted in proof.
- 36.Kühner, F., M. Erdmann, L. Sonnenberg, A. Serr, J. Morfill, and H. E. Gaub. 2006. Friction of single polymers at surfaces. Langmuir. 22:11180–11186. [DOI] [PubMed] [Google Scholar]
- 37.Kühner, F., M. Erdmann, and H. E. Gaub. 2006. Scaling exponent and Kuhn length of pinned polymers by single molecule force spectroscopy. Phys. Rev. Lett. 97:218301. [DOI] [PubMed] [Google Scholar]
- 38.Liphardt, J., S. Dumont, S. B. Smith, I. Tinoco, and C. Bustamante. 2002. Equilibrium information from nonequilibrium measurements in an experimental test of Jarzynski's equality. Science. 296:1832–1835. [DOI] [PubMed] [Google Scholar]
- 39.Albrecht, C., K. Blank, M. Lalic-Multhaler, S. Hirler, T. Mai, I. Gilbert, S. Schiffmann, T. Bayer, H. Clausen-Schaumann, and H. E. Gaub. 2003. DNA: a programmable force sensor. Science. 301:367–370. [DOI] [PubMed] [Google Scholar]
- 40.Krautbauer, R., H. Clausen-Schaumann, and H. E. Gaub. 2000. Cisplatin changes the mechanics of single DNA molecules. Angew. Chem. Int. Ed. Engl. 39:3912–3915. [DOI] [PubMed] [Google Scholar]
- 41.Baraldi, P. G., A. Bovero, F. Fruttarolo, D. Preti, M. A. Tabrizi, M. G. Pavani, and R. Romagnoli. 2004. DNA minor groove binders as potential antitumor and antimicrobial agents. Med. Res. Rev. 24:475–528. [DOI] [PubMed] [Google Scholar]
- 42.Reddy, B. S., S. K. Sharma, and J. W. Lown. 2001. Recent developments in sequence selective minor groove DNA effectors. Curr. Med. Chem. 8:475–508. [DOI] [PubMed] [Google Scholar]


