Abstract
Convolution is one of the most common operations in image processing. Based on experimental findings on motion-sensitive visual interneurons of the fly, we show by realistic compartmental modeling that a dendritic network can implement this operation. In a first step, dendritic electrical coupling between two cells spatially blurs the original motion input. The blurred motion image is then passed onto a third cell via inhibitory dendritic synapses resulting in a sharpening of the signal. This enhancement of motion contrast may be the central element of figure–ground discrimination based on relative motion in the fly.
Many brain areas consist of topographically organized columns (1). As such, they form a matrix representation of the sensory surface maintaining neighborhood relations between successive processing layers. Single cells could potentially perform spatial signal processing on this type of matrix representation, but apart from pooling operations like dendritic integration, operations over a large set of columns have rarely been considered. In recent years, however, the experimentally observed repertoire of dendritic processing has expanded dramatically (2–5), stressing the computational power of single neurons. In the current study, we explore the computational power of single neurons when dendrites are not used as pooling devices but rather as filters with spatially distributed output.
Our example focuses on the visual system of the blowfly Calliphora vicina in which the columnar organization, originating in the retina, is conserved throughout the three visual neuropiles. In the posterior part of the third visual ganglion, the lobula plate, large tangential cells are found forming a group of ≈60 large, individually identifiable sensory interneurons. They respond to visual motion in a directionally selective way (6) by spatially integrating over a large field of retinotopically arranged local motion-sensitive elements (7). As a result, the potential spread and closely correlated Ca2+ concentration (8, 9) in the dendrites of these cells follow a spatially explicit representation of the stimulus. They have been shown to be ideally suited to analyze the influence of anatomical structure and synapse distribution on dendritic processing (10–12).
Among the horizontally sensitive tangential cells of the lobula plate two different neuron types are found, the horizontal system (HS) and the centrifugal horizontal (CH) cells. The HS family comprises three members that survey the northern, equatorial, (HSE) and southern (HSS) areas of the visual field. Their dendrites cover the dorsal, median, and ventral part of the lobula plate, respectively. These cells connect via descending neurons to thoracic ganglions (13) and are thought to be involved in course control (14). There are two CH cells, dorsal and ventral (vCH), whose receptive fields also correspond to the location of their dendrites. The retinotopic organization in the dendritic tree plays a special role in those cells: CH cells possess inhibitory (15) presynaptic specializations within their dendrites (16). Their output therefore has an additional spatial component not present in axon–dendritic communication. In contrast to HS cells, CH cells do not receive ipsilateral visual input directly from columnar elements but indirectly via dendro-dendritic electrical synapses from the overlapping dendritic trees of HS cells (17). This indicates that the information from HS cells is processed spatially and passed on within a dendritic network of lobula plate tangential cells. By measuring the dendritic calcium distribution while stimulating the fly with a small moving object, it could be shown that signals are blurred in CH cells compared with HS cells (17, 18); this could represent an important processing step made possible only by a dendritic network. In other experiments, it was shown that, after selective laser ablation of the CH cell, the small-field selectivity of so-called figure-detection (FD) cells (19) is eliminated (20). Thus, CH cells and the underlying dendritic network must be part of the neural pathway for detection of relative motion.
By detailed compartmental modeling we will investigate how these experimental observations relate to one another. In particular, we will show how the electrical dendro-dendritic connectivity between HS and CH cells gives rise to the blurring of a motion image, and that this is a step toward making FD cells sensitive to small moving objects.
Methods
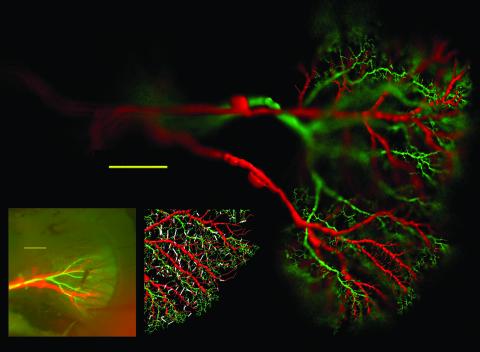
Following refs. 21–23 closely, preexisting models for HSS, HSE, and vCH were transposed to NEURON (24). The model cells originating from different animals were rearranged such that their dendritic trees were superimposed in a realistic way (compare Fig. 1 with its Left Inset). For measurements or current injections, electrodes were placed in the axons of the model cells in similar positions as in the experiments. The planar dendritic arborization was considered two-dimensionally (X, frontal–lateral; Y, dorsal–ventral), and a grid with 10-μm spacing was overlaid. Linear conductances were drawn to represent electrical synapses between one dendrite from the HS model and one dendrite from the CH model, if existent, in each square of the grid, choosing the connection with the shortest distance. This procedure resulted in 760 such synapses.
Fig. 1.
Realistic compartmental models of a vCH cell (green), connected to an HSS and an HSE cell (red). (Left Inset) Original fluorescent staining for comparison. (Scale bar is 100 μm in both pictures.) (Right Inset) Location of electrical synapses (white) used for these analyses.
Model Calibration. We calibrated the model parameters to a data set derived from single and dual cell recordings (17, 21, 22). Because of the additional leak conductance after the electrical coupling and the resulting change in input resistance, the original membrane properties of the models needed to be readjusted to the measured I–V curves together with the conductance value of the connection. New values are shown in Table 1, which is published as supporting information on the PNAS web site, www.pnas.org; the overall membrane resistance increased, whereas the axial resistance of the HS models decreased, making the cells more compact. The conductance value of a single electrical synapse resulted in a reasonable value of 210 pS. Because this value is realistic, the number of synapses chosen might also be in the natural range. Interestingly, this corresponds approximately to the number of underlying input columns.
Connection Properties. The temporal low-pass property of the connection was verified with dynamic voltage clamp in a passive HS model by following the shape of an averaged recorded rebound spike in an HS cell and observing the membrane potential change in the CH model axon. Local stimuli in HS and CH models were simulated as current clamp electrodes as well as realistic synaptic conductance changes derived from calculated correlation detector array outputs (see ref. 23). Electrical synapses were two-sided point processes programmed in nmodl (25). matlab and origin served as an interface to neuron for arranging the models and data processing. Ray-tracing pictures were obtained with the Persistence of Vision Ray tracer (POV-Ray). Focal blur and inherent shining were added to match original pictures.
Simplified Model. Passive cylinders of 2.5-mm length and a diameter of 3 μm were connected by five electrical synapses in 100-μm distance from each other surrounding the current injection site. Their conductance value was set to 2.5 nS to obtain a similar current transfer as measured in ref. 17. Axial resistance was 100 Ω cm, membrane resistance 2.5 kΩ cm2 and the membrane capacitance was 1 μF/cm2. The broadening of the signal in CH was very stable throughout the parameter space.
Results and Discussion
As a first step, compartmental models of a vCH, an HSE, and an HSS cell were appropriately arranged (Fig. 1) and connected to each other by linear electrical conductances.
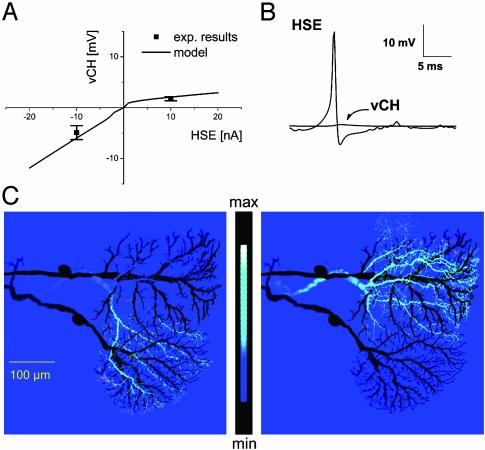
This model of three electrically connected neurons accurately reproduced the experimental results on many levels. (i) The model exhibited a significant outward rectification in the transfer function between the HS and the CH model (Fig. 2A) as has been observed experimentally (17). Because the electrical synapse was represented as a linear conductance, the rectifying noninactivating potassium currents in both cells (22) are sufficient to explain the phenomenon of outward rectification. (ii) Double recordings had shown that action potentials did not spread from HS to CH cells (17). In this model, we see the same effect when electrical synapses without any dynamic properties are used (Fig. 2B). The high-frequency signal attenuation thus is a property inherent to each neuron's individual cellular processes. (iii) In agreement with experimental results (17), simulated axonal current injections into either HS model resulted in a membrane response only in the CH model dendritic area that overlapped with the stimulated HS model (Fig. 2C). (iv) A realistic axonal visual response was found in the CH model when only the HS model was given a simulated visual input. The input resistance change was only 5% in the CH model and, as such, was close to the experimental results. Thereby, this model overcomes problems of previous simulations where CH cells were modeled to receive visual input directly (23).
Fig. 2.
Calibration and validation of the model. (A) I–V curve (current injection in HSE, voltage response in vCH). The model follows the rectification observed in real cells. (B) Action potentials in HSE model do not travel to the vCH model axon. (C) Current injection into HSS (Left) and in HSE (Right) results in a localized potential change only in the respectively superimposed dendrites of vCH. Potential change in vCH model is shown as a false-color image. The anatomy of HSS and HSE is outlined in black.
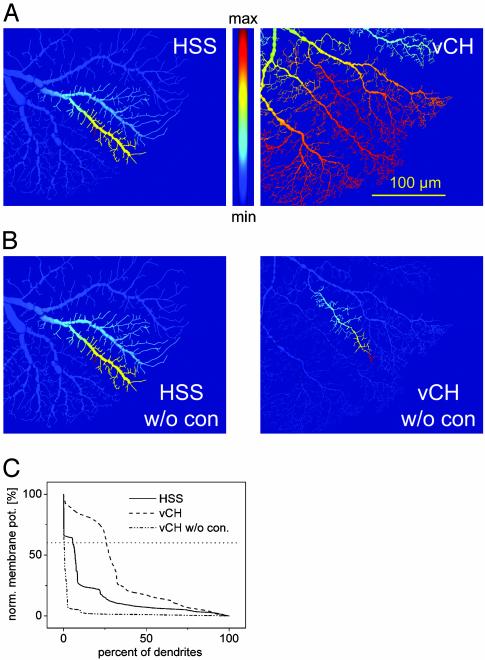
To examine the spatial low-pass characteristics (blurring) found in CH cells, currents were injected into different dendrites of the HS models and the voltage distribution was compared between the two model cell types. The potential spread was consistently broader in the vCH model (Fig. 3A, for the experimental counterpart see ref. 17). To test whether this was an effect of the vCH cell anatomy alone or a property of the connection, currents were injected into the dendrites of the isolated models. Here, the potential spread in the vCH model was narrower than that found in the connected model after HS model current injection (Fig. 3B). The membrane depolarization spread is quantified in Fig. 3C, where the ranked membrane potential distribution is shown for each neuron in the two simulations (see Fig. 6, which is published as supporting information on the PNAS web site, for different arrangements and statistics). These simulation results imply that the electrical connection between the two neurons and not their geometry are responsible for the blurring of signals passing from HS to CH neurons.
Fig. 3.
Example of the blurring effect of the HS–CH connection. (A) Potential spread in HSS model (Left) and vCH model (Right) after local current injection into HSS. (B) Same as A, but HSS and vCH models were not connected to each other. Current was injected in HSS (Left) and vCH (Right). (C) Quantification of model results: ranked membrane potential distribution in HSS and vCH model dendrites, connected and unconnected. For example, 6% of HS dendrites and 26% of vCH dendrites are >60% of the maximum potential (dotted line) when connected to each other. When current is injected into an unconnected vCH model, only 0.37% of its dendrites are >60% of the maximum potential.
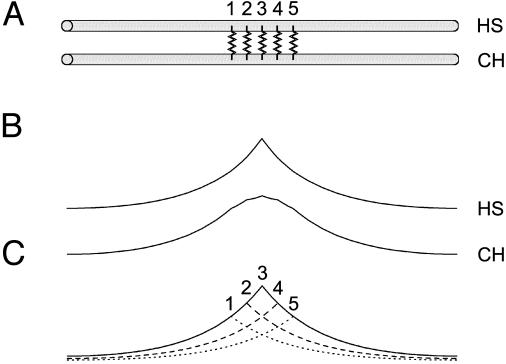
To better understand how the blurring effect originates, we examined the properties of the electrical connection in a simplified model of two identical cylinders connected by five conductances (Fig. 4A). After point-like current injection in the first cylinder, a broadening of the signal was observed in the second compartment (Fig. 4B). The current feedback being negligible, the potential in the second cylinder approximates a simple summation of individual currents through the synapses (Fig. 4C). This can be examined analytically by convolving the signal with a kernel determined by the filtering properties of the cells. With f1(x) and f2(x) describing the potential distribution in the first and in the second cylinder, respectively, we find
 |
1 |
 |
2 |
where x is the location and λ is the length constant. By solving Eqs. 1 and 2 at a distance λ from the point of current injection, the attenuation in the second cylinder is much smaller than in the first one: f1(x = λ) = 1/e, f2(x = λ) = 2/e (see Equations Appendix for more detail). Hence, blurring is determined by the length constant λ of both cells, which in turn depends on the dendritic anatomy as well as on the axial and transmembrane resistance (26).
Fig. 4.
Simplified model. (A) Two cylinders (HS and CH) are connected by five linear conductances surrounding the location of current injection. (B) In HS, the signal spreads after an exponential decay. The CH spread is broader. (C) The CH spread can be approximated by the sum of passive spread through each conductance.
In other words, although a local signal in the HS cell is distributed after an exponential decay, the signal in the CH cell is a result of convolving the local signal first with the spread function of HS and then additionally with the one of the CH cell. The effect shown here in the one-dimensional space has a second dimension in the models with complete anatomy following the dendritic orientation and structure of both cells. Because the signal in the HS model is stronger throughout the dendrite than the signal in the CH model, current flows into the CH model over a large area of its dendritic tree. This finding and the fact that the dendritic processes of both cells extend in all directions explain the blurring perpendicular to the main orientation of dendrites in the CH cell model. This is consistent with experiments in which two local visual stimuli (dorsal and ventral) were shown to the fly and the calcium responses in the CH cell overlapped along the vertical axis (18).
Conclusions
By connecting realistic models of HS and CH cells with linear conductances we have shown that their dendro-dendritic electric coupling leads to a spatial blurring of the signals being passed from one cell to the other. This means that in addition to their integrative properties (12), lobula plate tangential cells form a dendritic network allowing for complex image processing with only a few cells.
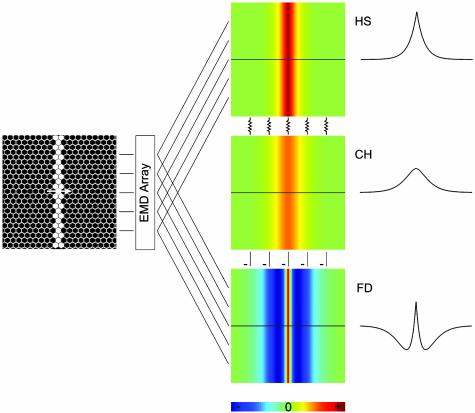
Then, the blurred motion image, as represented in the CH cell dendrites, is passed on via inhibitory dendritic synapses (16, 15) to FD cells, making them selective for small-field motion (20). This puts the unique properties of the CH cell into a functional context. Whether directly or indirectly, subtracting the CH cell's blurred motion image from the FD cell's own local motion detector input leads to a sharpening of the original image, equivalent to an enhanced motion contrast (Fig. 5). Similar interactions of large-field sensitive tangential cells in motion contrast calculation had been suggested before (27, 28). At that time, however, the spatial dimension of the dendritic output had not been considered (dendrites were considered compact) and an extensive reconnection of the pooled signal to columnar elements was consequently proposed to underlie this computation. We show here an alternative solution where motion contrast is enhanced by a small dendritic network, performing stepwise image processing at a minimal cost with respect to neuronal expenditure.
Fig. 5.
Consequences of the CH cell dendritic image blurring for relative motion detection. An array of elementary motion detectors computes the image motion in a retinotopic way, feeding onto the dendrites of HS and FD cells. Via dendro-dendritic connections between HS and CH cells, this motion representation is blurred in the dendrites of the CH cell. By conveying inhibitory dendro-dendritic input to FD cells, being subtracted from the retinotopic input, an enhancement of the motion edges is achieved.
Equations Appendix
The potential distribution (Eq. 1) was calculated assuming passive compartments of infinite length, and the current injection was steady state in position x = 0. The signal in the second compartment, f2(x), is then the summation of signals entering through the individual conductances that in turn spread passively each following Eq. 1, which analytically represents a convolution such that
 |
3 |
where xsyn is the location of the conductances. Assuming identical length constants in both cells and a continuous distribution of electrical synapses this can be simplified as follows (because of the absolute values the response needs to be decomposed). For x < 0:
 |
4 |
becomes
 |
5 |
which is
 |
6 |
To compare this to Eq. 1, we normalize to f2(x = 0) = 1:
 |
7 |
Out of symmetry, Eq. 2 can be derived.
Supplementary Material
Acknowledgments
We thank V. Flanagin, K. Farrow, and D. Reiff for carefully reading the manuscript.
This paper was submitted directly (Track II) to the PNAS office.
Abbreviations: HS, horizontal system; CH, centrifugal horizontal; HSE, equatorial HS; HSS, southern HS; vCH, ventral CH; FD, figure detection.
References
- 1.Mountcastle, V. B. (1997) Brain 120, 701-722. [DOI] [PubMed] [Google Scholar]
- 2.Euler, T. & Denk, W. (2001) Curr. Opin. Neurobiol. 11, 415-422. [DOI] [PubMed] [Google Scholar]
- 3.Koch, C. & Segev, I. (2000) Nat. Neurosci. 3, Suppl., 1171-1177. [DOI] [PubMed] [Google Scholar]
- 4.Yuste, R. & Tank, D. W. (1996) Neuron 16, 701-716. [DOI] [PubMed] [Google Scholar]
- 5.Miller, J. P. & Jacobs, G. A. (1984) J. Exp. Biol. 112, 129-145. [DOI] [PubMed] [Google Scholar]
- 6.Borst, A. & Haag, J. (2002) J. Comp. Physiol. A 188, 419-437. [DOI] [PubMed] [Google Scholar]
- 7.Borst, A. & Egelhaaf, M. (1992) Proc. Natl. Acad. Sci. USA 89, 4139-4143. [DOI] [PMC free article] [PubMed] [Google Scholar]
- 8.Egelhaaf, M. & Borst, A. (1995) J. Neurophysiol. 73, 2540-2552. [DOI] [PubMed] [Google Scholar]
- 9.Haag, J. & Borst, A. (2000) J. Neurophysiol. 83, 1039-1051. [DOI] [PubMed] [Google Scholar]
- 10.Borst, A., Egelhaaf, M. & Haag, J. (1995) J. Comput. Neurosci. 2, 5-18. [DOI] [PubMed] [Google Scholar]
- 11.Haag, J. & Borst, A. (1996) Nature 379, 639-641. [Google Scholar]
- 12.Single, S. & Borst, A. (1998) Science 281, 1848-1850. [DOI] [PubMed] [Google Scholar]
- 13.Hausen, K., Wolburg-Buchholz, W. & Ribi, W. A. (1980) Cell Tissue Res. 208, 371-387. [DOI] [PubMed] [Google Scholar]
- 14.Geiger, G. & Nassel, D. R. (1981) Nature 293, 398-399. [DOI] [PubMed] [Google Scholar]
- 15.Meyer, E. P., Matute, C., Streit, P. & Nassel, D. R. (1986) Histochemistry 84, 207-216. [DOI] [PubMed] [Google Scholar]
- 16.Gauck, V., Egelhaaf, M. & Borst, A. (1997) J. Comp Neurol. 381, 489-499. [PubMed] [Google Scholar]
- 17.Haag, J. & Borst, A. (2002) J. Neurosci. 22, 3227-3233. [DOI] [PMC free article] [PubMed] [Google Scholar]
- 18.Durr, V. & Egelhaaf, M. (1999) J. Neurophysiol. 82, 3327-3338. [DOI] [PubMed] [Google Scholar]
- 19.Egelhaaf, M. (1985) Biol. Cybern. 52, 195-209. [Google Scholar]
- 20.Warzecha, A. K., Egelhaaf, M. & Borst, A. (1993) J. Neurophysiol. 69, 329-339. [DOI] [PubMed] [Google Scholar]
- 21.Borst, A. & Haag, J. (1996) J. Comput. Neurosci. 3, 313-336. [DOI] [PubMed] [Google Scholar]
- 22.Haag, J., Theunissen, F. & Borst, A. (1997) J. Comput. Neurosci. 4, 349-369. [DOI] [PubMed] [Google Scholar]
- 23.Haag, J., Vermeulen, A. & Borst, A. (1999) J. Comput. Neurosci. 7, 213-234. [DOI] [PubMed] [Google Scholar]
- 24.Hines, M. L. & Carnevale, N. T. (1997) Neural Comput. 9, 1179-1209. [DOI] [PubMed] [Google Scholar]
- 25.Hines, M. L. & Carnevale, N. T. (2000) Neural Comput. 12, 995-1007. [DOI] [PubMed] [Google Scholar]
- 26.Rall, W. (1959) Exp. Neurol. 1, 491-527. [DOI] [PubMed] [Google Scholar]
- 27.Reichardt, W., Poggio, T. & Hausen, K. (1983) Biol. Cybern. 46, 1-30. [Google Scholar]
- 28.Egelhaaf, M. (1985) Biol. Cybern. 52, 267-280. [Google Scholar]
Associated Data
This section collects any data citations, data availability statements, or supplementary materials included in this article.


