

Abstract
The mechanism responsible for electromotility of outer hair cells in the ear is unknown but is thought to reside within the plasma membrane. Lipid lateral diffusion in the outer hair cell plasma membrane is a sigmoidal function of transmembrane potential and bathing media osmolality. Cell depolarization or hyposmotic challenge shorten the cell and reduce membrane fluidity by half. Changing the membrane tension with amphipathic drugs results in similar reductions. These dynamic changes in membrane fluidity represent the modulation of membrane tension by lipid-protein interactions. The voltage dependence may be associated with the force-generating motors that contribute to the exquisite sensitivity of mammalian hearing.
Membranes define the boundaries of cells and maintain the electrochemical gradients required for life. In addition, the lateral wall plasma membrane of the mammalian cochlear outer hair cell (OHC) is involved in voltage-dependent changes in cell length, or electromotility (1). OHC electromotility is fundamental to the hearing sensitivity and selectivity of all mammals (2), but its mechanism is not known. Voltage-dependent changes in cell length must involve interactions between components of the plasma membrane and the cytoskeleton. We sought to investigate these lipid-protein interactions by measuring the fluidity of the phospholipid bilayer under three different experimental manipulations. We varied the membrane potential, modulated the intracellular pressure, and added drugs known to change membrane tension and curvature.
The rate of lateral diffusion of intramembrane lipids provides a measure of membrane fluidity (3). Lipid lateral diffusion can be affected by the phase state of the membrane, the individual types of membrane components (phospholipids, cholesterol, and protein), and their interactions (4). Guinea pig OHCs were isolated in vitro and stained with a fluorescent membrane lipid (di-8-ANEPPS) (5). We measured the lateral diffusion of di-8-ANEPPS in the lateral wall plasma membrane with fluorescence recovery after photobleaching (6). The diffusion coefficient of the lateral wall plasma membrane measured in this study ranged between 1.34 × 10⁻⁹ and 7.16 × 10⁻⁹ cm2/s. These values are comparable to those previously reported for the OHC and lie within the range of those reported for other eukaryotic membranes (5, 7).
OHC membrane potential was controlled by voltage clamp during measures of lateral diffusion (8). Membrane fluidity was voltage-dependent, decreasing up to 51% with depolarization (Fig. 1A). Saturation of the diffusion coefficient occurred at the voltage extremes. Sequential measurements of the diffusion coefficient in single cells at −60 mV, 0 mV, and then again at −60 mV revealed the voltage-dependent change in lateral diffusion to be reversible. The average diffusion coefficient went from 4.26 × 10⁻⁹ ± 0.42 × 10⁻⁹ to 1.96 × 10⁻⁹ ± 0.33 × 10⁻⁹ to 3.74 × 10⁻⁹ ± 0.55 × 10⁻⁹ cm2/s (mean ± SEM; n = 4). The diffusion coefficient in cultured rat hippocampal neurons (our control cells) did not change with changes in holding potential, going from 3.55 × 10⁻⁹ ± 0.24 × 10⁻⁹ cm2/s at −60 mV to 3.59 × 10⁻⁹ ± 0.21 × 10⁻⁹ cm2/s at 0 mV (mean ± SEM; n = 9).
Fig. 1. Lateral diffusion in the OHC lateral wall plasma membrane.

Each point is the average of at least five different measurements, each from a different cell. The error bars represent the SEM. (A) D was measured at holding potentials ranging from +40 to −100 mV (total of 70 measurements from 41 cells). The error bar for the point at 40 mV is smaller than the symbol size. The Boltzmann fit values are: Ddepolarized = 2.18 × 10⁻⁹ cm2/s, Dhyperpolarized = 4.44 × 10⁻⁹ cm2/s, V1/2 = −36 mV, s = 12 mV (23).(B) D was measured while the osmolality of the extracellular solution was varied between 245 and 365 mOsm/kg (total of 275 cells, one measurement per cell). The error bar for the point at 300 mOsm/kg is smaller than the symbol size. The Boltzmann fit values are: Dhypotonic = 3.70 × 10⁻⁹ cm2/s, Dhypertonic = 6.34 × 10⁻⁹ cm2/s, Osm1/2 (the osmolality at the midpoint of the change in D) = 316 mOsm/kg, s = 20 mOsm/kg. The slightly higher D values in these cells compared with those in (A) may be related to differences in intracellular pressure associated with the patch-clamp technique (17).(C) The percent change in cell length (L) was measured while the osmolality of the extracellular solution was varied. This was normalized to their length at 300 mOsm/kg (total of 154 measurements from 77 cells). The Boltzmann fit values are: Lhypotonic = −5.79%, Lhypertonic = 3.51%, Osm1/2 = 294 mOsm/kg, s = 13 mOsm/kg.(D) D was plotted versus L [with the same data as (B) and (C)]. The relation was fit with an exponential function, D = D0 + Aexp(RL), with fit values D0 = 3.43 × 10⁻⁹ cm2/s, A = 1.21 × 10⁻⁹ cm2/s, R = 0.21.
Changes in membrane potential result in OHC length changes. Another way to change OHC length is to vary the intracellular pressure by changing the osmolality of the extracellular bathing media (9). Solutions with lower osmolality caused cell shortening and a decrease in the diffusion coefficient (Fig. 1, B and C). These effects were reversible, and both the cell length and the diffusion coefficient saturated at the osmotic extremes. The relation of cell length to membrane fluidity is exponential (Fig. 1D). Deiters’ cells (supporting cells in the cochlea that co-isolate with OHCs) were used as controls. They underwent shape changes in response to osmotic challenge but had no change in their membrane diffusion coefficient.
Finally, the plasma membrane was directly manipulated by applying amphipathic drugs known to change membrane tension and curvature in red blood cells (RBCs) and COS cell cultures (10). The bilayer-couple hypothesis(11) argues that drugs which alter membrane curvature preferentially partition into either the outer or the inner leaflet of the phospholipid bilayer, selectively increasing that leaflet’s surface area. Differences between outer and inner leaflet area alter membrane tension and curvature. We applied a drug that bends membranes outward (salicylate) and another that bends membranes inward (chlorpromazine) to a preparation containing guinea pig OHCs and RBCs (Fig. 2)(12). Although we found the expected morphologic changes in RBCs, the drugs evoked no change in the microscopic appearance of the OHCs (n = 39). However, measurements of OHC lipid lateral diffusion did show an effect of drug application (Fig. 2F). The presence of salicylate alone or chlorpromazine alone reduced the diffusion coefficient by 53 and 33%, respectively. There was no significant difference between the diffusion coefficient of control OHCs and OHCs incubated in salicylate and chlorpromazine together. Perfusion of the curvature-altering drugs did not change the zero-current potentials or current-voltage characteristics of OHCs under voltage clamp (13). We measured the electromotile voltage-displacement relations with a voltage-step protocol (Fig. 3)(14). OHCs bathed in either the control medium or in chlorpromazine alone had similar transfer functions. OHCs bathed in salicylate alone had an attenuated electromotile response. Although chlorpromazine had reversed salicylate’s effect on lateral diffusion, it did not reverse salicylate’s attenuation of electromotility.
Fig. 2. The effects of curvature-altering drugs on cell morphology and lateral diffusion.

The RBCs serve as a bioassay for the curvature-altering drugs. (A) RBCs were biconcave in the control solution, (B) crenulated in salicylate alone, (C) biconcave in a solution of salicylate and chlorpromazine combined, (D) cupped in chlorpromazine alone, and (E) biconcave after wash-out with control solution. During this 5-min sequential drug application, the length, width, and morphologic appearance of the OHC did not change appreciably. (F) The D value of the OHC lateral wall plasma membrane was reduced from controls (cntl) in the presence of either salicylate alone (sal) or chlorpromazine alone (cpz). It was unchanged in the presence of salicylate and chlorpromazine combined (both) (P = 0.38). The values in parentheses indicate the number of cells averaged together for each measurement and the error bars represent the SEM; a significant difference from control is indicated by an asterisk (P < 0.01, Student’s nonpaired t-test). The D values were as follows (mean ± SEM): cntl, 5.46 × 10⁻⁹ ± 0.44 × 10⁻⁹ cm2/s; sal, 2.58 × 10⁻⁹ ± 0.25 × 10⁻⁹ cm2/s; cpz, 3.64 × 10⁻⁹ ± 0.32 × 10⁻⁹ cm2/s; both, 4.83 × 10⁻⁹ ± 0.41 × 10⁻⁹ cm2/s.
Fig. 3. The effects of curvature-altering drugs on OHC electromotility.

The percent change in cell length(L)was measured as the holding potential was varied, normalized to cell length at −60 mV. The control cell (cntl) demonstrated the normal electromotile response. The presence of chlorpromazine alone (cpz) did not suppress electromotility. Salicylate alone (sal) blunted the electromotile response. Chlorpromazine failed to restore electromotility in the presence of salicylate (both). Each curve was obtained from a different cell. The Boltzmann fit values are: cntl, Lhyperpolarized = 2.25%, Ldepolarized = −5.64%, V1/2 = −19 mV, s = 42 mV; sal, Lhyperpolarized = 0.39%, Ldepolarized = −0.65%, V1/2 = −35 mV, s = 41 mV; cpz, Lhyperpolarized = 2.10%, Ldepolarized = −6.73%, V1/2 = −17 mV, s = 37 mV; both, Lhyperpolarized = 0.91%, Ldepolarized = −0.81%, V1/2 = −58 mV, s = 59 mV.
Here the dynamic modulation of membrane fluidity is described. Specifically, we measured the lateral diffusion of a fluorescent probe as an estimate of lipid (as opposed to protein) mobility within the plasma membrane. The voltage range over which lateral diffusion is voltage-dependent suggests that the change in membrane fluidity is linked to electromotility. Our measurements are sensitive to the lipid-protein interactions that occur in the membrane, and the shape of the voltage-diffusion coefficient relation extends our understanding of the interaction between the motor complex and the plasma membrane. An intramembrane area–motor that flickers between two states (15) should agitate the surrounding membrane phospholipids and result in an increased lateral diffusion. Because the highest rate of flicker should occur at the V1/2 (the potential at the midpoint of the length change) of the electromotility transfer function (16), the diffusion coefficient would be expected to peak between −40 and −20 mV. Our data do not reveal a peak in this voltage range. However, electromotility and membrane tension are intimately related. Tension applied to the OHC influences the voltage dependence of electromotility and modulates the nonlinear capacitance of the plasma membrane (15, 17, 18) . It is likely that changes in membrane tension, induced by each of our experimental manipulations, are responsible for the dynamic changes in membrane fluidity.
Most membranes bend easily, as seen by changes in membrane curvature driven by thermal fluctuations (19). Microscopic changes in RBC membrane curvature with amphipathic drug application are evident as crenulation or cupping. However, none of our manipulations generated visible bending of the OHC plasma membrane. This may reflect the fact that the stiffness parameter of the OHC is much greater than that of the RBC (20). Despite the lack of evidence for microscopic changes in OHC membrane curvature, the highly organized, orthotropic nature of the OHC cytoskeleton could permit nanoscale changes in membrane curvature (Fig. 4). As the OHC shortens, the inter-actin distance would decrease and result in increased membrane crenulations. The bending associated with the interactions between the cytoskeleton and the plasma membrane modulates membrane tension.
Fig. 4. Hypothetical nanoscale membrane rippling within the lateral wall of the OHC.
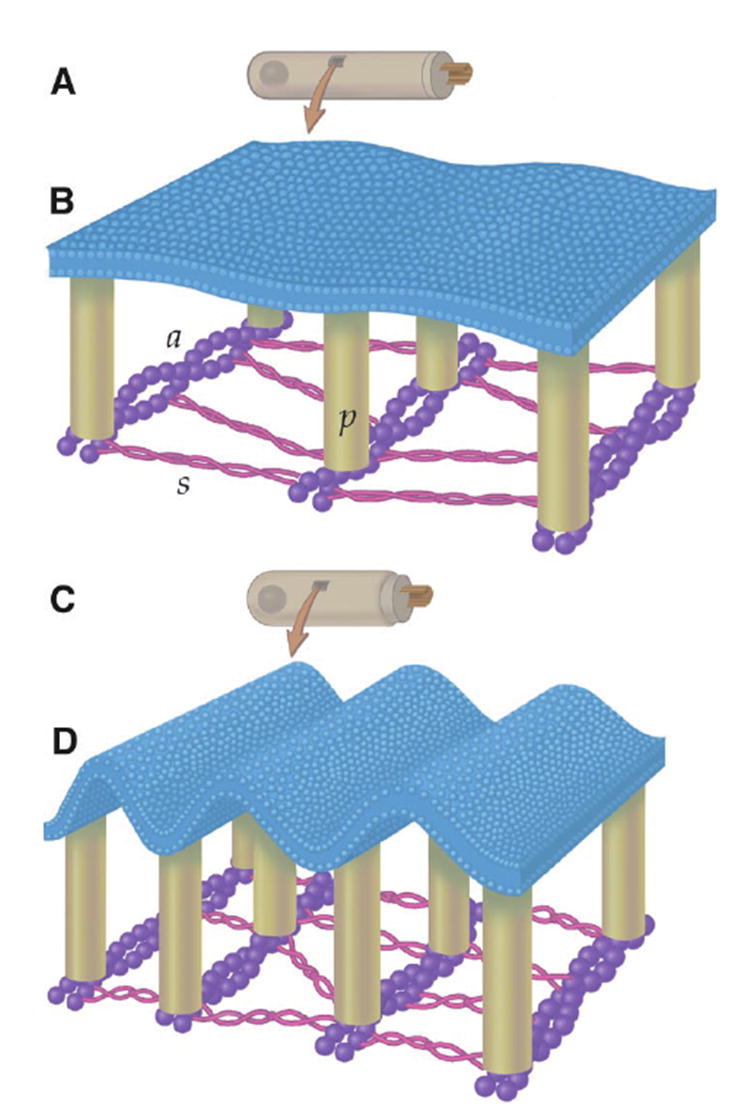
The plasma membrane is tethered to a subplasmalemmal cytoskeleton by 30-nm-long “pillars” (p) (24). The molecular composition of the pillars is unknown. The pillars bond to parallel actin filaments (a) that run circumferentially around the cell. The actin filaments are spaced about 40 nm apart and cross-linked with molecules of spectrin (s) that run longitudinally along the cell. (A and C) The OHC when hyperpolarized and depolarized, respectively. Depolarization makes the OHC shorter and wider. (B and D) Potential alterations in membrane curvature resulting from electromotile length changes. Note the increased membrane crenulations in (D).
The maximal size of the crenulations when the OHC is depolarized can be estimated by assuming the membrane to be flat when the OHC is hyperpolarized. Assuming a maximum cell shortening of 7.5%, the inter-actin distance would decrease from 40 to 37 nm; however, the intervening membrane would still be 40 nm long. Modeling this as two back-to-back right triangles, each base would be 18.5 nm and each hypotenuse would be 20 nm. The angle between the base and the hypotenuse is >20° and the crenulation height is 7.6 nm (slightly greater than the width of most biological membranes). The nanoscale membrane rippling in the shortened cell means there is ~10% greater membrane surface area than the cell’s apparent surface area under the microscope. This, however, could not account for the 50% change in the diffusion coefficient we measured. Transmission electron microscopy of the OHC consistently reveals submicroscopic crenulations in the lateral wall plasma membrane (21). Although this is most likely due to fixative-induced shrinkage of the proteins of the cytoskeleton and it demonstrates that the membrane will bend with the cytoskeleton, there is no evidence that the actin-spectrin network is the active element in electromotility.
Our data indicate that OHC membrane tension can be modulated by voltage, osmotic challenge, and curvature-inducing drugs. Changes in tension, in turn, appear to affect the molecular environment of the membrane, changing its fluidity. This is compatible with a model of passive nanoscale changes in membrane curvature, which could be based on an area-motor mechanism in which the lipid-protein interactions generate progressive changes in membrane tension. Alternative possibilities for the electrically evoked changes include an interaction of the probe with the glycocalyx of the cell or a variation in the binding properties of the probe; however, the osmotic results and our control experiments suggest such possibilities are unlikely. Four voltage-dependent phenomena have been identified with the lateral wall over the past 15 years. Voltage-dependent length changes (1), cell stiffness (22), and lateral diffusion are unique to the OHC. Nonlinear membrane capacitance (16) shows that a membrane-bound charge movement is associated with electromotility, possibly within the motor complex itself. A complete understanding of electromotility must explain all four phenomena and will undoubtedly provide an explanation for the elegant organization of the lateral wall.
References and Notes
- 1.Brownell WE, Bader CR, Bertrand D, de Ribaupierre Y. Science. 1985;227:194. doi: 10.1126/science.3966153. [DOI] [PubMed] [Google Scholar]
- 2.Dallos P. J Neurosci. 1992;12:4575. doi: 10.1523/JNEUROSCI.12-12-04575.1992. [DOI] [PMC free article] [PubMed] [Google Scholar]; Oghalai JS, et al. J Neurophysiol. 1998;79:2235. doi: 10.1152/jn.1998.79.4.2235. [DOI] [PubMed] [Google Scholar]; Zhao HB, Santos-Sacchi J. Nature. 1999;399:359. doi: 10.1038/20686. [DOI] [PubMed] [Google Scholar]
- 3.Vaz WLC, Derzko ZI, Jacobson KA. In: Membrane Reconstitution. Poste G, Nicolson GL, editors. Elsevier; Amsterdam: 1982. pp. 83–136. [Google Scholar]
- 4.Golan DE, Alecio MR, Veatch WR, Rando RR. Biochemistry. 1984;23:332. doi: 10.1021/bi00297a024. [DOI] [PubMed] [Google Scholar]
- 5.The organ of Corti was isolated from the cochleae of guinea pigs, incubated for 3 to 5 min with trypsin, and dissociated onto a microwell petri dish. For some experiments, rat hippocampal neurons were used as a control. These cells were harvested on embryonic day 19 and grown in culture for 9 to 12 days in serum-free medium. Dissection and experiments were performed at 22°C in an extracellular solution consisting of the following: 155 mM NaCl, 4 mM KCl, 1 mM MgCl2, 2 mM CaCl2, 10 mM Hepes, and 10 mM glucose. The solution was adjusted to a pH of 7.3 and an osmolality of 320 mOsm/kg. We stained the plasma membrane of the isolated cells with di-8-ANEPPS, a fluorescent molecule with a short hydrophobic tail that inserts itself into the outer leaflet of the phospholipid bilayer. Di-8-ANEPPS (75 μM) was dispersed into extracellular solution by sonication for 1 min, and the cells were stained for 5 min before unbound dye was thoroughly rinsed away with extracellular solution alone Montana V, Farkas DL, Loew LM. Biochemistry. 1989;28:4536. doi: 10.1021/bi00437a003.Oghalai JS, Tran TD, Raphael RM, Nakagawa T, Brownell WE. Hear Res. 1999;135:19. doi: 10.1016/s0378-5955(99)00077-5.
- 6.Imaging was performed using a Bio-Rad (Hercules, CA) scanning confocal system with a krypton/argon laser, configured on an Axiovert 35 microscope (Carl Zeiss, Jena, Germany) with a 100× oil immersion objective. The laser excitation wavelength was 488 nm; the fluorescent emission was collected using a long-pass filter with a corner wavelength of 515 nm. We initially positioned the laser beam of the confocal microscope tangential to the OHC lateral wall to create a photobleached spot. The laser power was 50 μW and the spot radius was roughly 5 μm. Rapid scanning confocal images were then taken over the next minute to document the recovery phase. The three-point fit method was used to determine the membrane diffusion coefficient. For the drug application experiments, only a single diffusion coefficient measurement was made per cell. For the voltage-clamp experiments, up to four measurements of the diffusion coefficient were made per OHC. Each measurement was made at a different location along the lateral wall. Due to difficulties with phototoxicity, it was impossible to collect a large number of data points from a single cell. We stopped using a cell when a change in the input impedance indicated either membrane breakdown or a loss of the tight seal between the recording pipette and the cell membrane. Most cells allowed one to three measurements Axelrod D, Koppel DE, Schlessinger J, Elson E, Webb WW. Biophys J. 1976;16:1055. doi: 10.1016/S0006-3495(76)85755-4.
- 7.Derzko Z, Jacobson K. Biochemistry. 1980;19:6050. doi: 10.1021/bi00567a016. [DOI] [PubMed] [Google Scholar]; Thompson NL, Axelrod D. Biochim Bio-phys Acta. 1980;597:155. doi: 10.1016/0005-2736(80)90159-5. [DOI] [PubMed] [Google Scholar]; Kapitza HG, Sack-mann E. Biochim Biophys Acta. 1980;595:56. doi: 10.1016/0005-2736(80)90247-3. [DOI] [PubMed] [Google Scholar]; Bloom JA, Webb WW. Biophys J. 1983;42:295. doi: 10.1016/S0006-3495(83)84397-5. [DOI] [PMC free article] [PubMed] [Google Scholar]
- 8.Whole-cell patch clamping was performed with a patch pipette intracellular solution consisting of the following: 150 mM KCl,5 mM MgCl2, 5 mM EGTA, and 10 mM Hepes, with an osmolality of 305 mOsm/ kg and a pH of 7.3. Gigohm seals were formed at the base of the OHCs. After the whole-cell mode was entered, the series resistance was between 10 and 30 megohms. On-line series resistance compensation was 75 to 95%, and residual series resistance was not compensated.
- 9.Osmotic challenge experiments were performed using a lower NaCl concentration (130 mM). Glucose was added as needed to achieve osmolalities from 265 to 365 mOsm/kg. A 245 mOsm/kg solution was created by adding additional free water.
- 10.Deuticke B. Biochim Biophys Acta. 1968;163:494. doi: 10.1016/0005-2736(68)90078-3. [DOI] [PubMed] [Google Scholar]; Sheetz MP, Painter RG, Singer SJ. J Cell Biol. 1976;70:193. doi: 10.1083/jcb.70.1.193. [DOI] [PMC free article] [PubMed] [Google Scholar]; Patel AJ, et al. EMBO J. 1998;17:4283. doi: 10.1093/emboj/17.15.4283. [DOI] [PMC free article] [PubMed] [Google Scholar]
- 11.Sheetz MP, Singer SJ. Proc Natl Acad Sci USA. 1974;71:4457. doi: 10.1073/pnas.71.11.4457. [DOI] [PMC free article] [PubMed] [Google Scholar]; J Cell Biol. 1976;70:247. doi: 10.1083/jcb.70.1.247. [DOI] [PMC free article] [PubMed] [Google Scholar]
- 12.Sodium salicylate (10 mM) and/or chlorpromazine (0.1 mM) were included in the extracellular solution for these experiments. These concentrations were chosen because they cause equal and opposite membrane bending in the RBC (10, 11). All solutions were adjusted to a pH of 7.3 and an osmolality of 320 mOsm/kg.
- 13.Shehata WE, Brownell WE, Dieler R. Acta Oto-Laryngol. 1991;111:707. doi: 10.3109/00016489109138403. [DOI] [PubMed] [Google Scholar]
- 14.Images of outer hair cell electromotility were recorded on Super-VHS videotape. Length measurements were made off-line with NIH Image software. The apical edge of the cell was determined by fitting the pixel intensity function with a parabola and using the local maximum as the border.
- 15.Iwasa KH. Biophys J. 1993;65:492. doi: 10.1016/S0006-3495(93)81053-1. [DOI] [PMC free article] [PubMed] [Google Scholar]; J Acoust Soc Am. 1994;96:2216. [Google Scholar]; Dallos P, Evans BN, Hallworth R. Nature. 1991;350:155. doi: 10.1038/350155a0. [DOI] [PubMed] [Google Scholar]
- 16.Santos-Sacchi J. J Neurosci. 1991;11:3096. doi: 10.1523/JNEUROSCI.11-10-03096.1991. [DOI] [PMC free article] [PubMed] [Google Scholar]; Huang G, Santos-Sacchi J. Proc Natl Acad Sci USA. 1994;91:12268. doi: 10.1073/pnas.91.25.12268. [DOI] [PMC free article] [PubMed] [Google Scholar]; Gale JE, Ashmore JF. Nature. 1997;389:63. doi: 10.1038/37968. [DOI] [PubMed] [Google Scholar]
- 17.Kakehata S, Santos-Sacchi J. Biophys J. 1995;68:2190. doi: 10.1016/S0006-3495(95)80401-7. [DOI] [PMC free article] [PubMed] [Google Scholar]; Iwasa KH, Chadwick RS. J Acoust Soc Am. 1992;92:3169. doi: 10.1121/1.404194. [DOI] [PubMed] [Google Scholar]
- 18.Gale JE, Ashmore JF. Proc R Soc London Ser B. 1994;255:243. doi: 10.1098/rspb.1994.0035. [DOI] [PubMed] [Google Scholar]; Adachi M, Iwasa KH. Proc Natl Acad Sci USA. 1999;96:7244. doi: 10.1073/pnas.96.13.7244. [DOI] [PMC free article] [PubMed] [Google Scholar]
- 19.Servuss RM, Harbich W, Helfrich W. Biochim Biophys Acta. 1976;436:900. doi: 10.1016/0005-2736(76)90422-3. [DOI] [PubMed] [Google Scholar]; Bloom M, Evans EA, Mouritsen O. Q Rev Biophys. 1991;24:293. doi: 10.1017/s0033583500003735. [DOI] [PubMed] [Google Scholar]
- 20.Sit PS, Spector AA, Lue A, Popel AS, Brownell WE. Biophys J. 1997;72:2812. doi: 10.1016/S0006-3495(97)78923-9. [DOI] [PMC free article] [PubMed] [Google Scholar]; Oghalai JS, Patel AA, Nakagawa T, Brownell WE. J Neurosci. 1998;18:48. doi: 10.1523/JNEUROSCI.18-01-00048.1998. [DOI] [PMC free article] [PubMed] [Google Scholar]
- 21.Smith CA. Ann Otol Rhinol Laryngol. 1968;77:629. doi: 10.1177/000348946807700404. [DOI] [PubMed] [Google Scholar]
- 22.He DZ, Dallos P. Proc Natl Acad Sci USA. 1999;96:8223. doi: 10.1073/pnas.96.14.8223. [DOI] [PMC free article] [PubMed] [Google Scholar]
- 23.The data were fit with a Boltzmann function, D = Ddepolarized + (Dhyperpolarized − Ddepolarized)/{1 + exp[(V − V1/2)/s]}, where D is the diffusion coefficient at the membrane potential V, Dhyperpolarized and Ddepolarized are the diffusion coefficients at the hyperpolarized and depolarized states, V1/2 is the potential at the midpoint of the change in D, and s describes the voltage dependency of the curve (slope factor). The data were fit by computer algorithm.
- 24.Holley MJ. In: The Cochlea. Dallos P, Popper AN, Fay RR, editors. Vol. 8. Springer; New York: 1996. pp. 386–434. [Google Scholar]
- 25.All procedures were approved by the animal care and use committee at the Baylor College of Medicine. Supported by the Jake and Nina Kamin Chair and by research grants from the Deafness Research Foundation (J.S.O.) and NIDCD (W.E.B.). J.S.O. developed the techniques for measuring lateral diffusion used in this manuscript and collected the data for Figs. 1A, 2, and 3. H.-B.Z. and J.W.K. collected the data for Fig. 1, B, C, and D. We thank B. R. Alford, A. Bullen, R. A. Eatock, H. A. Jenkins, T. Nakagawa, A. Nygren, A. S. Popel, R. M. Raphael, F. Sachs, P. Saggau, A. A. Spector, and T. D. Tran.