

Summary
The FEZ1/LZTS1 (LZTS1) protein is frequently downregulated in human cancers of different histotypes. LZTS1 is expressed in normal tissues, and its introduction in cancer cells inhibits cell growth and suppresses tumorigenicity, owing to an accumulation of cells in G2/M. Here we define its role in cell cycle regulation and tumor progression by generating Lzts1 knock-out mice. In Lzts1−/− mouse embryo fibroblasts (MEFs), Cdc25C degradation was increased during M phase resulting in decreased Cdk1 activity. As a consequence, −/− MEFs showed accelerated mitotic progression, resistance to taxol- and nocodazole-induced M phase arrest, and improper chromosome segregation. Accordingly, Lzts1 deficiency was associated with an increased incidence of both spontaneous and carcinogen-induced cancers in mice.
Keywords: Fez1/Lzts1, Knockout mice, Cdc2, CdC25C, NMBA
Significance
Both entry and exit from Mitosis are driven by the modulation of Cdk1 activity that is finely regulated by several proteins complexes. Knowing the players that control in each phase of the cell cycle the activity of Cdk1 is of primary importance to fully understand how normal and cancer cells divide. The present data establish Lzts1 as an important player in ensuring a proper Cdk1 activity during M phase. Lzts1 absence in a defined temporal window during M phase results in impaired Cdk1/Cdc25C interaction with a consequent drop in Cdk1 activity. Lzts1 protein is therefore necessary to maintain high levels of Cdk1 during prophase and metaphase, which in turn is required for the proper chromosomes alignment and segregation.
Introduction
During the course of cancer development, a normal cell progresses towards malignancy by acquiring a specific series of mutations. Over the past decades, genetic studies have demonstrated that cancer cells accumulate DNA changes that activate oncogenes and inactivate tumor suppressor genes.
The role of tumor suppressor genes in neoplasia development is crucial, given that reintroduction of one or more of these genes into cells in which their function is compromised can completely revert the neoplastic process (Ichikawa et al., 1994). In this perspective, it is not surprising that many tumors frequently show loss of heterozygosity (LOH) at specific chromosomal regions encompassing tumor suppressor genes.
One of these regions is located at chromosome 8p22, which is frequently deleted in breast, lung, gastric, esophageal, prostate and bladder cancers (Vocke et al., 1996; Wagner et al., 1997; Anbazhagan et al., 1998; El-Naggar et al., 1998). On the basis of this correlation and through a positional cloning strategy, we identified a novel putative tumor suppressor gene (Ishii et al., 1999), FEZ1/LZTS1 (LZTS1), mapping in this region and whose expression is altered in different human malignancies (Ishii et al., 1999; Cabeza-Arvelaiz et al., 2001; Vecchione et al. 2001; Vecchione et al., 2002; Toyooka et al., 2002; Ono et al., 2003; Nonaka et al., 2005). The reintroduction of LZTS1 into Lzts1 null cancer cells suppresses cell growth, with the accumulation of cells at the G2/M phase of the cell cycle (Ishii et al., 2001; Vecchione et al., 2002), probably mediated by its interaction with the main mitotic kinase p34cdc2 (hereafter Cdk1) (Ishii et al., 2001; Vecchione et al., 2002).
Cdk1 activity is finely controlled during the G2/M phases of the cell cycle and its activity is thought to control both M phase entry and exit (reviewed in Nigg, 2001). There are multiple levels of Cdk1 activity regulation such as binding with its regulatory subunits (Cyclins A and B), interaction with CKIs, phosphorylation and dephosphorylation of specific residues (reviewed in Smits and Medema, 2001). Of the several proteins participating to the multifaceted Cdk1 regulation, some have been implicated in tumor progression (Carnero, 2002), directly linking proper M phase progression with cell transformation. However, the involvement of mitotic regulators in cancer is more difficult to prove since profound alterations of the M phase are often not compatible with eukaryotic life (Weaver and Cleveland, 2005), a concept in line with the notion that, up to now, any effort to generate Cdk1 knock-out mice has been unsuccessful. Conversely, mild alteration of M phase checkpoints often leads to aneuploidy and cells transformation (Weaver and Cleveland, 2005).
In the present study we describe the role of the tumor suppressor gene Lzts1 in M phase regulation and tumor progression utilizing as a model the Lzts1-null mice.
Results
Targeted Disruption of the Lzts1 gene creates a null-allele and favor spontaneous tumor development
The mouse Lzts1 gene was disrupted by inserting a neomycin-resistance cassette that replaced the Lzts1 first exon (Figure 1A). Chimaeric males transmitted the mutated Lzts1 allele through the germ line, as demonstrated by Southern blot analysis of tail DNA (Figure 1B) and by Reverse Transcriptase Polymerase Chain Reaction (RT-PCR) of Lzts1+/+, Lzts1+/− and Lzts1−/− mouse embryo fibroblasts (MEFs) (Figure 1C). Lzts1−/− mice arose at the expected frequency (data not shown). Western blot analysis of brain lysates from Lzts1+/+ and Lzts1+/− and Lzts1−/− mice, confirmed the reduction or the absence of Lzts1 protein (Figure 1D).
Figure 1. Lzts1 knock-out mice develop spontaneous tumors.
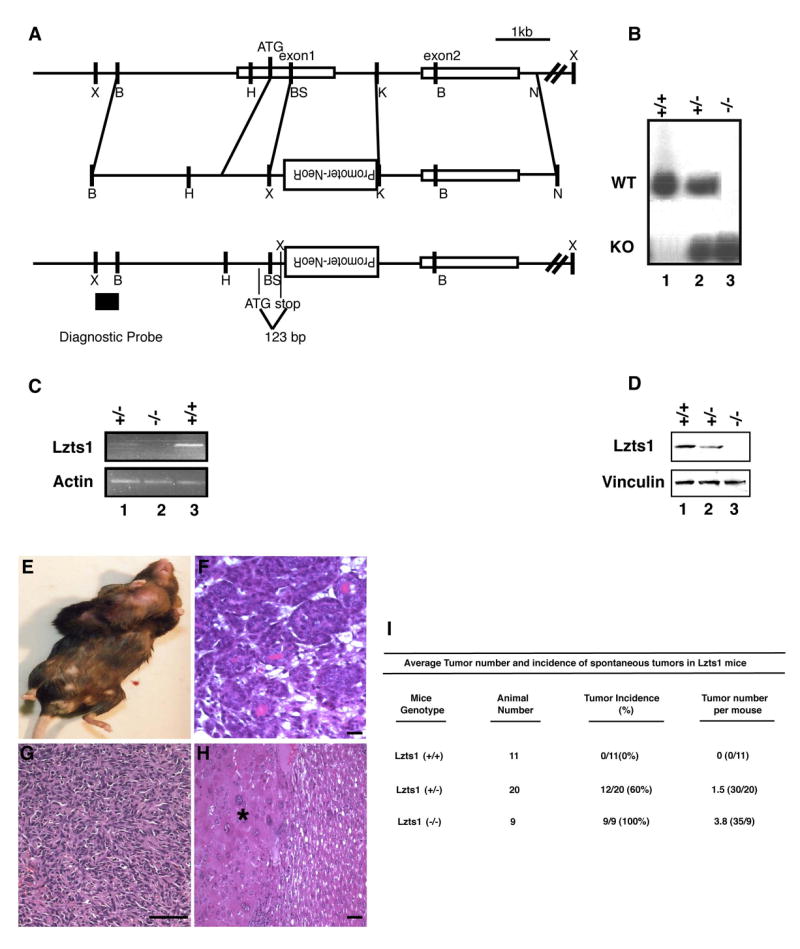
A. Targeting of the mouse Lzts1 locus, showing that the genomic region including exons 1 and 2 of mouse Lzts1 gene (top) were homologously recombinant with targeting vector (middle), which results in the replacement of part of exon 1 with neomycin resistance gene (bottom). Lzts1 coding was stopped at 123 bp down stream of the first Methionine. B, BamHI; K, KpnI; BS, Bsp106; N, NotI; H, HindIII; X, XbaI site. The 600 bp diagnostic probe is located outside of targeting vector sequence. B. Southern blot analysis of mouse genomic DNA, digested with XbaI and probed with the diagnostic probe depicted in panel A. C. RT-PCR analysis showing Lzts1 gene expression in Lzts1+/+, Lzts1+/− and Lzts1−/− MEFs as indicated. Actin mRNA expression was used as loading control. D. Western Blot analysis of Lzts1 expression in brain lysates from Lzts1+/+, Lzts1+/− and Lzts1−/− 15 weeks-old mice. Vinculin expression was used to normalize the amount of loaded proteins in each lane. E. Macroscopic appearance of primary breast tumor in Lzts1 −/− mouse. F. H&E showing ductal differentiation of the breast tumor depicted in E. G. High grade sarcoma of the tight. H. Liver carcinoma is shown (*). Scale bars: 20μm (F and H), 100μm (G). I. Number and incidence of spontaneous tumors in the different genotypes.
Lzts1 heterozygous intercrosses were bred and observed for up to 24 months of age. In animals at the age of 8–24 months (average 16 months), pathological analysis demonstrated that 0 out of 11 +/+ mice, 12 out of 20 +/− mice, and 9 out of 9 −/− mice developed multiple tumors. The neoplasms in −/− and +/− mice were breast tumors, hepatocellular carcinomas, lymphomas, soft tissue sarcomas, and lung adenomas (Figure 1E–I), a spectrum suggesting that Lzts1 absence affects multiple cell types in vivo. Lymphomas, hepatocellular carcinomas and soft tissue sarcomas developed at higher penetrance in −/− than in +/− mice (100, 75, 100% vs. 35, 50, 0%, respectively). Penetrance in the other hystotype was not significantly different. Onset of tumor was very similar between heterozygous and homozygous mice (Age 19±4.2 +/− vs. 17±4.2 −/−) suggesting that one Lzts1 allele is not sufficient and does not delay cancer development. To better address this point we explored whether the second allele was lost in heterozygous mice. PCR experiments coupled with direct sequencing showed that the wild-type allele was neither lost nor mutated (data not shown).
Lzts1−/− MEFs progress normally along the G1, S and G2 phases but display an altered M phase
Our previous studies indicated that LZTS1 was implicated in the control of cell cycle progression since its overexpression was able to block the cells mainly in the G2/M phase probably acting on Cdk1 activity (Ishii et al., 2001; Vecchione et al., 2002). To verify whether the mechanisms whereby Lzts1 absence predisposed mice to develop multiple tumors, could be linked to its role in the control of cell cycle progression we used MEFs derived from wild type (wt) or knock out (ko) embryos.
In growth curve experiments Lzts1−/− MEFs cultured in complete medium grew more slowly over 6 days period when compared to +/+ cells (Figure 2A), probably for an increased apoptosis as demonstrated by flow cytometry analysis (FACS) (Figure 2B) and TUNEL assay (data not shown). In order to assess if the reduced cell growth observed in Lzts1−/− MEFs was also due to an altered progression through the different phases of the cell cycle, we used cell synchronization to study the transition from G1 to S and from S to G2/M. Serum starvation followed by serum stimulation for up to 24 hours indicated that Lzts1+/+ and −/− MEFs progressed similarly from G1 to S and from S to G2 phases of the cell cycle (Figure 2C) and demonstrated similar temporal expression and phosphorylation patterns of cell cycle regulatory proteins (Figure 2D). The expression of the licensing factor Geminin known to be expressed from S to M phase and degraded at the metaphase-anaphase transition (McGarry et al., 1998), peaked in both cell lines 23 hours after serum stimulation, although in cells lacking Lzts1 decreased rapidly (Figure 2E).
Figure 2. G1/S and S/G2 transitions are not affected by Lzts1 absence in MEFs.
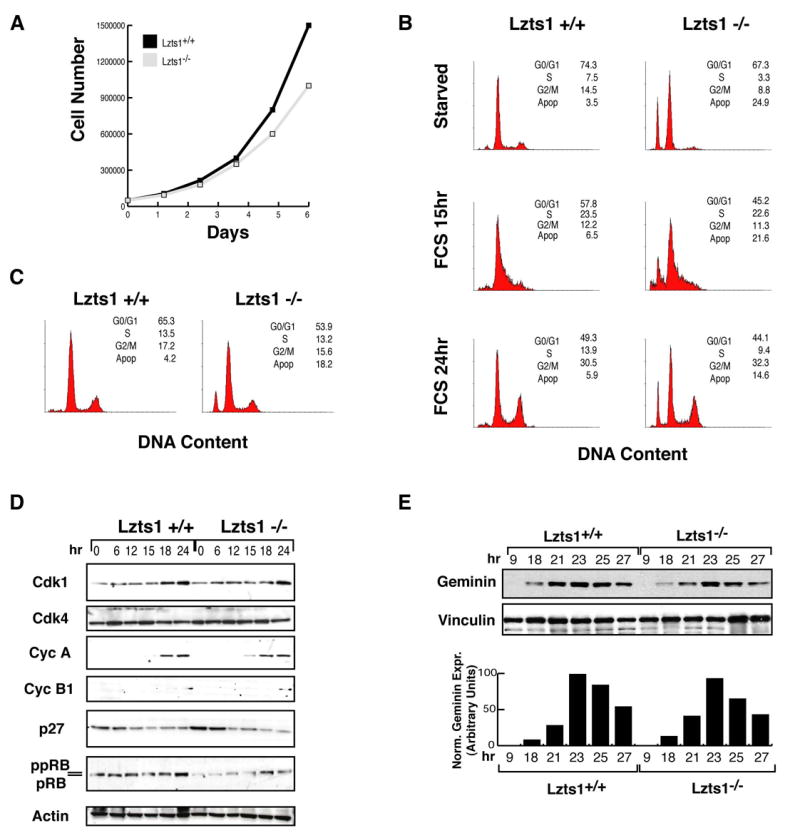
A. Growth curve comparing of Lzts1+/+ (black square) and Lzts1−/− (gray square) cells over 6 days. B. FACS analysis of DNA content of Lzts1+/+ and Lzts1−/− MEFs in logarithmic phase of growth. C. Cell cycle distribution of Lzts1+/+ and Lzts1−/− MEFs serum-starved for 24 hours (starved) and then re-stimulated with 10% FBS containing-medium (FCS) for the indicated time. D. Western blot analysis of cell cycle related proteins in Lzts1+/+ and Lzts1−/− cells treated as in C. E. Western blot analysis of Geminin expression in Lzts1+/+ and Lzts1−/− MEFs serum-starved for 24 hours (starved) and then re-stimulated with 10% FBS containing-medium for the indicated time. In the lower graph the expression of Geminin normalized on the levels of vinculin at each time point is reported.
Using the double thymidine block coupled with FACS and Western Blot analyses a decreased accumulation in G2/M phase in Lzts1−/− respect to +/+ cells was noted (Figure 3A). The observed differences in the cell cycle distribution were accompanied by slightly different expression levels of Cyclin B1 (Figure 3B) that, in Lzts1+/+ cells, peaked from 4 to 8 hours and decreased promptly 10 hours after the release, whereas in −/− cells it rose at 4 hours and remained stable until 10 hours after release (Figure 3B). These data suggested two possibilities: 1) Lzts1−/− cells had a slower S-G2 progression; 2) they had a faster exit from mitosis.
Figure 3. Lzts1−/− MEF displayed mitotic defects.

A. Flow cytometry analysis of Lzts1+/+ and −/− MEFs synchronized at the G1/S transition by double thymidine block and released for the indicated time. B. Expression of Cyclin B1 and Cdk1 proteins in cells treated as described in A. C. Evaluation of cell cycle progression in cells labeled with BrdU for 1 hour and then exposed to nocodazole for the indicated time. The percentage of total or BrdU labeled cells in each phase of the cell cycle is shown. D. Flow cytometry analysis of Lzts1+/+ and −/− MEFs treated for 10 hours with Hoechst 33342 (Left panels, T0) and then released for the indicated time.
To address this point, exponentially growing Lzts1+/+ and −/− cells were cultured for 1 hour in presence of 5′-bromodeoxyUridine (BrdU), to label cells in S phase. After BrdU washout, nocodazole, a drug known to block cells in prometaphase, was added and cells collected 3, 12 and 18 hours later. FACS analysis of BrdU positive cells showed that Lzts1−/− MEFs progressed normally from S to G2/M phase of the cell cycle but accumulated less efficiently in prometaphase (Figure 3C). In fact, after 12–18 hours of nocodazole treatment 10% of Lzts1+/+ versus more than 25% of the Lzts1−/− MEFs were in G1/S phases suggesting that −/− cells had a faster exit from mitosis after nocodazole treatment (Figure 3C).
Similar results were obtained using double thymidine block followed by exposure to Hoechst 33342 that causes a reversible G2 arrest (Tobey et al., 1990). Hoechst treatment increased to ∼40% the G2 population of both Lzts1 wt and ko MEFs (Figure 3D). After Hoechst washout the progression through M phase was completely different since within 2 hours the tetraploid population remained stable in wt cells (41%) while dropped to almost the half (26,8%) in ko fibroblasts (Figure 3D). Similarly, the G1 population of wt MEFs was similar in cells Hoechst blocked or released for 2 hours (36 versus 40%, respectively), whereas almost doubled in ko cells in the same time frame (39 versus 59% at 0 and 2 hours, respectively) (Figure 3D). In longer periods of time both cell lines returned in G1, consistently with the reversible G2 block induced by Hoechst (Figure 3D). Altogether these results indicated that Lzts1 ko MEFs had a faster progression through the M phase respect to the wt counterpart.
Lzts1−/− MEFs show a faster M phase progression
To better study the role of Lzts1 in M phase progression, Lzts1 wt and ko mitotic cells were isolated and analyzed for the expression of the MPM2 phosphoprotein (Westendorf et al., 1994; Shuji et al., 2001) and cell cycle distribution. Similar percentages of mitotic cells were isolated in the two cell lines (Figure 4A). The analysis of DNA content (Figure 4B) and of MPM2 expression (Figure 4C) indicated that wt MEFs arrested in prometaphase by nocodazole completed the M phase within 90 min whereas ko cells accumulated in G1 within 60 min, consistent with faster mitotic exit. Immunofluorescence analysis performed 90 minutes after the release from nocodazole block demonstrated that the majority of wt MEFs still had the mid-body, suggesting that they were between telophase and cytokinesis, whereas, at the same time point, almost all ko MEFs had already divided (Figure S1A).
Figure 4. Lzts1−/− MEFs displayed a faster M phase progression.
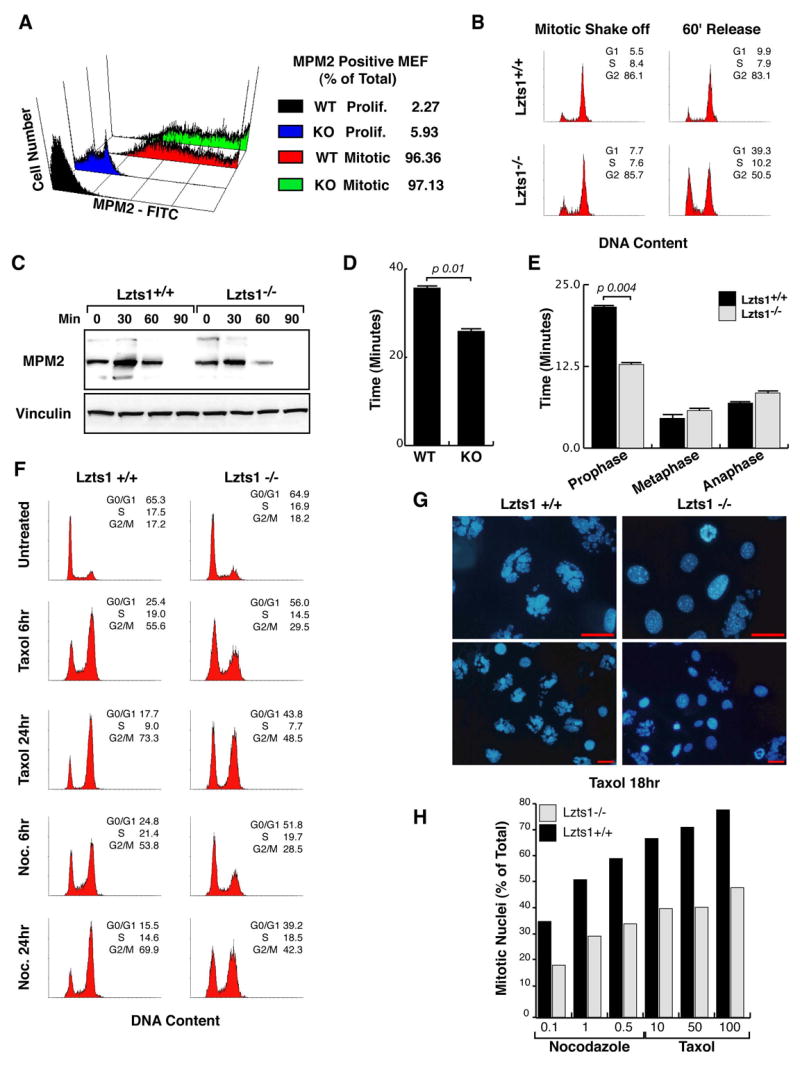
A. Expression of the mitotic phosphoprotein MPM2 in proliferant and mitotic shake-off Lzts1+/+ and −/− MEFs. B. Flow cytometry analysis of Lzts1+/+ and −/− MEFs isolated by mitotic shake off (Left Panels) and released for 60 minutes (Right Panels). C. Expression of the mitotic phosphoprotein MPM2 in cells collected by mitotic shake-off (0) and released for the indicated times. D/E. Quantification of total mitosis length (D) and of time spent in each mitotic phase (E) in Lzts1+/+ and −/− MEFs, evaluated by video time-lapse microscopy. Results (mean ± SD) are representative of eight mitotic cells (n=8) followed independently. F. Flow cytometry analysis of Lzts1+/+ and −/− MEFs treated with 100nM Taxol or 1μM nocodazole, as indicated. G. Hoechst nuclear staining of Lzts1+/+ (left panels) and Lzts1−/− (right panels) MEFs treated for 18 hours with 100nM Taxol. Representative fields are shown. Scale bars 20μm. H. Quantification of mitotic nuclei using the Hoechst nuclear staining in cells treated as indicated. Data represent the mean of 3 independent experiments on two different MEFs populations.
Most of the reported experiments were conducted utilizing nocodazole to synchronize cells in prometaphase. Since nocodazole treatment by itself has an effect on M phase length (Cimini et al., 2003), we decided to observe the M phase progression in undisturbed cells using video time-lapse microscopy. Cells were both double thymidine blocked or left untreated and followed for up to 12 hours by video microscopy as described in the methods section. The analysis of 8 wt and 8 ko MEFs confirmed that also in the absence of drug treatment −/− MEFs had a faster prophase-telophase transition (Figure 4D and E) and demonstrated that the major difference between +/+ and −/− cells was indeed the time needed to complete prophase (Figure 4E).
We next tested the effects on Lzts1 wt and ko MEFs of two different compounds able to block cells in prometaphase. Both nocodazole- or taxol-treated −/− cells failed to properly arrest in prometaphase (Figure 4F), and taxol or nocodazole-treated −/− MEFs displayed a lower percentage of abnormal mitotic figures (Blajeski et al., 2002) respect to +/+ cells (Figure 4G and H), consistent with an altered drug-induced M block.
Lzts1 contributes to the regulation of Cdk1 activity during Mitosis
Once defined that Lzts1 absence principally affects the transition from prophase to anaphase we tested whether it influenced Cdk1 activity during M phase. To this purpose Cdk1 was immunoprecipitated from Lzts1+/+ and −/− MEFs isolated by mitotic shake-off or treated with nocodazole and taxol and its kinase activity tested in an in vitro assay. Interestingly, levels of phosphorylated histone-H1 by Cdk1 were lower in mitotic Lzts1−/− MEFs (Figure 5A) and in nocodazole- or taxol-treated −/− cells (Figure 5B). Similarly, in MEFs released from serum starvation cyclin B1 activity (Figure S2A) and in nocodazole synchronized cells Cdk1 activity (Figure S2B) dropped sooner in Lzts1−/− cells respect to the wt counterpart. Altogether, these data indicated that, during mitosis, Lzts1 absence resulted in a lower Cdk1 activity coupled with a faster prophase progression.
Figure 5. Lzts1 absence results in decreased Cdk1 activity and chromosome missegregation.
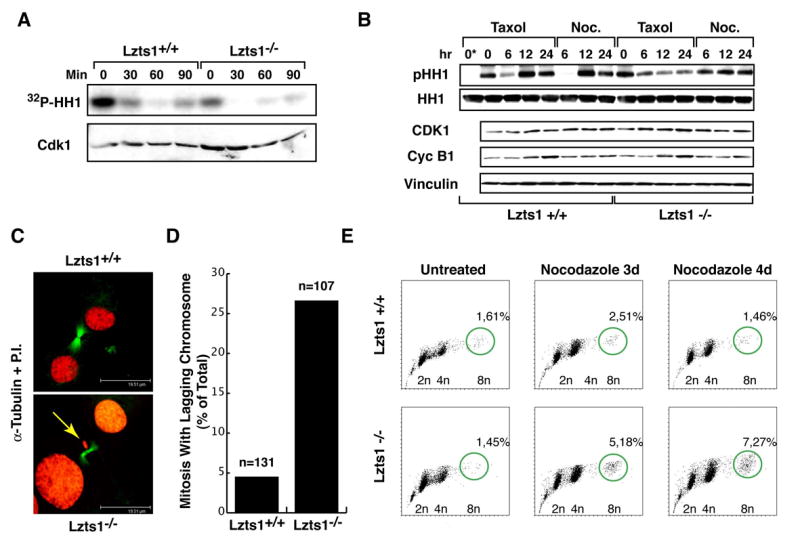
A. Cdk1 associated kinase activity in MEFs collected by mitotic shake-off (0) and released for the indicated times. In the lower panels the levels of Cdk1 are shown. B. Expression of Cyclin B1 and Cdk1 proteins and Cdk1 associated kinase activity in cells treated as indicated. Histone H1 (HH1) and Vinculin were used to normalize the kinase assay and the proteins loaded on the blot respectively. 0* lane is the negative control of kinase reaction in which the IP proteins have not been added. C. Immunofluorescence analysis of Lzts1+/+ and −/− mitotic cells stained for α-tubulin (green) and P.I. (red). A representative confocal section of a normal telophase in +/+ (upper panel) and of a telophase with missegregated (lagging) chromosomes (yellow arrows in lower panel) in −/− cells are shown. Scale bar is 19.5 μm. D. Quantification of mitosis presenting missegregated chromosomes in Lzts1+/+ and −/− MEFs examined 8 hours after double thymidine block. n is the total number of mitosis analyzed. E. Flow cytometry analysis of Lzts1+/+ and −/− MEFs treated with 1μM nocodazole, as indicated. The percentage of the 8n population, representing the mean of two independent experiments on two different MEF populations, is reported.
The time to complete mitosis represents an important variable in the execution of proper DNA separation (Cimini et al., 2003), and it has been demonstrated that decreasing Cdk1 activity in mitosis arrested cells results in prompt mitotic exit accompanied by defects in DNA segregation (Seong et al., 2003; Niiya et al., 2005; Potapova et al., 2006).
We looked at the functional consequences of the faster mitotic exit accompanied by the lower Cdk1 activity observed in −/− cells. Immunofluorescence analysis showed a 5-fold increase (4,5% in Lzts1+/+ versus 26.1% in Lzts1−/− MEFs) in the number of mitosis containing lagging chromosomes during undisturbed mitosis in the absence of Lzts1 (Figures 5C and D and Figure S1). This observation was further confirmed by the 4.5 fold increase in the percentage of cells with micronuclei in −/− MEFs released after thymidine block (Figures S1C and S1D). Moreover, after 3 or 4 days of nocodazole treatment, −/− cells evidenced an increased hypertetraploid population (Figure 5E).
Overall, these data demonstrated that Lzts1 absence shortened M phase length and determined a decrease of Cdk1 activity during mitosis accompanied by increased chromosomes missegregation.
Lzts1 is necessary for the proper Cdc25C/Cdk1 interaction during Mitosis
How Lzts1 absence decreases Cdk1 activity was investigated, as well as whether reduced kinase activity was responsible for the mitotic defects. Cdk1 activity is regulated by cyclin binding and phosphorylations on specific residues. Among the latter a key role has been proposed for T14/Y15 phosphorylation by Wee1/Myt kinases and dephosphorylation by Cdc25 phosphatases (Smits and Medema, 2001). Neither Cdk1 nor cyclin B1 levels were significantly different (Figures 2D, 3B and 5B) between wt and ko cells. Conversely, a higher Cdk1-pY15/Cdk1 ratio in mitotic (Figure 6A) accompanied by lower levels of endogenous Cdc25C phosphatase were observed in mitotic −/− MEFs (Figure 6A). Importantly, the different Cdc25C expression resulted in lower levels of endogenous Cdc25C associated with endogenous Cdk1 in mitotic −/− MEFs (Figure 6B), evidence that could explain the higher Cdk1-pY15 phosphorylation and the lower Cdk1 activity.
Figure 6. Loss of Lzts1 impairs Cdc25C-Cdk1 interaction in mitotic cells.
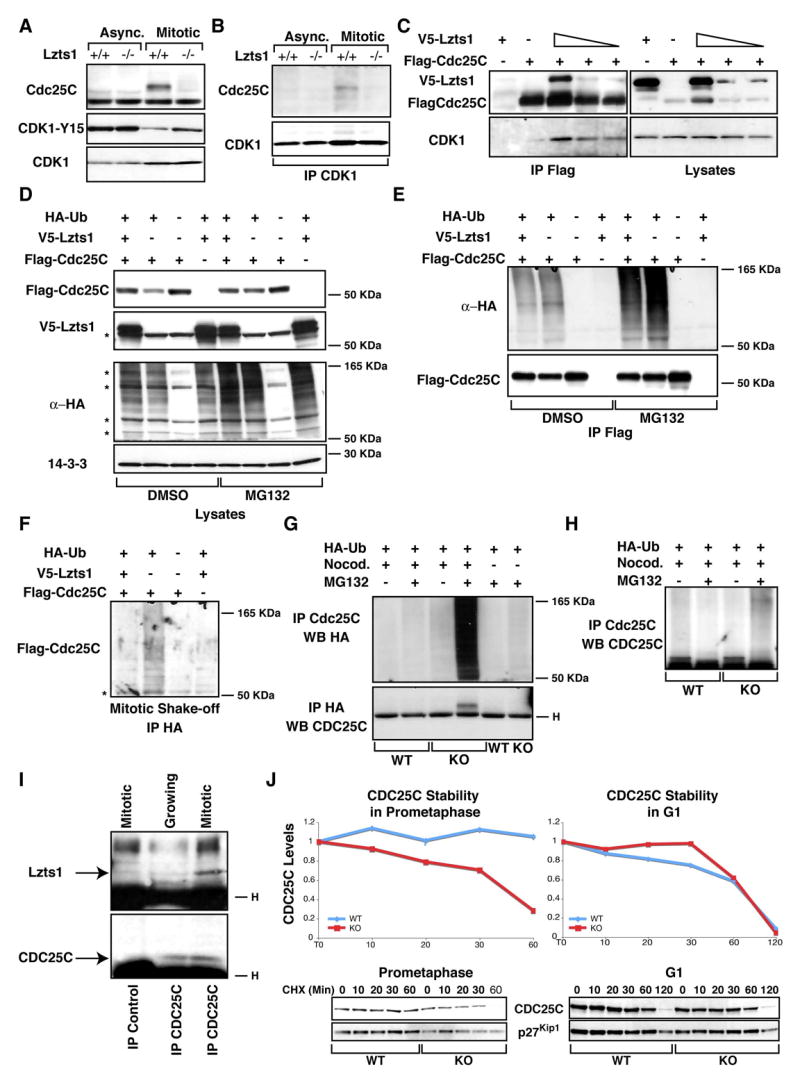
A. Western blot analysis of Cdc25C, Cdk1 and phosphoY15-Cdk1 proteins in asynchronously growing (Async.) or in mitotic (Mitotic) Lzts1+/+ and −/− MEFs. B. Western blot analysis of Cdc25C and Cdk1 in lysates from Lzts1+/+ and −/− MEFs as in A, immunoprecipitated with anti-Cdk1-Ab. C. Western blot analysis of hLzts1, hCdc25C and hCdk1 in lysates (right panels) and Flag-IP (Left panels) in 293 cells transfected with Flag-hCdc25C and increased amounts of V5-hLzts1. D. Expression of hLzts1 and hCdc25C proteins in 293 transfected with the indicated vectors and treated with nocodazole for 6 hours in the presence or not of the proteasome inhibitor MG132 (25 μM). Expression of Ha-Ubiquitin and 14-3-3 proteins was used as loading control. E. Cell lysates described in D were IP with an anti Flag-ab and analyzed for Ha-Ubiquitin and Cdc25C expression. F. 293 cells treated as in D were isolated by mitotic shake off and cell lysates were IP with an anti Flag-HA ab and analyzed for Cdc25C expression. G. Proteins from Lzts1+/+ and −/− fibroblasts transduced with HA-Ubiquitin and hCdc25C retroviruses and then isolated by mitotic shake-off were IP with either anti-Cdc25C or anti-HA Ab and probed for HA-Ubiquitin or Cdc25C expression as indicated. H. Proteins from Lzts1+/+ and −/− fibroblasts treated as in G were IP and probed with an ab specific for the Cdc25C phosphatase. * Indicates non specific bands. I. Proteins from 293T cells isolated from exponentially growing or mitotic cells were IP with an ab specific for the Cdc25C phosphatase (or control ab) and probed for Lzts1 (Upper panel) and Cdc25C (Lower panel). J. Cdc25C stability in mitotic (Left panels) or G1 cells (Right panels). The protein stability of Cdc25C was analyzed in prometaphase cells (nocodazole-arrested) and in asynchronous cells by treatment with cycloheximide for the indicated time points (min). Quantification of proteins expression was obtained scanning the blots with the Biorad GS100 scanner interfaced with the Quantity One software
A functional link between Lzts1 and Cdc25C expression was sought by transfecting 293 cells nocodazole-synchronized in prometaphase with Flag-hCdc25C alone or with increasing amounts of V5-hLzts1. hCdc25C and hLzts1 co-precipitated (Figure 6C), and the increased expression of hLzts1 resulted in increased interaction between hCdc25C and endogenous Cdk1 (Figure 6C, lower panel). It has been proposed that in G2/M-arrested cells, hCdc25C may be efficiently ubiquitinated (Chen et al., 2002). To verify whether Lzts1 expression might control Cdc25C ubiquitination, cells were transfected with Flag-hCdc25C with or without V5-hLzts1 and then nocodazole-synchronized in the presence or absence of the proteasome inhibitor MG132. MG132 did not increase hCdc25C levels when hLzts1 was overexpressed, but did in its absence (data not shown and Figure 6D). The same experiment was repeated with inclusion of a plasmid encoding a HA-tagged ubiquitin (HA-Ub) (Figure 6D and E). Data show that overexpression of Lzts1 reduced Cdc25C ubiquitination in 293 cells treated with nocodazole (Figure 6E). Moreover, 293 cells, transfected as described above, were isolated by mitotic shake-off and cell lysates immunoprecipitated with an anti-HA antibody to collect the ubiquitinated proteins. In mitotic cells Lzts1 expression strongly decreased the ubiquitinated levels of Cdc25C (Figure 6F). In order to verify these observations in a more physiological system, hCdc25C and HA-Ub were retrovirally transduced into +/+ and −/− fibroblasts treated or not treated with nocodazole in the presence or absence of MG132. Increased Cdc25C ubiquitination was observed in Lzts1−/− respect to parental cells (Figure 6G and H).
To confirm the physiological significance of the described interaction, we precipitated the endogenous Cdc25C protein from mitotic or exponentially growing 293 known to express high levels of Lzts1 (Ishii et al. 2001). In these condition endogenous Lzts1 readily associated with Cdc25C protein preferentially in Mitotic cells (Figure 6I). Moreover, the analysis of the stability of endogenous the Cdc25C protein, evaluated by cycloheximide treatment, showed a decrease in Lzts1−/− only when cells were arrested in prometaphase but not when cycloheximide was added after the cells had returned to G1 phase (Figure 6J). In addition, we examined proteins from the mitotic fraction of a panel of human carcinoma cell lines that showed low Lzts1 expression to be associated with low levels of Cdc25C protein (Figure S3A) and with an increased phosphorylation of Cdk1 on Y15 when compared with normal mammary epithelial cells or 293 cells (Figures S3B and S3C). Importantly, reintroduction of Lzts1 in several Lzts1 deficient cells using different technical approaches resulted in increased levels of Cdc25C only when the cells were isolated by mitotic shake off (Figure S4).
Accordingly, hLzts1 re-expression in Lzts1−/− cells increased Cdc25C protein (Figure 7A) and decreased phosphorylated Cdk1-pY15 in mitotic cells (Figure 7A). Importantly, Lzts1 re-expression in −/− MEFs rescued the sensitivity to taxol and nocodazole (Figures 7D and E), indicating that the observed differences between Lzts1 wt and ko cells could be ascribed to the absence of Lzts1 protein.
Figure 7. Regulation of Cdc25C activity by Lzts1 is necessary for the proper mitotic progression.
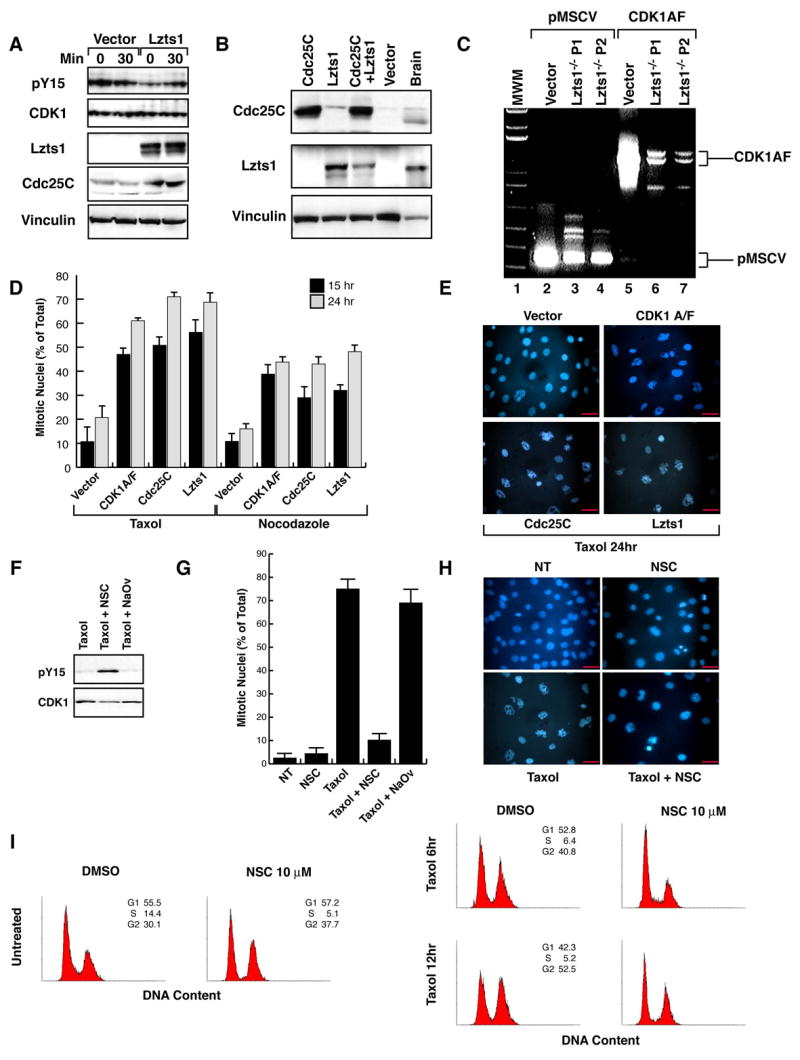
A. Western blot analysis of phosphoY15-Cdk1, Cdk1, Cdc25C, Lzts1 and Vinculin (loading control) proteins in mitotic Lzts1−/− MEFs transduced with an empty vector or with a vector encoding for the Lzts1 protein. Lysates were collected at 0 or 30 minutes after the mitotic shake-off. B. Western blot analysis of Cdc25C, Lzts1 and Vinculin (loading control) proteins in Lzts1−/− MEFs transduced with the indicated vectors. Mouse Brain lysate was used as a positive control for Lzts1 expression. C. RT-PCR analysis of Cdk1AF expression in Lzts1−/− MEFs transduced as indicated. The transduced DNA plasmids (vector) were used as positive control. D/E. Evaluation of mitotic nuclei in Lzts1−/− MEFs transduced as indicated. Typical fields of Hoechst nuclear staining are shown in E and the mean of three independent experiments is reported in D. F. Western blot analysis of Cdk1 and phosphoY15-Cdk1 expression in Lzts1+/+ MEFs treated for one hour with DMSO (NT), NSC or Na3VO4 and then with taxol for 18 hours. G/H. Evaluation of mitotic nuclei in Lzts1+/+ MEFs treated as in F. Data (mean± SD) represent the mean of a least three independent experiments performed in duplicate. I. Flow cytometry analysis of Lzts1+/+ and −/− MEFs treated with vehicle (DMSO) or NSC 10 μM for one hour and then, after the NSC wash out, exposed to 100nM Taxol for the indicated time. Scale bars 20μm.
To further test the role of Cdc25C in the mitotic phenotype observed in Lzts1 null fibroblast, we retroviral transduced −/− cells with Cdc25C (Figure 7B) or with a non-phosphorylable form of Cdk1 protein (Cdk1AF) (Figure 7C). In the absence of Lzts1 both Cdc25C and Cdk1AF expression resulted in a reacquisition of sensitivity to taxol- and nocodazole-induced M phase block (Figures 7D and E). Overall, these data suggest that the Lzts1/Cdk1/Cdc25C pathway represents a key control for the proper execution of M phase.
To verify whether Cdc25C deregulation in wt cells could recapitulate the phenotype observed in Lzts1 null cells we used the Cdc25C inhibitor NSC 663284 (NSC) (Chao et al., 2004; Han et al., 2004). Like Lzts1 null MEFs, +/+ MEFs treated with NSC for 1 hour and then washed and exposed to taxol showed increased Cdk1-pY15 phosphorylation levels (Figure 7F) and overcame the taxol-dependent M phase block (Figure 7G–I). The nonspecific phosphatase inhibitor sodium orthovanadate (NaVO4) had no effect on either Cdk1-pY15 phosphorylation or taxol-induced mitotic block (Figure 7F–G).
Lzts1-deficient MEFs are prone to transformation
How can the observed mitotic defects be linked to the increased tumor incidence noted in Lzts1 ko mice? We speculated that since −/− MEFs showed altered chromosome segregation (Figures 5C and S1), they could be more prone to transformation due to the accumulation of genetic abnormalities. To test this hypothesis, wt and ko Lzts1 MEFs were retrovirally infected with a Ha-Ras (V12) vector (Figure S5A), selected in hygromycin, and assayed for the ability to form colonies in soft agar. Only −/− MEFs formed colonies (Figure S5B), an effect independent of the silencing of the p19Arf tumor suppressor gene (Figure S5), confirming that Lzts1 absence conferred a tumor prone phenotype to mouse cells.
High incidence of NMBA-induced forestomach tumors in Lzts1-deficient mice
We also tested whether this observation could be recapitulated in in vivo experiments. Being LZTS1 gene often down regulated in esophageal carcinomas (Ishii et al., 1999), and since epidemiological studies have linked exposure to N-nitrosomethylbenzylamine (NMBA) with an increased incidence of esophageal cancer (Yang, 1980; Magee, 1989), NMBA treatment was used to determine whether Lzts1 modulates carcinogen-induced malignancy development. Six weeks after NMBA administration all 20 Lzts1 −/− mice (100%) and all 33 Lzts1+/− mice (100%) developed multiple tumors of the forestomach (Figure 8), whereas only 5 of 30 Lzts1+/+ mice (17%) developed tumors (+/+ vs. −/−, P<0.001; +/+ vs. +/−, P<0.001).
Figure 8. Loss of Lzts1 enhances NMBA-induced forestomach carcinogenesis in mice.
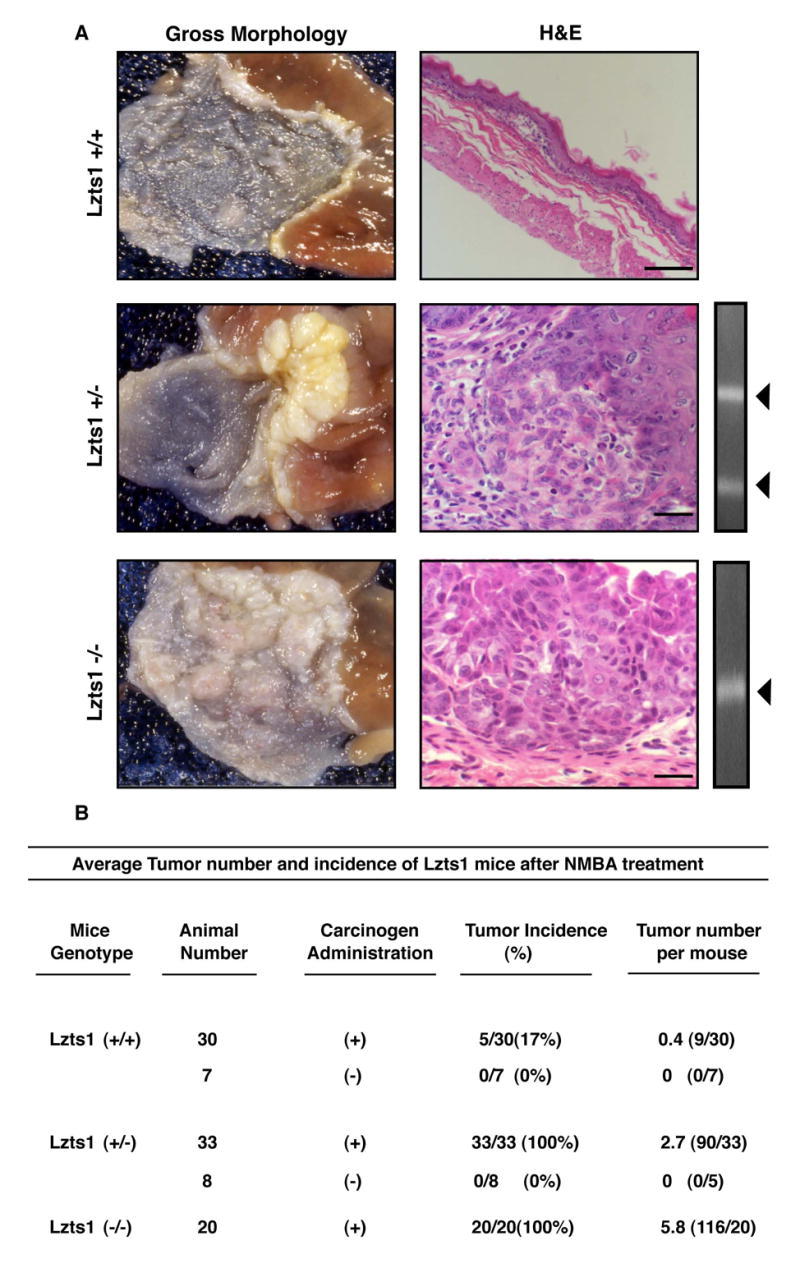
A. Left Panels: Gross morphology of the forestomach and SCJ in Lzts1+/+, +/− and −/− mice (top to bottom, x 35). Middle panels: Hematoxylin and Eosin (H&E) stained forestomach sections. Normal epithelium is shown in Lzts1+/+, early infiltrating carcinoma and infiltrating carcinoma in Lzts1+/− and −/− mice. Scale bars: 100μm (A), 20μm (B and C). Right panels: retention of the remaining wild-type allele in tumor from heterozygous mice. B. Number and incidence of induced tumors in the different genotypes
Histological sections showed an array of lesions typically seen in NMBA-treated animals, including hyperplasia, focal hyperplastic lesions, papillomas and carcinomas. Lzts1−/− and +/− mice developed at high frequency invasive carcinoma of the forestomach, while Lzts1+/+ mostly showed thin and regular epithelia (Figure 8). All +/− mice retained the wild type allele (Figure 8) that was negative for mutations (data not shown), suggesting haploinsufficiency of Lzts1, as supported by the fact that Lzts1 heterozygous mice developed spontaneous tumors retaining the normal allele.
Discussion
The present study demonstrates how inactivation of one or both Lzts1 alleles causes increased incidence of either spontaneous or carcinogen-induced tumors in mice. The development of spontaneous tumors from different organs suggests that Lzts1 absence interferes with important pathways in normal cell homeostasis.
Besides the appearance of spontaneous tumors of different origin we demonstrated that the absence of endogenous Lzts1 results in increased tumor susceptibility of the forestomach after NMBA treatment (present work) and of the bladder after N-butyl-N-(4-hydroxybutyl) nitrosamine (BBN) administration (Vecchione and Croce, unpublished data), further suggesting that Lzts1 absence sensitizes multiple tissue to carcinogenesis. In both cases loss of one Lzts1 allele effectively predisposes mice to carcinogenesis, since In fact, no loss of the wild-type Lzts1 allele or mutation in the Lzts1 coding region was found. Therefore, Lzts1 gene could be haploinsufficient in tumor suppression, as already demonstrated for other tumor suppressor genes like p53 (Venkatachalam et al. 1998), p27kip1 (Fero et al. 1998) or Pten (Kwabi-Addo et al. 2001).
The tumor prone phenotype of Lzts1 knock-out mice is consistent with the role of Lzts1 protein in the control of M phase progression described here. Aneuploidy has been strictly linked to human cancer and it is increasingly accepted that weakened M phase checkpoints likely result in aneuploidy and tumor progression (Weaver and Cleveland, 2005). The finding in Lzts1 null cells of a higher number of missegreagated chromosome, is consistent with Lzts1 tumor suppressor role in several tissues in vivo. The relative late onset of spontaneous tumors observed in Lzts1 KO mice could be explained by the high apoptotic rate of Lzts1 deficient MEFs. Accordingly, in spleens of 5–6 moths old mice (n = 4 WT and 5 KO) there is a 5 fold increase in the amount of caspase-3 negative nuclear fragment (20.25 ±4.2 vs. 4.4 ±2 × HPF; n = 100 HPF) that represented engulfed apoptotic bodies or cells died by mitotic catastrophe after unsuccessful cell division (Figure S6). The present work demonstrates that Lzts1 protein expression is critical for normal mitosis progression. Lzts1 absence shortens the mitotic division time and causes improper chromosome segregation, lowering Cdk1 activity through Cdc25C destabilization. The classical view of M phase entrance and progression implicates a central role for Cdk1 and Cdc25C, with a high Cdk1 activity necessary for the proper execution of M phase (reviewed in Jackson 2006). However, several experimental evidences suggest that the loss of Cdk1 activity primarily drives the exit from mitosis, data arguing that Cdk1 inactivation serves as a mechanism to ensure the correct timing of mitosis exit (Potapova et al., 2006; Cross et al., 2005; Parry et al. 2001; Sigrist et al., 1995; Chang et al., 2003). The activity of Cdk1 upon mitosis entry is higher than needed to maintain the M phase. Such an hysteric loop likely depends on Cdk1 phosphorylation levels, rather than on cyclin expression (Sha et al., 2003). Accordingly, the depletion of Greatwall kinase from Xenopus mitotic extract induced a prompt exit from M phase with an increase of Cdk1-pY15 phosphorylation, likely the result of Cdc25C inactivation rather than cyclin B1 degradation (Yu et al., 2006). This observation is consistent with the fact that pharmacological inhibition of Cdk1 in mitotic cells determines a prompt exit from mitosis, even in the presence of proteasome inhibitors or prometaphase actin drugs (Seong et al., 2003; Niiya et al., 2005; Potapova et al., 2006; Vassilev et al. 2006). Since cyclin B1 degradation is necessary for the onset of anaphase (Chang et al., 2003) and starts as soon as the chromosomes align at the metaphase plate (Clute et al., 2004), decreased Cdk1 activity by changes in its inhibitory phosphorylation could lead to mitotic exit in the window between prophase and metaphase, where Lzts1 seems to principally act.
It has recently reported that Cdc25 phosphatases play different roles in the execution of proper M phase progression with Cdc25A and B necessary for the M phase entry and Cdc25C with a more prominent role in the proper execution of prophase (Lindqvist et al. 2005). This finding is in agreement with our observation that Cdc25C/Lzts1 interaction mainly impairs prophase length rather than M phase entrance. Whether the Lzts1/Cdc25C interaction is dependent on the presence of other proteins and or on Lzts1 and/or Cdc25C phosphorylation is an issue that will be investigated in future studies. However, the data presented here add another piece in the complex regulation of mitosis progression and suggest that the control of protein degradation during M phase governs the progression from prophase to metaphase thus going beyond the regulation of anaphase-cytokinesis transition driven by the activation of the Anaphase Promoting Complex.
Collectively, our data together with the current literature suggest that decreasing Cdk1 activity in interphase cells may result in the G2 block of the cell cycle, whereas decreasing Cdk1 activity in M phase before the establishment of the metaphase plate may cause a faster prometaphase progression and mitotic exit, as showed in Lzts1−/− cells. Interestingly, this hypothesis has been recently experimentally proved in human cell lines using a new selective Cdk1 inhibitor (Vassilev et al. 2006).
In the present work we show that Lzts1 contributes to maintain high levels of Cdk1 activity during M phase, preventing chromosomes missegregation. This important function of Cdk1 has been recently demonstrated by the use of Cdk1 specific inhibitors. The sudden drop of Cdk1 activity in prometaphase arrested cells results in chromosomes missegregation and the formation of an aneuploid progeny (Seong et al., 2003; Vassilev et al. 2006).
In complete agreement with this view, the ko of the RASSF1A protein shortened prometaphase length by prematurely inducing cyclin B1 degradation and led to the appearance of misaligned chromosomes. As a consequence RASSF1A null cells are more prone to cell transformation (Song et al., 2004). Thus, two independent studies support the hypothesis that there may exist proteins (i.e. Lzts1 and RASSF1A), able by different mechanisms, to ensure that Cdk1 activity remains high until the metaphase plate is formed. The absence of such regulators results in a similar tumor prone phenotype linked to chromosome missegregation, suggesting that a fine regulation of Cdk1 activity is necessary not only for the M phase entrance and exit but also for the progression from prometaphase to metaphase. Accordingly, our preliminary data suggest that Lzts1 overexpression in mammary carcinoma cells leads to increased number of M phase arrested cells that eventually die by apoptosis or mitotic catastrophe for an unsuccessful cell division (G.B. and C.M.C. unpublished). Similarly, RASSF1A overexpression results in M phase block at prometaphase followed by cell death (Song et al., 2004). The involvement in this type of regulation of two proteins that regulate protein degradation and bind the microtubules, Lzts1 (Ishii et al. 2001) and RASSF1A (Song et al., 2004) suggests that also the spatial organization of the Cyclin/Cdk1 complex is important in the achievement of the proper activation of the complex, an issue that need further work to be clarified.
In conclusion, our work point to Lzts1 as an important player in the execution of normal M phase progression whose absence leads to impaired chromosome segregation, cells transformation and cancer progression, and make mice lacking Lzts1 an important tool to study mitosis progression, cancer etiology and resistance to anticancer therapy.
Experimental Procedures
Mouse Lzts1 Gene Targeting and mating
Generation of knock-out mice for Lzts1 is better described in supplementary experimental procedures.
Expression vectors
The human CDC25C cDNA was purchased from “MAMMALIAN GENE COLLECTION” ATCC inserted in the pOTB7 vector. The CDC25C cDNA was sub-cloned in the pFlag-CMV 6a expression vector (Sigma). For retroviral expression LZTS1, CDC25C and CDK1AF cDNAs were cloned in pMSCV-Puro vector (Clontech) without any tag. The pHA-Ubiquitin, the pMSCV-Ha-Ras and the pHA-CDK1AF expression vectors, are a kind gift of, Prof. A. Morrione, R. Baserga and G. Draetta, respectively.
Cell cultures and Treatments
MEFs were derived from 13.5-day-old embryos as previously described (McCurrach et al., 2001). Briefly, following removal of the head and internal organs, embryos were rinsed with phosphate-buffered saline (PBS), minced, and resuspended in DMEM containing 10% FBS and 2 mM glutamine, 0.1 mM MEM nonessential amino acids, and 100 IU/ml penicillin, and 100μg/ml streptomycin. Cell media and reagents were obtained from Gibco-Brl except where differently noted. Cells from single embryos were plated into one 100 mm culture dish (Falcon) and incubated at 37°C in a 5% CO2 humidified chamber. Plating after disaggregation of embryos was considered passage 0, and the first replating three days later as passage 1. All the experiments were performed using cells between passage 2 and 10 from three different batches. Genotypes of MEFs were verified by RT-PCR and Southern blot analysis.
For retroviral transduction of proliferating primary MEFs high titer viruses were produced from EcoPack293 (Clontech) transfected with pMSCVs vectors by the calcium-phosphate precipitation technique. Stable mass transduced MEFs populations were selected in Hygromycin B (400μg/ml) or Puromycin (1.5μg/ml), and the effective expression of the transduced proteins was always confirmed by western blot analysis and by RT-PCR using the appropriate MSCV primers (Clontech).
MEFs synchronization in the different phases of the cell cycle and treatments are better described in supplementary experimental procedures.
Immunoprecipitation, Immunoblotting, Immunocytochemistry
Procedures for protein analysis by immunoprecipitation, immunoblotting and immunocytochemistry are described in supplementary experimental procedures and were essentially performed as previously described (Baldassarre et al. 2005).
Time-lapse experiments
Monitoring of cell mitosis was carried out on double thymidine-blocked and non-blocked cells. For double thymidine block, 30–40% confluent cells, seeded in a 35 mm diameter Petri dishes, were incubated with 2 mM thymidine for 14–16 hours at 37°C. After incubation, cells were rinsed with PBS and incubated with thymidine-free medium for 10 hours. Then, cells were split 1:2 and re-incubated with 2 nM thymidine for 18 hours. After 5 hours from the block, cell mitosis was followed with time-lapse cinematography, using an Image Analysis Software (Discovery-1, Universal Imaging, USA). Non-blocked cells were starved over-night with DMEM-0.1% FBS, before time-lapse analysis.
The experimental apparatus for time-lapse experiments consisted of an inverted microscope (IX50 Olympus), a CCD coolsnap camera (RS Photometrix, USA), a x-y-z computer controlled stage PROSCAN (Prior, USA) and a mini-incubator set on the stage. The camera and the computerized stage were synchronized by specific code, to follow several cells in the same experiment. Cells were observed for 7–12 h and images were acquired every 1 or 2 minutes. Movies were realized from the acquired images and analyzed by Metamorph Off -line software.
Animal experiments
Eleven to twelve week-old Lzts1 +/−, −/− or +/+ mice, which were produced in the Thomas Jefferson University animal facility, were given two intragastric doses of NMBA (Ash Stevens Inc) over a week at 2-mg/kg body-weight. All mice were sacrificed 6 weeks after NMBA doses. Animal experiments were conducted after approval of the Institutional animal care and use committee, Thomas Jefferson University.
Tumor microdissection and DNA, RNA analysis
Tumor microdissection and DNA amplification was performed as described before (Bai et al., 2003) following minor modification. Briefly, 15μm section adhered on slides were deparaffinized and the lesions were scraped off the sections in order to be separated from normal tissue. The material obtained was then digested in DNA digestion buffer with addition of 200μM proteinase K. The murine Lzts1 contains three coding exons that were amplified and sequenced with three pairs of primers (available upon request). PCR products were subjected to direct sequencing after purification trough a QIAquick column (Qiagen). RT-PCR was performed with Superscript cDNA synthesis system (Gibco-BRL). PCR amplification was performed using primers (available upon request) corresponding to 5′ and 3′ margin of exon 1.
The cDNA was amplified using glucose-3-phosphate dehydrogenase primers (Clontech) as a control.
Statistical evaluation
The biostatistic program (GraphPad Software, Inc., San Diego, California) was used for statistical analysis. Tumor incidence differences were analyzed by a two-sided Fisher's exact test. All statistical tests were two-sided and were considered to be statistically significant at P<0.05.
Supplementary Material
Acknowledgments
This work was supported partially by AIRC (A.V. and G.B.), Programma Oncotecnologico, Istituto Superiore di Sanita' (A.V.), Ministero della Salute (A.V. and G.B.), and from NCI grants (C.M.C). We thank Paolo Carbone University Federico II, Naples, and Sara D'Andrea CRO, Aviano for excellent technical assistance.
Footnotes
Publisher's Disclaimer: This is a PDF file of an unedited manuscript that has been accepted for publication. As a service to our customers we are providing this early version of the manuscript. The manuscript will undergo copyediting, typesetting, and review of the resulting proof before it is published in its final citable form. Please note that during the production process errors may be discovered which could affect the content, and all legal disclaimers that apply to the journal pertain.
References
- Anbazhagan R, Fujii H, Gabrielson E. Allelic loss of chromosomal arm 8p in breast cancer progression. Am J Pathol. 1998;152:815–819. [PMC free article] [PubMed] [Google Scholar]
- Bai F, Pei XH, Godfrey VL, Xiong Y. Haploinsufficiency of p18INK4c sensitizes mice to carcinogen-induced tumorigenesis. Mol Cell Biol. 2003;23:1269–1277. doi: 10.1128/MCB.23.4.1269-1277.2003. [DOI] [PMC free article] [PubMed] [Google Scholar]
- Baldassarre G, Belletti B, Nicoloso MS, Schiappacassi M, Vecchione A, Spessotto P, Morrione A, Canzonieri V, Colombatti A. p27(Kip1)-stathmin interaction influences sarcoma cell migration and invasion. Cancer Cell. 2005;7:51–63. doi: 10.1016/j.ccr.2004.11.025. [DOI] [PubMed] [Google Scholar]
- Blajeski AL, Phan VA, Kottke TJ, Kaufmann SH. G1 and G2 cell-cycle arrest following microtubule depolymerization in human breast cancer cells. J Clin Invest. 2002;110:91–99. doi: 10.1172/JCI13275. [DOI] [PMC free article] [PubMed] [Google Scholar]
- Cabeza-Arvelaiz Y, Sepulveda JL, Lebovitz RM, Thompson TC, Chinault AC. Functional identification of LZTS1 as a candidate prostate tumor suppressor gene on human chromosome 8p22. Oncogene. 2001;20:4169–4179. doi: 10.1038/sj.onc.1204539. [DOI] [PubMed] [Google Scholar]
- Carnero A. Targeting the cell cycle for cancer therapy. Br J Cancer. 2002;87:129–133. doi: 10.1038/sj.bjc.6600458. [DOI] [PMC free article] [PubMed] [Google Scholar]
- Chao JI, Kuo PC, Hsu TS. Down-regulation of survivin in nitric oxide-induced cell growth inhibition and apoptosis of the human lung carcinoma cells. J Biol Chem. 2004;279:20267–20276. doi: 10.1074/jbc.M312381200. [DOI] [PubMed] [Google Scholar]
- Chang DC, Xu N, Luo KQ. Degradation of cyclin B is required for the onset of anaphase in mammalian cells. J Biol Chem. 2003;278:37865–37873. doi: 10.1074/jbc.M306376200. [DOI] [PubMed] [Google Scholar]
- Chen F, Zhang Z, Bower J, Lu Y, Leonard SS, Ding M, Castranova V, Piwnica-Worms H, Shi X. Arsenite-induced Cdc25C degradation is through the KEN-box and ubiquitin-proteasome pathway. Proc Natl Acad Sci USA. 2002;99:1990–1995. doi: 10.1073/pnas.032428899. [DOI] [PMC free article] [PubMed] [Google Scholar]
- Cimini D, Moree B, Canman JC, Salmon ED. Merotelic kinetochore orientation occurs frequently during early mitosis in mammalian tissue cells and error correction is achieved by two different mechanisms. J Cell Sci. 2003;116:4213–25. doi: 10.1242/jcs.00716. [DOI] [PubMed] [Google Scholar]
- Clute P, Pines J. Temporal and spatial control of cyclin B1 destruction in metaphase. Nat Cell Biol. 1999;1:82–87. doi: 10.1038/10049. [DOI] [PubMed] [Google Scholar]
- Cross FR, Schroeder L, Kruse M, Chen KC. Quantitative characterization of a mitotic cyclin threshold regulating exit from mitosis. Mol Biol Cell. 2005;16:2129–2138. doi: 10.1091/mbc.E04-10-0897. [DOI] [PMC free article] [PubMed] [Google Scholar]
- El-Naggar AK, Coombes MM, Batsakis JG, Hong WK, Goepfert H, Kagan J. Localization of chromosome 8p regions involved in early tumorigenesis of oral and laryngeal squamous carcinoma. Oncogene. 1998;16:2983–2987. doi: 10.1038/sj.onc.1201808. [DOI] [PubMed] [Google Scholar]
- Fero M, Randel E, Gurley KE, Roberts JM, Kemp CJ. The murine gene p27Kip1 is haplo-insufficient for tumor suppression. Nature. 1998;396:177–180. doi: 10.1038/24179. [DOI] [PMC free article] [PubMed] [Google Scholar]
- Han Y, Shen H, Carr BI, Wipf P, Lazo JS, Pan S. NAD(P)H:quinone oxidoreductase-1-dependent and -independent cytotoxicity of potent quinone Cdc25 phosphatase inhibitors. J Pharmacol Exp Ther. 2004;309:64–70. doi: 10.1124/jpet.103.059477. [DOI] [PubMed] [Google Scholar]
- Ichikawa T, Nihei N, Suzuki H, Oshimura M, Emi M, Nakamura Y, Hayata I, Isaacs JT, Shimazaki J. Suppression of metastasis of rat prostatic cancer by introducing human chromosome 8. Cancer Res. 1994;54:2299–2302. [PubMed] [Google Scholar]
- Ishii H, Baffa R, Numata S, Murakumo Y, Rattan S, Inoue H, Mori M, Fidanza V, Alder H, Croce CM. The FEZ1 gene at chromosome 8p22 encodes a leucine-zipper protein, and its expression is altered in multiple human tumors. Proc Natl Acad Sci USA. 1999;96:3928–3933. doi: 10.1073/pnas.96.7.3928. [DOI] [PMC free article] [PubMed] [Google Scholar]
- Ishii H, Vecchione A, Murakumo Y, Baldassarre G, Numata S, Trapasso F, Alder H, Baffa R, Croce CM. FEZ1/LZTS1 gene at 8p22 suppresses cancer cell growth and regulates mitosis. Proc Natl Acad Sci USA. 2001;98:10374–10379. doi: 10.1073/pnas.181222898. [DOI] [PMC free article] [PubMed] [Google Scholar]
- Jackson PK. Climbing the Greatwall to mitosis. Mol Cell. 2006;22:156–17. doi: 10.1016/j.molcel.2006.04.005. [DOI] [PubMed] [Google Scholar]
- Kwabi-Addo B, Giri D, Schimdt K, Podsypanina K, Parson R, Greenberg N, Ittmann M. Haploinsufficiency of Pten tumor suppressor gene promotes prostate cancer progression. Proc Natl Acad Sci USA. 2001;98:11563–11568. doi: 10.1073/pnas.201167798. [DOI] [PMC free article] [PubMed] [Google Scholar]
- Lindqvist A, Kallstrom H, Lundgren A, Barsoum E, Rosenthal CK. Cdc25B cooperates with Cdc25A to induce mitosis but has a unique role in activating cyclin B1-Cdk1 at the centrosome. J Cell Biol. 2005;171:35–45. doi: 10.1083/jcb.200503066. [DOI] [PMC free article] [PubMed] [Google Scholar]
- Magee PN. Cancer Surv. 1989;8:207–239. [PubMed] [Google Scholar]
- McCurrach ME, Lowe SW. Methods for studying pro- and antiapoptotic genes in nonimmortal cells. Methods Cell Biol. 2001;66:197–227. doi: 10.1016/s0091-679x(01)66010-2. [DOI] [PubMed] [Google Scholar]
- McGarry TJ, Kirschner MW. Geminin, an inhibitor of DNA replication, is degraded during mitosis. Cell. 1998;93:1043–1053. doi: 10.1016/s0092-8674(00)81209-x. [DOI] [PubMed] [Google Scholar]
- Nigg EA. Mitotic kinases as regulators of cell division and its checkpoints. Nat Rev Mol Cell Biol. 2001;2:21–32. doi: 10.1038/35048096. [DOI] [PubMed] [Google Scholar]
- Niiya F, Xie X, Lee KS, Inoue H, Miki T. Inhibition of cyclin-dependent kinase 1 induces cytokinesis without chromosome segregation in an ECT2 and MgcRacGAP-dependent manner. J Biol Chem. 2005;280:36502–36509. doi: 10.1074/jbc.M508007200. [DOI] [PubMed] [Google Scholar]
- Nonaka D, Fabbri A, Roz L, Mariani L, Vecchione A, Moore GW, Tavecchio L, Croce CM, Sozzi G. Reduced FEZ1/LZTS1 expression and outcome prediction in lung cancer. Cancer Res. 2005;65:1207–1212. doi: 10.1158/0008-5472.CAN-04-3461. [DOI] [PubMed] [Google Scholar]
- Ono K, Uzawa K, Nakatsuru M, Shiiba M, Mochida Y, Tada A, Bukawa H, Miyakawa A, Yokoe H, Tanzawa H. Down-regulation of FEZ1/LZTS1 gene with frequent loss of heterozigosity in oral squamous cell carcinomas. Int J Oncol. 2003;23:297–302. [PubMed] [Google Scholar]
- Parry DH, O'Farrell PH. The schedule of destruction of three mitotic cyclins can dictate the timing of events during exit from mitosis. Curr Biol. 2001;11:671–683. doi: 10.1016/s0960-9822(01)00204-4. [DOI] [PMC free article] [PubMed] [Google Scholar]
- Potapova TA, Daum JR, Pittman BD, Hudson JR, Jones TN, Satinover DL, Stukenberg PT, Gorbsky GJ. The reversibility of mitotic exit in vertebrate cells. Nature. 2006;440:954–958. doi: 10.1038/nature04652. [DOI] [PMC free article] [PubMed] [Google Scholar]
- Seong YS, Min C, Li L, Yang JY, Kim S-Y, Cao X, Kim K, Yuspa SH, Chung HH, Lee KS. Characterization of a novel cyclin-dependent kinase 1 inhibitor, BMI-1026. Cancer Res. 2003;63:7384–7391. [PubMed] [Google Scholar]
- Sha W, Moore J, Chen K, Lassaletta AD, Yi CS, Tyson JJ, Sible JC. Hysteresis drives cell-cycle transitions in Xenopus laevis egg extracts. Proc Natl Acad Sci USA. 2003;100:975–980. doi: 10.1073/pnas.0235349100. [DOI] [PMC free article] [PubMed] [Google Scholar]
- Shuji K, Gerburg W, Masafumi N, Kun Ping L. Telomeric protein Pin2/TRF1 induces mitotic entry and apoptosis in cells with short telomers and is down-regulated in human breast tumors. Oncogene. 2001;20:1497–1508. doi: 10.1038/sj.onc.1204229. [DOI] [PubMed] [Google Scholar]
- Sigrist S, Jacobs H, Stratmann R, Lehner CF. Exit from mitosis is regulated by Drosophila fizzy and the sequential destruction of cyclins A, B and B3. EMBO J. 1995;14:4827–4838. doi: 10.1002/j.1460-2075.1995.tb00164.x. [DOI] [PMC free article] [PubMed] [Google Scholar]
- Smits VAJ, Medema RH. Checking out the G2/M transition. Bioch Bioph Acta. 2001;1519:1–12. doi: 10.1016/s0167-4781(01)00204-4. [DOI] [PubMed] [Google Scholar]
- Song MS, Song SJ, Ayad NG, Chang JS, Lee JH, Hong HK, Lee Ho, Choi N, Kim J, Kim H, et al. The tumour suppressor RASSF1A regulates mitosis by inhibiting the APC-Cdc20 complex. Nat Cell Biol. 2004;6:129–137. doi: 10.1038/ncb1091. [DOI] [PubMed] [Google Scholar]
- Tobey RA, Oishi N, Crissman HA. Cell cycle synchronization: reversible induction of G2 synchrony in cultured rodent and human diploid fibroblasts. Proc Natl Acad Sci USA. 1990;87:5104–5108. doi: 10.1073/pnas.87.13.5104. [DOI] [PMC free article] [PubMed] [Google Scholar]
- Toyooka S, Fukuyama Y, Wistuba II, Tockman MS, Minna JD, Gazdar AF. Differential Expression of FEZ1/LZTS1 Gene in Lung Cancers and Their Cell Cultures. Clin Cancer Res. 2002;8:2292–2297. [PubMed] [Google Scholar]
- Vassilev LT, Tovar C, Chen S, Knezevic D, Zhao X, Sun H, Heimbrook DC, Chen L. Selective small-molecule inhibitor reveals critical mitotic functions of human CDK1. Proc Natl Acad Sci USA. 2006;103:10660–5. doi: 10.1073/pnas.0600447103. [DOI] [PMC free article] [PubMed] [Google Scholar]
- Vecchione A, Ishii H, Shiao YH, Trapasso F, Rugge M, Alder H, Croce CM, Baffa R. Altered expression of Fez1 protein in gastric carcinoma. Clin Cancer Res. 2001;7:1546–1552. [PubMed] [Google Scholar]
- Vecchione A, Ishii H, Baldassarre G, Bassi P, Trapasso F, Alder H, Pagano F, Gomella LG, Croce CM, Baffa R. FEZ1/LZTS1 is down-regulated in high-grade bladder cancer, and its restoration suppresses tumorigenicity in transitional cell carcinoma cells. Am J of Pathol. 2002;160:1345–1352. doi: 10.1016/S0002-9440(10)62561-8. [DOI] [PMC free article] [PubMed] [Google Scholar]
- Venkatachalam S, Shi YP, Jones SN, Vogel H, Bradley A, Pinkel D, Donehower LA. Retention of wild-type p53 in tumors from p53 heterozygous mice: reduction of p53 dosage can promote cancer formation. EMBO J. 1998;17:4657–4667. doi: 10.1093/emboj/17.16.4657. [DOI] [PMC free article] [PubMed] [Google Scholar]
- Vocke CD, Pozzatti RO, Bostwick DG, Florence CD, Jennings SB, Strup SE, Duray PH, Liotta LA, Emmert-Buck MR, Linehan WM. Analysis of 99 microdissected prostate carcinomas reveals a high frequency of allelic loss on chromosome 8p12–21. Cancer Res. 1996;56:2411–2416. [PubMed] [Google Scholar]
- Wagner U, Bubendorf L, Gasser TC, Moch H, Gorog JP, Richter J, Mihatsch MJ, Waldman FM, Sauter G. Chromosome 8p deletions are associated with invasive tumor growth in urinary bladder cancer. Am J Pathol. 1997;151:753–759. [PMC free article] [PubMed] [Google Scholar]
- Weaver BAA, Cleveland DW. Decoding the links between mitosis, cancer and chemotherapy. The mitotic checkpoint, adaptation and cell death. Cancer Cell. 2005;8:7–12. doi: 10.1016/j.ccr.2005.06.011. [DOI] [PubMed] [Google Scholar]
- Westendorf JM, Rao PN, Gerace L. Cloning of cDNAs for M-phase phosphoproteins recognized by the MPM2 monoclonal antibody and determination of the phosphorylated epitope. Proc Natl Acad Sci USA. 1994;91:714–718. doi: 10.1073/pnas.91.2.714. [DOI] [PMC free article] [PubMed] [Google Scholar]
- Yang CS. Research on esophageal cancer in China: a review. Cancer Res. 1980;40:2633–2644. [PubMed] [Google Scholar]
- Yu J, Zhao Y, Li Z, Galas S, Goldberg ML. Greatwall kinase participates in the CDC2 autoregulatory loop in Xenopus egg extracts. Mol Cell. 2006;22:83–91. doi: 10.1016/j.molcel.2006.02.022. [DOI] [PubMed] [Google Scholar]
Associated Data
This section collects any data citations, data availability statements, or supplementary materials included in this article.