

Abstract
Nitric oxide (NO) derived from nitric oxide synthase (NOS) is an important paracrine effector that maintains vascular tone. The release of NO mediated by NOS isozymes under various O2 conditions critically determines the NO bioavailability in tissues. Because of experimental difficulties, there has been no direct information on how enzymatic NO production and distribution change around arterioles under various oxygen conditions. In this study, we used computational models based on the analysis of biochemical pathways of enzymatic NO synthesis and the availability of NOS isozymes to quantify the NO production by neuronal NOS (NOS1) and endothelial NOS (NOS3). We compared the catalytic activities of NOS1 and NOS3 and their sensitivities to the concentration of substrate O2. Based on the NO release rates predicted from kinetic models, the geometric distribution of NO sources and mass balance analysis, we predicted the NO concentration profiles around an arteriole under various O2 conditions. The results indicated that NOS1-catalyzed NO production was significantly more sensitive to ambient O2 concentration than that catalyzed by NOS3. Also, the high sensitivity of NOS1 catalytic activity to O2 was associated with significantly reduced NO production and therefore NO concentrations, upon hypoxia. Moreover, the major source determining the distribution of NO was NOS1, which was abundantly expressed in the nerve fibers and mast cells close to arterioles, rather than NOS3, which was expressed in the endothelium. Finally, the perivascular NO concentration predicted by the models under conditions of normoxia was paradoxically at least an order of magnitude lower than a number of experimental measurements, suggesting a higher abundance of NOS1 or NOS3 and/or the existence of other enzymatic or non-enzymatic sources of NO in the microvasculature.
Keywords: theoretical model, computational model, reaction kinetics, mass balance analysis
INTRODUCTION
Nitric oxide (NO) is a potent vasodilator with diverse physiological and pathological functions [1]. NO can be enzymatically synthesized in a reaction catalyzed by nitric oxide synthase (NOS). Three isoforms of NOS have been identified: neuronal NOS (nNOS or NOS1), inducible NOS (iNOS or NOS2), and endothelial NOS (eNOS or NOS3). The substrates that are required for NO synthesis are L-arginine, O2, and nicotinamide adenine dinucleotide phosphate (NADPH). Once formed in the vasculature, NO diffuses into the smooth muscle and activates soluble guanylate cyclase (sGC) that catalyzes the formation of 3′,5′-cyclic guanosine monophosphate (cGMP), resulting in smooth muscle relaxation and therefore vasodilation [1].
NO derived from the NOS3 found in vascular endothelial cells has been considered to be the major regulator of vascular tone, acting through a paracrine effect [1, 2]. However, because of experimental difficulties, there have been no direct and quantitative measurements of NO from specific vascular and perivascular sources (e.g., the endothelium, nerve fibers, or mast cells containing NOS1) in the microvasculature, nor have any studies directly examined how NO release rates and distribution relate to different O2 levels. Recently, microfluorographic and immunohistochemical analyses have indicated that there is strong expression of NOS1 around arterioles [3–5] while the expression of NOS3 is much lower [4]. Computational models [6, 7] have demonstrated that the enzymatic activity of NOS1 has a significant effect on the levels of NO in the smooth muscle. In these previous models, the level of NO production catalyzed by NOS1 was assumed to be equal or similar to that of NOS3, which was estimated by fitting the data for the perivascular NO concentration to a mathematical model with the assumption that all the measured NO was derived from NOS3 [8].
The NO release rates from specific sources are critical parameters that determine the NO bioavailability in the microvasculature. However, little is known about NO production rates within specific cellular elements around an arteriole. Recent experimental evidence has shown that NO can be synthesized from both endothelial and nonendothelial sources around arterioles: NOS3 in the endothelium catalyzes the formation of NO while NOS1 in the nerve fibers adjacent to the blood vessel wall and nearby interstitial mast cells also produces NO [4, 9, 10]. We have used a theoretical model based on the analysis of the biochemical pathways of NOS3 to quantify the NO production in the microvasculature and have discovered a paradox: the NOS3-derived NO cannot account for the previously measured perivascular NO concentration [11]. In this study, we extended our investigation to include the NOS1- and NOS3-derived NO distribution under various oxygen conditions in the microvasculature. We specifically considered the catalytic activities, amounts, and locations of NOS1 and NOS3. We first quantified NOS1-derived NO through biochemical pathway analysis and then compared the influence of the NOS1 and NOS3 catalytic mechanisms on NO production and distribution. We also used the production rates of NOS1 and NOS3 around the arterioles derived from the model to consider the NO profile in the microvasculature. We further examined how the vascular and perivascular NO release, and therefore NO transport, are affected by the change in ambient oxygen tension. Our results showed that NO production by NOS1 in the perivascular nerve fibers and interstitial cells accounted for a far larger share of the total amount of NO than did that produced by NOS3 in the endothelium. Also, the high sensitivity of the NOS1 catalytic activity to O2 was associated with significantly reduced NO production, and therefore reduced NO concentrations, in hypoxia. Finally, the perivascular NO concentration in normoxia predicted by the models was at least an order of magnitude lower than that in a number of reported experimental measurements, suggesting a higher abundance of NOS1 or NOS3 distribution and/or the existence of other enzymatic or non-enzymatic NO sources in the microvasculature.
MODEL FORMULATION
NOS1 catalysis pathway
We have previously formulated a model to quantify the NO release by NOS3 located in the vascular endothelial cells under physiological conditions [11]. We have now applied the same analysis to the NOS1. The catalytic mechanism of NOS1 has been extensively studied and is similar to that of NOS3; however, some of the kinetic parameters are significantly different for the two pathways [12, 13]. Basically, like NOS3, NOS1 catalyzes NO formation through sequential electron transfer and the oxidation of L-arginine. NOS1 binds the substrates L-arginine, O2, and NADPH and catalyzes the N? -hydroxylation of the guanidine group of L-arginine to form N? -hydroxyl-L-arginine (NOHA). NOHA is then further oxidized to L-citrulline through NOS1-mediated catalysis and NO is released. This catalytic pathway of NOS1 is shown in Figure 1. In the catalytic process, flavin mononucleotide (FMN), flavin adenine dinucleotide (FAD), and tetrahydrobiopterin (H4B) are required as coenzymes, and the presence of Ca2+/calmodulin can aid the electron transfer. In our calculations, we assumed that the presence of all these coenzymes and Ca2+/calmodulin was sufficient, and we therefore ignored the regulation of NOS1 catalysis that is mediated by the availability of coenzymes. The time-dependent ordinary differential equations that describe the concentration changes in the different species in Figure 1 are listed in the Appendix. The concentrations of substrate O2 and L-arginine were specified as constants, assuming that there is unlimited supply of oxygen from the environment and a large cellular reservoir of L-arginine. With proper initial conditions, the solution of these equations will yield the production rate of NO ( ) per unit volume of tissue that contains NOS1.
Figure 1.
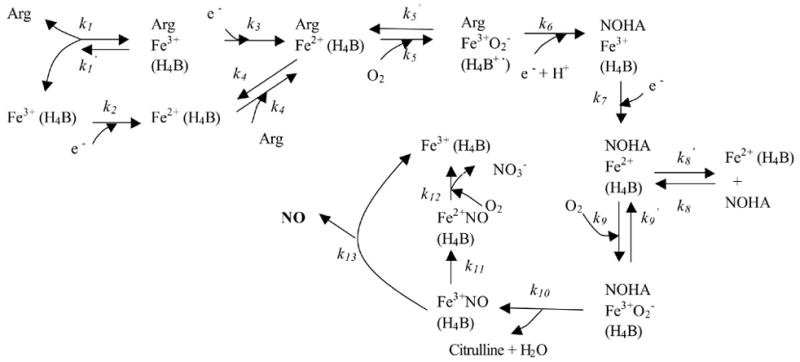
Mechanism of catalysis by NOS1. H4B or its reduced form is bound to the enzyme. The heme iron of NOS1 binds L-arginine and O2 and undergoes a series of oxygenation/reduction reactions; NO is released during the catalytic cycle. NOS1 is represented by the heme iron (Fe), where most of the catalytic reactions occur. Arg indicates L-arginine. (Adapted from [13] and [55]).
Parameters for the biochemical pathway model
The kinetic parameters for each step in Figure 1 are listed in Table 1. Specifically, L-arginine binds to both the ferric and ferrous heme of NOS1 with an apparent binding rate of 2.5 μM−1·s−1, while the apparent dissociation rate is 2.5 s−1 [14]. Both were measured at 15°C. Here we assumed the binding rate of L-arginine to the ferric heme (k1) as 1.25 μM−1·s−1 and L-arginine to the ferrous heme (k4) as 1.25 μM−1·s−1 (the sum of k1 and k4 being equal to the measured apparent binding rate). Similarly, the dissociation rate of L-arginine from the ferric heme (k1′) was assumed to be 1.25 s−1 and L-arginine from the ferrous heme (k4′) was 1.25 s−1. Regarding these two assumptions, we tested the sensitivity of NO production to the choice of k1 and k4 with the constraint that the sum of k1 and k4 was fixed at 2.5 μM−1·s−1 (the apparent binding rate). As shown in the supplemental materials (Figure S1(A)), the NO production by NOS1 did not strongly depend on whether the binding of L-arginine to NOS1 heme primarily occurs at the ferric or the ferrous heme. Moreover, NO production was insensitive to how the apparent dissociation rate was split between k1′ and k4′ (supplemental materials, Figure S1(B)). The heme reduction rate (k2, k3, k7, and k11) was reported to be 2.6 s−1 at 10°C [12]. The rate of O2 binding to heme iron (k5) was 1.0 μM−1·s−1, while the dissociation rate (k5′) was 27 s−1 at 10°C [12, 15]. In single-turnover experiments, the reaction rate (k6) for the conversion of Fe3+O2−to ferric heme with NOHA formation was reported to be 22 s−1 at 10°C [12, 15]. After it is formed, NOHA can dissociate from the complex and subsequently rebind to the heme iron of NOS1. The dissociation rate (k8′) for this reaction is 2.5 s and the rebinding rate (k8) is 13.2 μM−1·s−1 at 10°C [14]. With NOHA bound, the rates of O2 binding to (k9) and dissociation from (k9′) heme are 1.0 μM−1·s−1 and 50 s−1, respectively, at 10°C [15]. The rate (k10) of the subsequent reaction to form Fe3+NO is 4.9 s−1 at 10°C [15]. The oxidation rate (k12) of Fe2+NO is 0.0013 μM−1·s−1, while the NO release rate from the ferric heme is 5 s−1 at 10°C [12]. These kinetic parameters, which were obtained at temperatures lower than physiological conditions, were scaled to 37°C using the Arrhenius equation [11]. The activation energy of each step during NOS1 catalysis is not available in the literature and we used the average activation energy of all the intermediate catalytic steps of NOS3 [11]. We also conducted a parameter sensitivity analysis (supplemental materials), which provides a range of NO production rate with the variations in single parameters. The scaled parameters are given in Table 1.
Table 1.
Parameters of NOS1 activity.
| Coefficient | Values | Unit | References | |
|---|---|---|---|---|
| CNOS1 | 0.3 – 0.9 | μM | text | |
| O2 concentration | 1 - 200 | μM | text | |
| L-arginine concentration | ~100 | μM | text | |
| At 37°C | ||||
| k1 | 1.25 (15°C) | 6.6 | μM−1·s−1 | [14]; text |
| k1′ | 1.25 (15°C) | 6.6 | s−1 | [14]; text |
| k2 | 2.6 (10°C) | 20.8 | s−1 | [12] |
| k3 | 2.6 (10°C) | 20.8 | s−1 | [12] |
| k4 | 1.25 (15°C) | 6.6 | μM−1·s−1 | [14]; text |
| k4′ | 1.25 (15°C) | 6.6 | s−1 | [14]; text |
| k5 | 1.0 (10°C) | 8.5 | μM−1·s−1 | [12, 15] |
| k5′ | 27 (10°C) | 215.6 | s−1 | [12, 15] |
| k6 | 22 (10°C) | 175.6 | s−1 | [12, 15] |
| k7 | 2.6 (10°C) | 20.8 | s−1 | [12] |
| k8 | 2.5 (10°C) | 13.2 | s−1 | [14]; text |
| k8′ | 2.5 (10°C) | 13.2 | μM−1·s−1 | [14]; text |
| k9 | 1.0 (10°C) | 8.6 | μM−1·s−1 | [15] |
| k9′ | 50 (10°C) | 399.2 | s−1 | [15] |
| k10 | 4.9 (10°C) | 39.1 | s−1 | [15] |
| k11 | 2.6 (10°C) | 20.8 | s−1 | [12] |
| k12 | 0.0013 (10°C) | 0.01 | μM−1·s−1 | [12] |
| k13 | 5 (10°C) | 39.9 | s−1 | [12] |
In terms of the concentration of NOS1 in the perivascular region, no direct NOS1 concentration measurements from the nerve fibers or mast cells have been reported. However, fluorescent and immunohistochemical measurements have qualitatively showed a much higher presence of NOS1 than NOS3 around small arterioles [4]. Moreover, Wehling et al. [16] have reported that NOS1 comprises approximately 0.05% of the total muscle protein in muscle fibers. On the other hand, NOS3 accounts for approximately 0.0025% of the total protein in endothelial cells [11, 17]. Based on the above quantitative measurements involving different tissues and direct qualitative fluorescent measurements, we assumed the intracellular concentration of NOS1 to be approximately 20-fold higher than that of NOS3. We also tested the NO production by NOS1 when NOS1 concentration was in a possible range: in our calculations, we used 0.3 to 0.9 μmol molecules per L of NOS1-containing tissue volume as NOS1 concentrations. For the concentration of substrate L-arginine, we assumed the concentration of L-arginine accessible to NOS1 to be the same as that for NOS3, which is 100 μM or higher [18]. We also varied the concentration of another substrate, O2, within the possible physiological range, and tested its effects on the NO production rate.
NO transport around an arteriole
After modeling the NO production by NOS1, we simulated the NO transport around an arteriole utilizing the predicted NO production rates. We considered a small arteriole and its surrounding tissue containing both NOS1 and NOS3 and evaluated the NO concentration distribution. Previous models considering the contribution of different NOS isoforms to NO exposure in smooth muscle [6, 7] have estimated the NO production rates: the NO production rate from the endothelium containing NOS3 was estimated with a mathematical model that fit the experimental data from perivascular NO measurements [8], while the NO production rate from the nerve fibers containing NOS1 was tested using similar values. In this study, we used the NO production rates obtained from our biochemical pathway analysis and conducted sensitivity analysis with respect to the substrate concentrations.
The geometry of the arteriole and its surrounding tissue was based on the micromorphological measurements that defined the spatial distribution of different NOS isoforms [4]. The arteriole was modeled as a cylinder, as in the previous model by Kavdia and Popel [6]. The arteriole and its surrounding tissue consist of the following layers: (1) a red blood cell (RBC)-rich layer; (2) a RBC-free plasma layer; (3) endothelium layer, including the endothelial glycocalyx; (4) interstitial space (IS) layer between the endothelium and the smooth muscle layers; (5) smooth muscle (SM) layer; (6) nerve fiber layer; (7) non-perfused perivascular (NPT) tissue layer; and (8) perfused tissue (PT) layer containing capillaries. The mast cells scattered in the NPT layer were considered as sub-regions that contain NOS1. The mast cells were modeled as circles in the cross-section of blood vessel and surrounding tissues, with a radius of 4.5–6 μm [19]. The dimensions of all regions in our model are summarized in Table 2.
Table 2.
Parameters of the NO diffusion-reaction model around an arteriole. The radius of each layer except the mast cell in the model is the distance from the center of the lumen to the outer surface of the layer.
| Parameters | Values | Unit | References |
|---|---|---|---|
| Radius | |||
| RBC-rich layer | 10.25 | μm | text |
| RBC-free layer | 12.5 | μm | text |
| Endothelium layer | 12.75 | μm | text |
| Interstitial space layer | 13.0 | μm | text |
| Smooth muscle layer | 16.0 | μm | text |
| Nerve fiber layer | 18.0 | μm | text |
| Non-perfused tissue layer | 100.0 | μm | text |
| Perfused tissue layer | 1000.0 | μm | text |
| Mast cell | 4.5–9 | μm | [19] |
| Reaction rate | |||
| with Hb | 1230 | s−1 | [6] |
| with O2 | 9.6×10⁻⁶ | μM−2·s−1 | [23] |
| with sGC | 5×10⁻² | μM−1·s−1 | [8] |
| Effective rate with capillary RBCs | 12.4 | s−1 | [6] |
| Effective rate with oxygenated tissue | 5.38×10⁻¹⁰ | μM−1·s−1(cell/ml)−1 | [24] |
| Density of tissue cellular sinks | 1×10⁸ | cell/ml | [24] |
| Diffusion coefficient, NO | 3300 | μm2/s | [8] |
| Hematocrit | 45% | N/A | text |
The governing equation describing the NO transport in each layer is:
| (1) |
where DNO is the NO diffusion coefficient, CNO is the NO concentration, and R is the sum of NO production and consumption in each layer. When the NO distribution reaches an equilibrium state, . DNO is 3300 μm2/s in all regions [8]. Here we ignored the effect of convection of blood in the lumen, as justified in [20].
In the RBC-rich layer, NO is scavenged by hemoglobin contained in RBCs. Here we ignored the possible non-enzymatic NO production released by RBCs [21, 22]. Therefore,
| (2) |
where kHb = 1230 s−1 when the blood is treated as homogeneous and the core hematocrit is 45% [6]. In the RBC-free layer, there is no NO production and NO is consumed through the reaction with O2:
| (3) |
where the NO and O2 reaction rate kO2 = 9.6×10⁻⁶ μM−2·s−1 [23]. In the endothelium layer, NO is produced through the catalysis of NOS3 and, meanwhile, NO reacts with O2:
| (4) |
where QNOS 3 is the NO production rate through the catalysis of NOS3 in the endothelium. In this study, we used 0.017 μM/s as the value of QNOS 3, based on the biochemical pathway analysis [11]. In the interstitial space (IS) layer, there is no NO production and NO is consumed through the reaction with O2:
| (5) |
In the smooth muscle (SM) layer, there is no NO production and NO is consumed through the reaction with sGC:
| (6) |
where ksGC = 5×10⁻² μM−1·s−1 [8]. In the layer representing nerve fibers, NO is produced through the catalysis of NOS1 and NO is consumed through the reaction with O2:
| (7) |
where QNOS1 is the NO production rate through the catalysis of NOS1 in the nerve fibers, as determined by the kinetic model discussed above. In the non-perfused parenchymal tissue, experiments have shown that NO can be consumed by the cells through an oxygen-dependent mechanism [24, 25]. This reaction can be approximated [24]:
| (8) |
where kt is the effective NO scavenging rate by cellular sinks in oxygenated tissue and is equal to 5.38 ×10⁻¹⁰ μM−1·s−1·(cell/ml)−1 [24]. Ccell is the density of the cellular sinks in the tissue and is chosen as 1×10⁸ cell/ml [24]. Experimental evidence suggests that a significant amount of NOS1-derived NO is derived from the interstitial mast cells located in the non-perfused region. Thus, when the sub-regions of mast cells are considered, the NO production rate of QNOS 1is applied in each mast cell sub-region. The positions of mast cells were selected to represent the distribution of these cells observed in fluorescent and immunohistochemical studies [4]. In the perfused tissue, the hemoglobin in the capillaries consumes NO, and the capillary endothelium produces NO. Therefore,
| (9) |
where QNOS 3–capillary is a homogeneous value for the entire perfused tissue layer and is estimated to be 1.36×10⁻⁴ μM/s, based on the NO production rate of the arteriolar endothelium (QNOS 3) [11] and the capillary density in the tissue [6]. kcap is the effective reaction rate of NO with capillary blood in the perfused area. It is determined by the capillary hematocrit and the fractional volume and is calculated to be 12.4 s−1 [6].
We assumed that there is no flux of NO at either the center of the blood vessel or the outermost edge of the perfused tissue. We used these as the boundary conditions to solve the governing Equation (1) in each layer simultaneously. When the mast cells were not considered, all the regions were symmetrical around the axis of the arteriole and thus we used the cylindrical coordinates. When the mast cells were considered, cylindrical symmetry no longer applied and thus we used Cartesian coordinates to simulate the cross section of the tissue consisting of the various layers described above.
Numerical solution
The ordinary differential equations (ODE) that describe the kinetics of NOS, coupled with appropriate initial conditions, were solved numerically using Compaq Visual Fortran 6 software (Digital Equipment Corporation). The program uses the ODE solver IVMRK that is incorporated in the Compaq Visual Fortran developer studio. For solving the partial differential equations describing NO transport, we used FlexPDE software package (PEDSolutions, Antioch, CA). The codes calculating both the rate of NO production catalyzed by NOS and the NO concentration distribution were implemented on a single Pentium processor computer with 3 GHz and 1024 MB synchronous dynamic random access memory (SDRAM).
Results
Production of NO by perivascular NOS1 and endothelial NOS3
We applied the kinetic model to quantify NO production by NOS1. Figure 2 shows the NO production rates after the system reached steady state, when NOS1 concentrations ranged from 0.3 to 0.9 μM. The ambient oxygen concentration was 100 μM and the L-arginine concentration was 100 μM. The steady-state NO production rate by NOS1 shown in Figure 2 was from 0.39 to 1.16 μM/s. NO production by NOS3 in the endothelium, assuming a physiological NOS3 concentration of 0.045 μM, was 0.017 μM/s [11], much lower than that generated by NOS1 in the perivascular tissue. Here μM signifies micromole per L of the neural tissue containing NOS1 or endothelial tissue containing NOS3, respectively. Note that unlike NO production by NOS3 that reached the steady state monotonically, there was a transient higher production of NO before steady state was reached in the case of NOS1 catalysis. This maximum value was in the range of 1.1 to 3.3 μM/s, about 3-fold higher than the corresponding steady production. This high, transient rate may have significant physiological impact when NOS1 around the arterioles is stimulated by agonists from resting conditions. We subsequently tested the effect of this rate on the distribution of NO concentration around the microvasculature (below).
Figure 2.
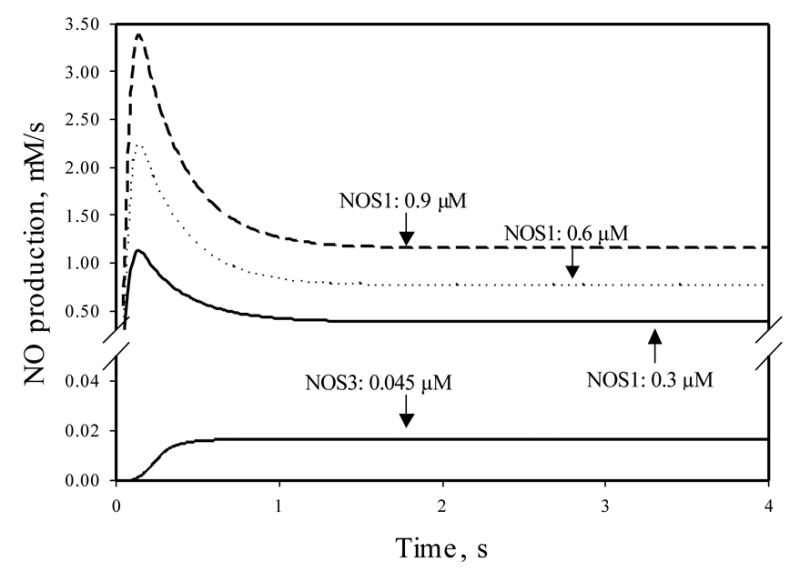
NO production by NOS1, with concentrations ranging from 0.3 to 0.9 μM. The ambient oxygen concentration was 100 μM and the L-arginine concentration was 100 μM. The initial condition was set so that the functioning iron groups of all NOS1 molecules were in the ferric form without binding any ligand. The NO production at the first 4 s after the initial time point is shown. Also shown is the NO production by NOS3 at 0.045 μM. The substrates and initial conditions for NOS3 were the same as those for the NOS1 calculations. All other conditions for the NOS3 catalysis were the same as in [11].
Another difference in the catalytic activity between NOS1 and NOS3 is that the same amount of NOS3 catalyzed significantly less NO than did NOS1. The NO production from the 0.3 μM NOS3 was calculated to be 0.12 μM/s (data not shown) at steady state when the substrate conditions were the same as those in Figure 2, as compared to a value of 0.39 μM/s (69% lower) for 0.3 μM NOS1. Furthermore, this gap becomes larger when the ambient O2 tension was increased due to the fact that the activity of these two NOS isoforms are differentially sensitive to O2, as will be shown below.
We can also see the dependence of NO production on NOS1 concentration when all other conditions were kept unchanged from Fig. 2. When substrates were present in excess, the NO production rate increased linearly with the increase in intracellular NOS1 concentration. This result is consistent with the prediction from enzymology that the enzyme concentration and product formation are linearly related. Thus, higher availability of NOS1 can result in significantly higher NO production.
Unless otherwise indicated, the initial conditions for the simulations shown in the figures were that all NOS1 molecules are in ferric form and do not bind any substrates. Different initial conditions converged to the same steady state, although the transient peak values were not always the same (data not shown).
Sensitivity of NO production to O2 tension
NO production by NOS1 is sensitive to the availability of O2. Figure 3A shows the NO production by NOS1 at O2 levels of 200, 150, 100, 50, 25, and 5 μM (116, 87, 58, 29, 15, 2.9 mmHg). The steady NO production decreased ~20 fold, from 1.81 to 0.08 μM/s, when the O2 tension dropped from 200 to 5 μM. Note that the transient peak value also decreased, but to a lesser extent, from 3.5 to 0.7 μM/s (~5 fold) for the same change in O2 level.
Figure 3.
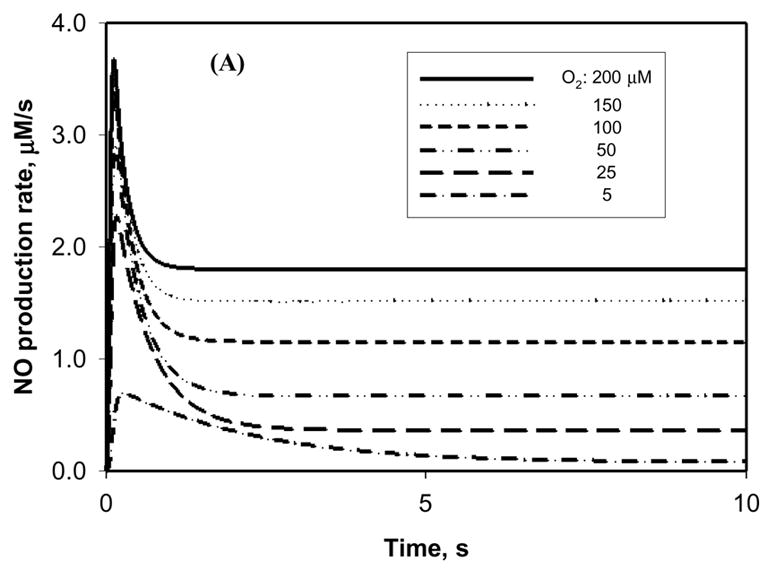
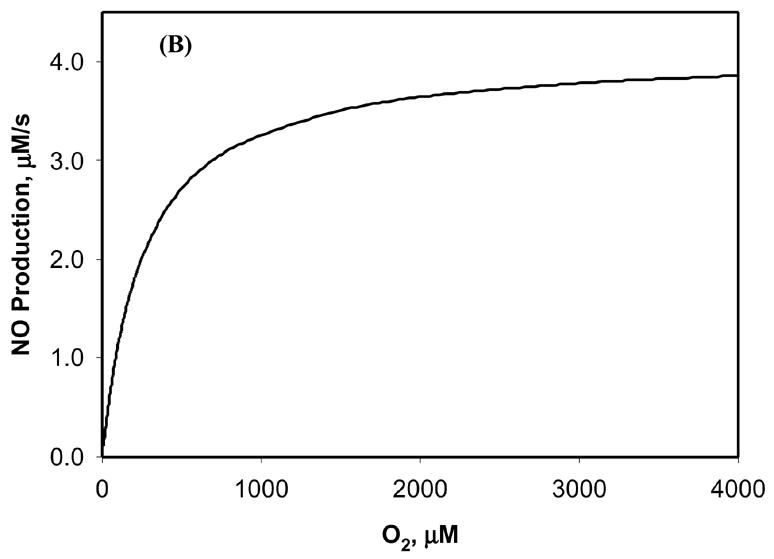
Sensitivity of NO production by NOS to O2 concentration. The concentration of NOS1 was set at 0.9 μM and the concentration of L-arginine was set at 100 μM. (A) The time course of NO production by NOS1 at different ambient O2 concentrations in the physiological range of 5–200 μM. (B) The sensitivity of NO steady-state production by NOS1 to ambient O2 concentrations of up to 4000 μM. The Michaelis constant (Km) of NOS1 for O2 can be estimated from the sensitivity test.
Figure 3B shows how the NO steady-state production by NOS1 changed with different oxygen levels. The NO production increased with higher O2 concentration and reached a plateau when O2 approached 4000 μM. Although the hyperbaric level in Figure 3B (as high as 4000 μM) is not physiological, the results at this level still show how the NO production by NOS1 depends on O2 tension, and the Km of NOS1 for O2 (the O2 concentration that results in half-maximal NO production) can be estimated from Figure 3B. In our calculations, the estimated Km value for O2 was 240–245 μM when the concentration of the other substrate, L-arginine, was varied from 10 to 200 μM. This result is in agreement with the high experimental Km value for NOS1 that has been reported for O2 (260 μM) [26], although an even higher value (350 μM) was also reported [27].
NO distribution around an arteriole without mast cells
Using the model described by Eq. (1)–(9), we predicted the NO concentration around an arteriole. The endothelium containing NOS3 and the nerve fibers containing NOS1 were the NO-producing sources. Figure 4A shows that when the NO production rates corresponding to different possible NOS1 levels (Figure 2) were applied to calculate the NO concentration distribution, the NO concentration in the smooth muscle layer was ~1–4.5 nM. At these calculations, the NOS3 concentration was 0.045 μM and the O2 level around the arteriole was set to 100 μM (58 mmHg). Figure 4B shows the NO distribution around the arteriole when the O2 tension was varied from 5 to 200 μM, a range that covers O2 levels from hypoxia to normoxia. When the O2 level was 200 μM, the NO exposure of smooth muscle was about 6 nM, higher than the concentration required to activate 50% sGC [28], which is in 1–5 nM level (although some other studies have reported higher, or even lower, EC50 values for NO potency [29–31]); when the O2 level was reduced to as low as 5 μM, the NO concentration decreased to 0.3 nM, a value approximately 20-fold lower than that predicted when the O2 concentration was 200 μM. As discussed above, this 0.3 nM NO is probably below the NO concentration necessary to cause vasodilation [28]. Overall, the results showed that the NO distribution in the arteriolar wall had strong oxygen dependence. However, it is interesting to note that this oxygen dependence was not significant in the perivascular region that is further from the vascular wall (> 30 μm; Figure 4B), because of the oxygen-dependent consumption by parenchymal cells.
Figure 4.
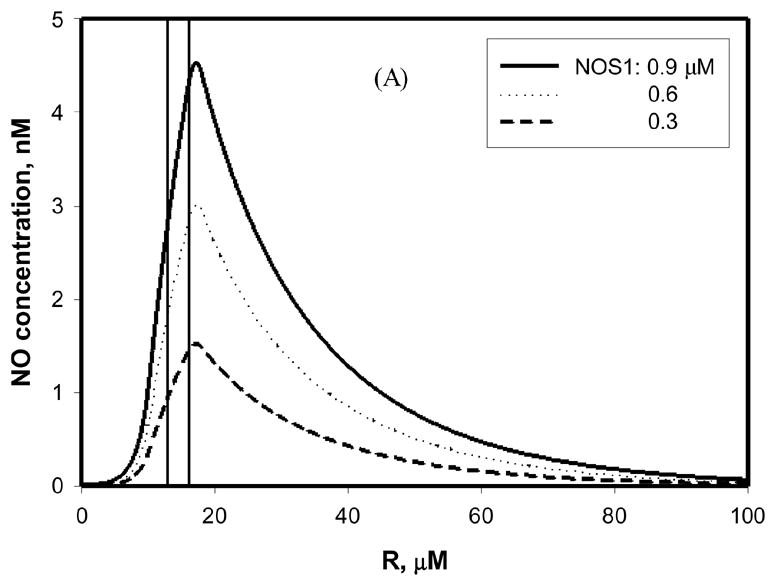

NO concentration around an arteriole in the absence of mast cells. The region marked by vertical lines is the smooth muscle layer. (A) Different levels of NOS1 (0.3–0.9 μM) were present in the nerve fibers adjacent to the vessel wall. The concentration of NOS3 in the endothelium was 0.045 μM. The O2 concentration was 100 μM. (B) The NOS1 level was 0.9 μM, and NOS3 level was 0.045 μM, with the O2 concentration in the range of 5 – 200 μM. The concentration of L-arginine was 100 μM in both (A) and (B). The NO production rates by both NOS1 and NOS3 were those at steady state.
The relative influence of NOS1 and NOS3 on the NO profile
Both NOS1-derived and NOS3-derived NO can diffuse into the smooth muscle cells, where the NO reacts with sGC and induces smooth muscle relaxation. Previous mathematical models [6, 7] have shown that NO derived from perivascular NOS1 has a significantly stronger effect on the NO distribution around an arteriole than NO derived from NOS3. Here we have calculated the relative influence of NOS1 and NOS3 on the NO profile using the NO release rates from the kinetic models without considering the mast cells as NO sources. Our calculations also indicated that, with 20 μM O2, when both NOS1- and NOS3-derived NO were considered, the NO exposure in the middle of smooth muscle was 1.17 nM. In the NOS3-depletion case, this value decreased slightly to 1.16 nM. If the oxygen concentration was higher, given the stronger sensitivity of NOS1 than NOS3 to O2 tension, the contribution of NOS1-derived NO to smooth muscle NO exposure would presumably become more significant. Thus, our calculations predict that NOS1, rather than NOS3, is the major NO source in the microvasculature. These results are determined by the microvascular geometry and the NOS characteristics: the faster catalysis of NOS1 (Figure 2) than NOS3, the more abundant presence of NOS1 than NOS3, and the further location of NOS1 from the lumen, which prevents the scavenging of NO by hemoglobin [4]. However, this result is contradictory to the established conclusion that NOS3 in the endothelium is the NO source that maintains basic homeostasis [1]. These results will be further discussed below.
The effect of the transient peak value of NOS1 catalysis and the sources of mast cells
In addition to its location in the nerve fibers adjacent to the arteriolar wall, NOS1 is also found in the mast cells in the surrounding tissue [4, 9]. The presence of these cells in the nearby tissue should significantly affect the NO concentration in the arteriolar wall and perivascular region. We expanded our model to include the contribution of NOS1 from all specific sources to the NO concentration distribution. A number of mast cells were placed in the perivascular non-perfused tissue layer to mimic the fluorescent and immunohistochemical observations in [4]; these mast cells were modeled as circles with a radius of either 6.0 or 4.5 μm. The concentration of NOS1 in the mast cells was assumed to be the same as that in the nerve fibers; quantitative data on NOS1 expression in mast cells are not available. Figure 5 shows the distribution of NO around an arteriole for different concentrations of ambient O2 when mast cells were also considered as NO sources. With the production rate by NOS1 at steady state, the concentration of NO could be approximately 5 nM NO in the smooth muscle layer, while the perivascular NO concentration was as high as 7 nM when the O2 concentration was 20 μM (Figure 5A). These values were approximately 11 and 18 nM, respectively, when the O2 level was 100 μM (Figure 5B).
Figure 5.

The NO concentration distribution when a non-uniform distribution of mast cells containing NOS1 is also considered. The larger mast cells had a radius of 6 μm, while the smaller cells had a radius of 4.5 μm. The concentration of NOS1 in the mast cells was assumed to be the same as that in the nerve fibers (0.9 μM). In (A) and (B), the NO production by NOS1 at steady state was considered. In (C) and (D), the NO production by NOS1 at the maximum values was considered, resulting in the highest vascular and perivascular NO concentration profiles. The O2 concentrations were 20 μM (A, C) and 100 μM (B, D), respectively.
NOS1 catalysis could have a much higher output for a transient period of time, as shown in Figure 2. Transient release could be facilitated and maintained by external stimuli or variation in the NOS1 cofactors and substrates. The same phenomenon was not observed for NOS3. The peak values of NO production were used to calculate the highest possible NO distribution. As shown in Figure 5C, the concentration of NO in smooth muscle could be as high as 29 nM and 44 nM NO in the perivascular region when the O2 concentration was 20 μM. When the O2 level was increased to 100 μM (Figure 5D), the NO concentrations in the smooth muscle layer and perivascular region were approximately 33 and 51 nM, respectively. These predicted values are still an order of magnitude lower than a number of perivascular NO measurements that have been reported to be several hundred nM of NO [32–34].
Discussion
We have extended our previous model of NOS3 to formulate a kinetic model of NO synthesis pathway to allow us to quantify NO production by various sources containing NOS1 around arterioles. The model also allows explicit analysis of the sensitivity of NO production to O2, a substrate for enzymatic NO formation. We also predicted the NO concentration in the microvasculature using the NO production rates under various O2 conditions. The kinetic model shows that NOS1 has a much stronger O2 dependence than does NOS3 (Figure 3 and [11]). Moreover, NOS1 is predicted to be the major source of NO in the smooth muscle region of the vascular wall, given that in comparison to NOS3, NOS1 is more abundantly distributed around the arteriolar wall, NOS1 catalyzes NO formation more rapidly (Figure 2), and NOS1-derived NO is to a lesser degree scavenged by hemoglobin in the lumen.
To date, there are no reported in vivo experimental measurements of the rate of NO production by the nerve fibers and mast cells containing NOS1, thus we compared our predictions with other experimental measurements. Our model correctly predicts a number of enzymatic behaviors of NOS1 catalytic activities: it predicts the Km values of NOS1 for O2 (Figures 3); moreover, the NO synthesis by NOS1 is linearly related to the concentration of the available enzyme, which is consistent with enzymology theory.
The perivascular NO concentration in our diffusion-reaction models was predicted to be as high as 51 nM (Figure 5) when NOS3 in the endothelium and NOS1 in the nerve fibers and interstitial cells were all considered (Figure 5). This value is similar to the predictions of other NO transport models [8, 20, 35]. Note that these models used a high rate of NO production by the endothelium, estimated by fitting the data [36] for perivascular NO concentrations using a mathematical model [8] with the assumption that NOS3-derived NO from the endothelium was the sole source in the vasculature. Also this predicted NO concentration is sufficient to activate 50% sGC and induce vasodilation, as discussed in Results section. However, the predicted highest NO concentration value (up to 51 nM) from our model is still significantly lower than a number of experimental results. Vukosavljevic et al. [33] reported a ~400 nM perivascular NO concentration in rat mesentery and intestines, while Zani and Bohlen [34] reported a perivascular concentration of more than 500 nM NO in the rat intestinal microvasculature under unstimulated conditions. Also, ~1200 nM perivascular NO was measured in vivo during extreme hemodilution using high-viscosity plasma [32]. It is interesting to note that with the vascular NO concentrations of several hundred nM, smooth muscle would be constantly relaxed if the EC50 values for NO potency are as low as recent reports suggest (at the level of nM) [28]. The discrepancies between our model predictions and the perivascular NO measurements could possibly be explained if a higher NOS1 expression level or other NO sources in the microvasculature were considered. It has been suggested that NOS-independent sources of NO could account for 40% of the basal NO production in arterioles [37]. This leaves open the possibility for NO or NO equivalents preserved in the blood to regulate blood flow. It has been proposed that S-nitrosohemoglobin can release NO upon reduction in local O2 tension [21, 38]. Also, nitrite can serve as an NO reservoir and can be reduced to NO upon hypoxia by intraerythrocytic hemoglobin through allosteric structural transition, resulting in NO-dependent vasodilation [22, 39]. The contribution of these non-enzymatic NO sources to microvascular smooth muscle NO exposure is likely to be indicated by the Km value of guanylate cyclase for NO, which according to recent studies is in the low nM range [28]. Moreover, Kleinbongard et al. [40] discovered the expression of functional NOS3 on the RBC membranes, which is also potentially a source of NO in the arteriole. Other NOS isoforms in the vasculature, such as NOS2 or the putative mitochondrial nitric oxide synthase (mtNOS) [7, 41], could contribute to the perivascular NO concentration.
The sensitivity analysis of parameters for NOS1 synthesis pathway (supplemental materials, Table S1) shows that, when all other parameters were fixed, the change in a single parameter did not significantly influence the NO production, except the parameters of k11, k12, and k13. Large variations (10–100 fold) in these three parameters could increase the NOS1-NO production by 3–4 fold at steady state, to ~4 μM/s. At the same time, the peak output can also be increased by less than 2 fold (data not shown). However, this few fold increase in the NO production by NOS1 still cannot account for the at least an order of magnitude discrepancy between our model predictions and the perivascular NO measurements, as discussed above.
Because NOS1 has a strong O2-dependent behavior and NOS1-derived NO can contribute to the smooth muscle NO exposure significantly more than NOS3-derived NO, the NO concentration profile around an arteriole varies considerably with different levels of O2 tension (Figure 4B); the lower the oxygen level, the lower the NO concentration in the vascular wall and perivascular tissue near the wall. This relationship is consistent with some experimental reports [42]; however, reports of other experiments [43] have indicated that small reductions in perivascular PO2 increase NO release. This apparent discrepancy could be explained by the phenomenon of the peak values of NOS1 catalysis. Small reductions in oxygen tension may alter the existing steady state, shifting the allocations of the intermediate species of NOS1. This shift could cause a transient catalysis of the NO formation by NOS1 at the peak rates, which are higher than the rate at steady state.
One of the conclusions of our study is that NOS1 is the major source of the NO to which the microvascular smooth muscle is exposed. This conclusion appears to contradict the experimental measurements showing that NO catalyzed by NOS3 expressed in the vascular endothelial cells regulates the basal vascular tone [32, 44–46]: hypertension or increased vascular tone has been measured in NOS3 knockout rats [46], and the shear stress-dependent NO production and the subsequent vasodilation of arterioles have also been documented in vivo [32]. The heterogeneous distribution of NOS isoforms may play a role in these phenomena [4, 47]. The effect of mechanotransduction on the vascular and perivascular NO production may also be heterogeneous since recent experiments on different hierarchies of blood vessels showed that, whereas the vascular tone and NO production are regulated by the shear stress exerted on the endothelium of the larger proximal arterioles, the NO production around distal precapillary arterioles are independent of the shear stress [48–50]. Thus, we suggest caution in interpretation of the calculated contributions of different NOS isoforms to vasodilation before a clearer experimental mapping of the heterogeneous NO specific sources in the vascular and perivascular regions is available.
There is evidence that microvascular tone can be regulated through an endocrine effect produced by NO released from circulating blood proteins upon oxygen sensing [21, 22, 39, 51]. An increase in metabolic activity, such as exercise, consumes a large amount of oxygen, and leads to a decrease in the tissue PO2. The change in oxygen level results in vasodilation, which increases the blood flow and ensures the delivery of the adequate oxygen to match the tissue’s metabolic requirements. Moreover, the transport of oxygen and NO can be coupled and influence each other [52]. With regard to the endocrine vasodilation induced by NO during hypoxia, one of the questions that remains to be elucidated is how the vasculature senses oxygen. It is reasonable to postulate that the paracrine regulation of vascular tone by NOS-derived NO is significantly attenuated under conditions of low oxygen tension, such that the NO from RBCs becomes an important source of NO. The NO that is locally produced by NOS3 has been thought to act as a paracrine source to regulate the vascular tone; however, the Km value of NOS3 for oxygen has been reported as ~7 μM [53], a level much lower than the oxygen concentration in the precapillary arterioles [54]. Thus, there is an apparent contradiction between endocrine NO acting as the major vascular relaxing factor under conditions of hypoxia and the low sensitivity of NOS3 to the change in oxygen concentration. However, based on the predictions by our model, a significant reduction in enzymatic NO release is expected when the oxygen tension falls.
In conclusion, using our kinetic models of NO production by NOS1 and NOS3 and diffusion-reaction model of NO transport in the microvasculature, we have analyzed the intrinsic differences between two NOS isoforms (NOS1 and NOS3), which involve the dependence on ambient O2 levels, the different catalytic activities of the two constitutive enzymes and the existence of a transient burst of NO formation catalysis. We have also predicted the NO concentration around an arteriole for different concentrations of oxygen. Our predicted NO concentrations of NO in the smooth muscle were consistent with the amounts necessary for the activation of cGMP but were significantly smaller than a number of experimental values for peri-arteriolar NO. Other sources, such RBC-released NO, may explain this apparent discrepancy. Moreover, future experiments featuring high specificity in real-time NO detection, such as membrane-permeable fluorescent probes (e.g. 4,5-diaminofluorescein diacetate) with calibrated signal and the use of selective NOS inhibitors, would be useful to test our theoretical predictions.
Supplementary Material
Acknowledgments
The authors thank Dr. Mahendra Kavdia for helpful discussions and technical advice, and Dr. Roland N. Pittman, Dr. Aleksander S. Golub, and Dr. Dan E. Berkowitz for useful comments. This research was supported by NIH grants RO1 HL018292 and RO1 HL079087.
Appendix
A set of coupled ordinary differential equations are listed below to describe the change in species concentration with time, as illustrated in Figure 1. The equations are conceptually similar to those formulated earlier [12], but they are extended to the binding kinetics of L-arginine and O2 under physiological conditions, in order to quantify NO production catalyzed by NOS1. The iron heme group represents NOS1 in different states, Arg indicates L-arginine, and [Fe·Arg] and [Fe·NOHA] indicate the species generated when NOS1 is bound to Arg or NOHA, respectively. The changes in L-arginine and O2 are not included in the equations because these species can be quickly replenished from large reservoirs once some are consumed.
Governing equations
| (1) |
| (2) |
| (3) |
| (4) |
| (5) |
| (6) |
| (7) |
| (8) |
| (9) |
| (10) |
| (11) |
| (12) |
| (13) |
| (14) |
Footnotes
Publisher's Disclaimer: This is a PDF file of an unedited manuscript that has been accepted for publication. As a service to our customers we are providing this early version of the manuscript. The manuscript will undergo copyediting, typesetting, and review of the resulting proof before it is published in its final citable form. Please note that during the production process errors may be discovered which could affect the content, and all legal disclaimers that apply to the journal pertain.
References
- 1.Alderton WK, Cooper CE, Knowles RG. Nitric oxide synthases: structure, function and inhibition. Biochem J. 2001;357:593–615. doi: 10.1042/0264-6021:3570593. [DOI] [PMC free article] [PubMed] [Google Scholar]
- 2.Lancaster JR., Jr Simulation of the diffusion and reaction of endogenously produced nitric oxide. Proc Natl Acad Sci U S A. 1994;91:8137–8141. doi: 10.1073/pnas.91.17.8137. [DOI] [PMC free article] [PubMed] [Google Scholar]
- 3.Huang A, Sun D, Shesely EG, Levee EM, Koller A, Kaley G. Neuronal NOS-dependent dilation to flow in coronary arteries of male eNOS-KO mice. Am J Physiol Heart Circ Physiol. 2002;282:H429–436. doi: 10.1152/ajpheart.00501.2001. [DOI] [PubMed] [Google Scholar]
- 4.Kashiwagi S, Kajimura M, Yoshimura Y, Suematsu M. Nonendothelial source of nitric oxide in arterioles but not in venules: alternative source revealed in vivo by diaminofluorescein microfluorography. Circ Res. 2002;91:e55–64. doi: 10.1161/01.res.0000047529.26278.4d. [DOI] [PubMed] [Google Scholar]
- 5.Talukder MA, Fujiki T, Morikawa K, Motoishi M, Kubota H, Morishita T, Tsutsui M, Takeshita A, Shimokawa H. Up-regulated neuronal nitric oxide synthase compensates coronary flow response to bradykinin in endothelial nitric oxide synthase-deficient mice. J Cardiovasc Pharmacol. 2004;44:437–445. doi: 10.1097/01.fjc.0000139450.64337.cd. [DOI] [PubMed] [Google Scholar]
- 6.Kavdia M, Popel AS. Contribution of nNOS- and eNOS-derived NO to microvascular smooth muscle NO exposure. J Appl Physiol. 2004;97:293–301. doi: 10.1152/japplphysiol.00049.2004. [DOI] [PubMed] [Google Scholar]
- 7.Lamkin-Kennard KA, Buerk DG, Jaron D. Interactions between NO and O2 in the microcirculation: a mathematical analysis. Microvasc Res. 2004;68:38–50. doi: 10.1016/j.mvr.2004.03.001. [DOI] [PubMed] [Google Scholar]
- 8.Vaughn MW, Kuo L, Liao JC. Estimation of nitric oxide production and reaction rates in tissue by use of a mathematical model. Am J Physiol. 1998;274:H2163–2176. doi: 10.1152/ajpheart.1998.274.6.H2163. [DOI] [PubMed] [Google Scholar]
- 9.Bidri M, Feger F, Varadaradjalou S, Ben Hamouda N, Guillosson JJ, Arock M. Mast cells as a source and target for nitric oxide. Int Immunopharmacol. 2001;1:1543–1558. doi: 10.1016/s1567-5769(01)00097-2. [DOI] [PubMed] [Google Scholar]
- 10.Brown LA, Key BJ, Lovick TA. Fluorescent imaging of nitric oxide production in neuronal varicosities associated with intraparenchymal arterioles in rat hippocampal slices. Neurosci Lett. 2000;294:9–12. doi: 10.1016/s0304-3940(00)01521-4. [DOI] [PubMed] [Google Scholar]
- 11.Chen K, Popel AS. Theoretical analysis of biochemical pathways of nitric oxide release from vascular endothelial cells. Free Radic Biol Med. 2006;41:668 – 680. doi: 10.1016/j.freeradbiomed.2006.05.009. [DOI] [PubMed] [Google Scholar]
- 12.Santolini J, Adak S, Curran CM, Stuehr DJ. A kinetic simulation model that describes catalysis and regulation in nitric-oxide synthase. J Biol Chem. 2001;276:1233–1243. doi: 10.1074/jbc.M006858200. [DOI] [PubMed] [Google Scholar]
- 13.Santolini J, Meade AL, Stuehr DJ. Differences in three kinetic parameters underpin the unique catalytic profiles of nitric-oxide synthases I, II, and III. J Biol Chem. 2001;276:48887–48898. doi: 10.1074/jbc.M108666200. [DOI] [PubMed] [Google Scholar]
- 14.Gorren AC, Schmidt K, Mayer B. Binding of L-arginine and imidazole suggests heterogeneity of rat brain neuronal nitric oxide synthase. Biochemistry. 2002;41:7819–7829. doi: 10.1021/bi025675o. [DOI] [PubMed] [Google Scholar]
- 15.Ost TW, Daff S. Thermodynamic and kinetic analysis of the nitrosyl, carbonyl, and dioxy heme complexes of neuronal nitric-oxide synthase. The roles of substrate and tetrahydrobiopterin in oxygen activation. J Biol Chem. 2005;280:965–973. doi: 10.1074/jbc.M411191200. [DOI] [PubMed] [Google Scholar]
- 16.Wehling M, Stull JT, McCabe TJ, Tidball JG. Sparing of mdx extraocular muscles from dystrophic pathology is not attributable to normalized concentration or distribution of neuronal nitric oxide synthase. Neuromuscul Disord. 1998;8:22–29. doi: 10.1016/s0960-8966(97)00136-3. [DOI] [PubMed] [Google Scholar]
- 17.Arnal JF, Clamens S, Pechet C, Negre-Salvayre A, Allera C, Girolami JP, Salvayre R, Bayard F. Ethinylestradiol does not enhance the expression of nitric oxide synthase in bovine endothelial cells but increases the release of bioactive nitric oxide by inhibiting superoxide anion production. Proc Natl Acad Sci U S A. 1996;93:4108–4113. doi: 10.1073/pnas.93.9.4108. [DOI] [PMC free article] [PubMed] [Google Scholar]
- 18.Wu G, Morris SM., Jr Arginine metabolism: nitric oxide and beyond. Biochem J. 1998;336( Pt 1):1–17. doi: 10.1042/bj3360001. [DOI] [PMC free article] [PubMed] [Google Scholar]
- 19.Schulman ES, Kagey-Sobotka A, MacGlashan DW, Jr, Adkinson NF, Jr, Peters SP, Schleimer RP, Lichtenstein LM. Heterogeneity of human mast cells. J Immunol. 1983;131:1936–1941. [PubMed] [Google Scholar]
- 20.Kavdia M, Popel AS. Wall shear stress differentially affects NO level in arterioles for volume expanders and Hb-based O2 carriers. Microvasc Res. 2003;66:49–58. doi: 10.1016/s0026-2862(03)00008-6. [DOI] [PubMed] [Google Scholar]
- 21.Singel DJ, Stamler JS. Blood traffic control. Nature. 2004;430:297. doi: 10.1038/430297a. [DOI] [PubMed] [Google Scholar]
- 22.Gladwin MT, Schechter AN, Kim-Shapiro DB, Patel RP, Hogg N, Shiva S, Cannon RO, Kelm M, 3rd, Wink DA, Espey MG, Oldfield EH, Pluta RM, Freeman BA, Lancaster JR, Feelisch M, Jr, Lundberg JO. The emerging biology of the nitrite anion. Nat Chem Biol. 2005;1:308–314. doi: 10.1038/nchembio1105-308. [DOI] [PubMed] [Google Scholar]
- 23.Lewis RS, Deen WM. Kinetics of the reaction of nitric oxide with oxygen in aqueous solutions. Chem Res Toxicol. 1994;7:568–574. doi: 10.1021/tx00040a013. [DOI] [PubMed] [Google Scholar]
- 24.Thomas DD, Liu X, Kantrow SP, Lancaster JR., Jr The biological lifetime of nitric oxide: implications for the perivascular dynamics of NO and O2. Proc Natl Acad Sci U S A. 2001;98:355–360. doi: 10.1073/pnas.011379598. [DOI] [PMC free article] [PubMed] [Google Scholar]
- 25.Gardner PR, Martin LA, Hall D, Gardner AM. Dioxygen-dependent metabolism of nitric oxide in mammalian cells. Free Radic Biol Med. 2001;31:191–204. doi: 10.1016/s0891-5849(01)00569-x. [DOI] [PubMed] [Google Scholar]
- 26.Elayan IM, Axley MJ, Prasad PV, Ahlers ST, Auker CR. Effect of hyperbaric oxygen treatment on nitric oxide and oxygen free radicals in rat brain. J Neurophysiol. 2000;83:2022–2029. doi: 10.1152/jn.2000.83.4.2022. [DOI] [PubMed] [Google Scholar]
- 27.Stuehr DJ, Santolini J, Wang ZQ, Wei CC, Adak S. Update on mechanism and catalytic regulation in the NO synthases. J Biol Chem. 2004;279:36167–36170. doi: 10.1074/jbc.R400017200. [DOI] [PubMed] [Google Scholar]
- 28.Gladwin MT. Hemoglobin as a nitrite reductase regulating red cell-dependent hypoxic vasodilation. Am J Respir Cell Mol Biol. 2005;32:363–366. doi: 10.1165/rcmb.f294. [DOI] [PubMed] [Google Scholar]
- 29.Condorelli P, George SC. In vivo control of soluble guanylate cyclase activation by nitric oxide: a kinetic analysis. Biophys J. 2001;80:2110–2119. doi: 10.1016/S0006-3495(01)76184-X. [DOI] [PMC free article] [PubMed] [Google Scholar]
- 30.Kollau A, Hofer A, Russwurm M, Koesling D, Keung WM, Schmidt K, Brunner F, Mayer B. Contribution of aldehyde dehydrogenase to mitochondrial bioactivation of nitroglycerin: evidence for the activation of purified soluble guanylate cyclase through direct formation of nitric oxide. Biochem J. 2005;385:769–777. doi: 10.1042/BJ20041354. [DOI] [PMC free article] [PubMed] [Google Scholar]
- 31.Stone JR, Marletta MA. Spectral and kinetic studies on the activation of soluble guanylate cyclase by nitric oxide. Biochemistry. 1996;35:1093–1099. doi: 10.1021/bi9519718. [DOI] [PubMed] [Google Scholar]
- 32.Tsai AG, Acero C, Nance PR, Cabrales P, Frangos JA, Buerk DG, Intaglietta M. Elevated plasma viscosity in extreme hemodilution increases perivascular nitric oxide concentration and microvascular perfusion. Am J Physiol Heart Circ Physiol. 2005;288:H1730–1739. doi: 10.1152/ajpheart.00998.2004. [DOI] [PubMed] [Google Scholar]
- 33.Vukosavljevic N, Jaron D, Barbee KA, Buerk DG. Quantifying the L-arginine paradox in vivo. Microvasc Res. 2006;71:48–54. doi: 10.1016/j.mvr.2005.10.006. [DOI] [PubMed] [Google Scholar]
- 34.Zani BG, Bohlen HG. Transport of extracellular l-arginine via cationic amino acid transporter is required during in vivo endothelial nitric oxide production. Am J Physiol Heart Circ Physiol. 2005;289:H1381–1390. doi: 10.1152/ajpheart.01231.2004. [DOI] [PubMed] [Google Scholar]
- 35.Buerk DG, Lamkin-Kennard K, Jaron D. Modeling the influence of superoxide dismutase on superoxide and nitric oxide interactions, including reversible inhibition of oxygen consumption. Free Radic Biol Med. 2003;34:1488–1503. doi: 10.1016/s0891-5849(03)00178-3. [DOI] [PubMed] [Google Scholar]
- 36.Malinski T, Taha Z, Grunfeld S, Patton S, Kapturczak M, Tomboulian P. Diffusion of nitric oxide in the aorta wall monitored in situ by porphyrinic microsensors. Biochem Biophys Res Commun. 1993;193:1076–1082. doi: 10.1006/bbrc.1993.1735. [DOI] [PubMed] [Google Scholar]
- 37.Suematsu M, Suganuma K, Kashiwagi S. Mechanistic probing of gaseous signal transduction in microcirculation. Antioxid Redox Signal. 2003;5:485–492. doi: 10.1089/152308603768295230. [DOI] [PubMed] [Google Scholar]
- 38.Allen BW, Piantadosi CA. How do red blood cells cause hypoxic vasodilation? The SNO-hemoglobin paradigm. Am J Physiol Heart Circ Physiol. 2006;291:H1507–1512. doi: 10.1152/ajpheart.00310.2006. [DOI] [PubMed] [Google Scholar]
- 39.Robinson JM, Lancaster JR., Jr Hemoglobin-mediated, hypoxia-induced vasodilation via nitric oxide: mechanism(s) and physiologic versus pathophysiologic relevance. Am J Respir Cell Mol Biol. 2005;32:257–261. doi: 10.1165/rcmb.F292. [DOI] [PubMed] [Google Scholar]
- 40.Kleinbongard P, Schulz R, Rassaf T, Lauer T, Dejam A, Jax T, Kumara I, Gharini P, Kabanova S, Ozuyaman B, Schnurch HG, Godecke A, Weber AA, Robenek M, Robenek H, Bloch W, Rosen P, Kelm M. Red blood cells express a functional endothelial nitric oxide synthase. Blood. 2006;107:2943–2951. doi: 10.1182/blood-2005-10-3992. [DOI] [PubMed] [Google Scholar]
- 41.Lacza Z, Snipes JA, Zhang J, Horvath EM, Figueroa JP, Szabo C, Busija DW. Mitochondrial nitric oxide synthase is not eNOS, nNOS or iNOS. Free Radic Biol Med. 2003;35:1217–1228. doi: 10.1016/s0891-5849(03)00510-0. [DOI] [PubMed] [Google Scholar]
- 42.Thom SR, Buerk DG. Nitric oxide synthesis in brain is stimulated by oxygen. Adv Exp Med Biol. 2003;510:133–137. doi: 10.1007/978-1-4615-0205-0_22. [DOI] [PubMed] [Google Scholar]
- 43.Nase GP, Tuttle J, Bohlen HG. Reduced perivascular PO2 increases nitric oxide release from endothelial cells. Am J Physiol Heart Circ Physiol. 2003;285:H507–515. doi: 10.1152/ajpheart.00759.2002. [DOI] [PubMed] [Google Scholar]
- 44.Chu A, Chambers DE, Lin CC, Kuehl WD, Palmer RM, Moncada S, Cobb FR. Effects of inhibition of nitric oxide formation on basal vasomotion and endothelium-dependent responses of the coronary arteries in awake dogs. J Clin Invest. 1991;87:1964–1968. doi: 10.1172/JCI115223. [DOI] [PMC free article] [PubMed] [Google Scholar]
- 45.Rees DD, Palmer RM, Hodson HF, Moncada S. A specific inhibitor of nitric oxide formation from L-arginine attenuates endothelium-dependent relaxation. Br J Pharmacol. 1989;96:418–424. doi: 10.1111/j.1476-5381.1989.tb11833.x. [DOI] [PMC free article] [PubMed] [Google Scholar]
- 46.Panza JA, Casino PR, Kilcoyne CM, Quyyumi AA. Role of endothelium-derived nitric oxide in the abnormal endothelium-dependent vascular relaxation of patients with essential hypertension. Circulation. 1993;87:1468–1474. doi: 10.1161/01.cir.87.5.1468. [DOI] [PubMed] [Google Scholar]
- 47.Kimura C, Oike M, Ohnaka K, Nose Y, Ito Y. Constitutive nitric oxide production in bovine aortic and brain microvascular endothelial cells: a comparative study. J Physiol. 2004;554:721–730. doi: 10.1113/jphysiol.2003.057059. [DOI] [PMC free article] [PubMed] [Google Scholar]
- 48.de Wit C, Jahrbeck B, Schafer C, Bolz SS, Pohl U. Nitric oxide opposes myogenic pressure responses predominantly in large arterioles in vivo. Hypertension. 1998;31:787–794. doi: 10.1161/01.hyp.31.3.787. [DOI] [PubMed] [Google Scholar]
- 49.Kim MH, Harris NR, Korzick DH, Tarbell JM. Control of the arteriolar myogenic response by transvascular fluid filtration. Microvasc Res. 2004;68:30–37. doi: 10.1016/j.mvr.2004.03.002. [DOI] [PubMed] [Google Scholar]
- 50.Nellore K, Harris NR. Nitric oxide measurements in rat mesentery reveal disrupted venulo-arteriolar communication in diabetes. Microcirculation. 2004;11:415–423. doi: 10.1080/10739680490457809. [DOI] [PubMed] [Google Scholar]
- 51.Stamler JS, Jaraki O, Osborne J, Simon DI, Keaney J, Vita J, Singel D, Valeri CR, Loscalzo J. Nitric oxide circulates in mammalian plasma primarily as an S-nitroso adduct of serum albumin. Proc Natl Acad Sci U S A. 1992;89:7674–7677. doi: 10.1073/pnas.89.16.7674. [DOI] [PMC free article] [PubMed] [Google Scholar]
- 52.Chen X, Jaron D, Barbee KA, Buerk DG. The influence of radial RBC distribution, blood velocity profiles, and glycocalyx on coupled NO/O2 transport. J Appl Physiol. 2006;100:482–492. doi: 10.1152/japplphysiol.00633.2005. [DOI] [PubMed] [Google Scholar]
- 53.Rengasamy A, Johns RA. Determination of Km for oxygen of nitric oxide synthase isoforms. J Pharmacol Exp Ther. 1996;276:30–33. [PubMed] [Google Scholar]
- 54.Tsai AG, Cabrales P, Hangai-Hoger N, Intaglietta M. Oxygen distribution and respiration by the microcirculation. Antioxid Redox Signal. 2004;6:1011–1018. doi: 10.1089/ars.2004.6.1011. [DOI] [PubMed] [Google Scholar]
- 55.Mansuy D, Boucher JL. Alternative nitric oxide-producing substrates for NO synthases. Free Radic Biol Med. 2004;37:1105–1121. doi: 10.1016/j.freeradbiomed.2004.06.031. [DOI] [PubMed] [Google Scholar]
Associated Data
This section collects any data citations, data availability statements, or supplementary materials included in this article.