Abstract
Several lines of investigation suggest that the hypothalamic neuropeptide melanin-concentrating hormone (MCH) regulates body weight in mammals. Obese mice lacking functional leptin overexpress the MCH message in the fed or fasted state. Acute intracerebroventricular injection of MCH increases energy intake in rats. Mice lacking the MCH gene are lean. To test the hypothesis that chronic overexpression of MCH in mice causes obesity, we produced transgenic mice that overexpress MCH (MCH-OE) in the lateral hypothalamus at approximately twofold higher levels than normal mice. On the FVB genetic background, homozygous transgenic animals fed a high-fat diet ate 10% more and were 12% heavier at 13 weeks of age than wild-type animals, and they had higher systemic leptin levels. Blood glucose levels were higher both preprandially and after an intraperitoneal glucose injection. MCH-OE animals were insulin-resistant, as demonstrated by markedly higher plasma insulin levels and a blunted response to insulin; MCH-OE animals had only a 5% decrease in blood glucose after insulin administration, compared with a 31% decrease in wild-type animals. MCH-OE animals also exhibited a twofold increase in islet size. To evaluate the contribution of genetic background to the predisposition to obesity seen in MCH-OE mice, the transgene was bred onto the C57BL/6J background. Heterozygote C57BL/6J mice expressing the transgene showed increased body weight on a standard diet, confirming that MCH overexpression can lead to obesity.
Introduction
In mammals obesity results when caloric intake exceeds energy use (1). Information on the pathways regulating both feeding and energy expenditure has expanded remarkably in the past several years, and a number of novel hypothalamic peptides that either stimulate or inhibit feeding have been described (1). Among these peptides, melanin-concentrating hormone (MCH) is known to play an important role in feeding behavior (2–4). In the brain, MCH expression is limited to the lateral hypothalamus (5) and responds to nutritional signals, including fasting and leptin deficiency (3). Thus, expression is increased with fasting and is also markedly increased in the Lepob/Lepob mouse, which lacks leptin (3). When administered intracerebroventricularly (ICV), MCH leads to a rapid increase in feeding in rats (3, 4). Importantly, MCH ablation in mice leads to a syndrome of leanness associated with hypophagia and a relative increase in oxygen consumption (6).
The lean phenotype of MCH-ablated mice is of particular interest (6), in that genetic ablation of neuropeptide-Y (NPY), another appetite-stimulating neuropeptide (7, 8), does not affect body weight (9) unless combined with other obesity genes (10). Indeed, MCH is thus far the only known hypothalamic peptide whose ablation results in leanness. This is in contrast to the number of peptides whose mutation or ablation leads to obesity. These peptides include leptin and the melanocortin-4 receptors (11), proopiomelanocortin (POMC) (12), and the serotonin IIC receptor (13).
As MCH is a significant regulator of body weight whose absence leads to decreased percentage of body adiposity, we examined the possibility that overexpression of MCH eutopically in the lateral hypothalamus might lead to a syndrome of obesity. To examine this question we generated a line of transgenic animals overexpressing MCH (MCH-OE) in the lateral hypothalamus. On the original FVB background, mice were not obese on a standard diet. However, they became obese when the gene was bred to homozygosity and the animals were fed a high-fat diet. MCH-OE animals were hyperphagic, hyperleptinemic, and had higher blood glucose levels. Animals were also significantly hyperinsulinemic and failed to respond to an insulin challenge. We also found that pancreatic islets showed considerable hypertrophy. Finally, when animals were back-bred to an “obesity-prone” genetic background, the C57BL/6J black (14), heterozygous transgenic overexpressers were spontaneously obese on a low-fat diet.
These data further support the significance of MCH as a peptide important in the regulation of feeding behavior. The study also demonstrates that significant insulin resistance may be seen in the context of mild obesity produced by MCH overexpression. In addition, it emphasizes the importance of genetic background in the development of the obese phenotype produced by altered expression of a hypothalamic neuropeptide.
Methods
Generation of transgenic mice.
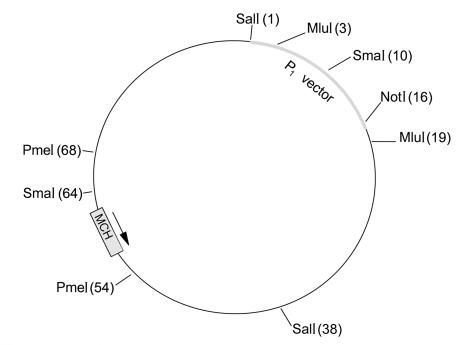
Transgenic mice were produced on the FVB background, using a 70-kb DNA construct obtained from a murine P1 clone in the hope that the native regulatory elements present in this large construct would result in overexpression of the MCH transgene in a physiologically relevant manner. Using the published DNA sequence of the murine MCH gene (15, 16), we synthesized two oligonucleotide primers designed to yield a PCR fragment about 250-bp long: 5′-TTAATGCTGGCTTTTTCTTTGTTT-3′, 5′-ACCGCTCTCGTCGTTTTTGTA-3′. A mouse C129 P1 genomic library (Genome Systems Inc., St. Louis, Missouri, USA) was screened with this PCR product, and three clones were obtained, each approximately 100 kb in length. The identity of these clones was confirmed by limited direct DNA sequencing. One P1 clone of about 88 kb was mapped by restriction analysis employing pulse-field electrophoresis and Southern blotting (Figure 1). A 70-kb DNA construct (containing about 4 kb P1 vector sequence to facilitate detection of transgenic animals) was released from the P1 clone by MluI digestion. After purification by agarose gel electrophoresis and dialysis, the construct was injected into the pronucleus of fertilized oocytes from FVB mice, and the oocytes were implanted into pseudopregnant females. Transgenic mice were detected by Southern blot analysis (17) of genomic DNA purified from tails and then digested with PstI (Figure 1). The blots were hybridized with a 32P-labeled 1.7-kb probe produced by SpeI digestion of the P1 vector, followed by gel purification. The identification of the hybridization signal indicated the presence of unique transgene vector sequences in the genomic DNA. The copy number was determined by comparing DNA-band strength on gel electrophoresis between transgenic and control animals, using variable amounts of genomic DNA.
Figure 1.
Restriction analysis map of the MCH-containing P1 clone used in the generation of the MCH transgene. The position of restriction sites is shown as number of kilobases of DNA (in parentheses).
A homozygous line was identified among the offspring of two heterozygous parents by finding exclusively heterozygous progeny from the mating of an F1 offspring mouse with a wild-type mouse.
To generate transgenic mice on the obesity-susceptible C57BL/6J background (14), FVB MCH-OE heterozygote mice were backcrossed to C57BL/6J mice for seven generations. The F7 generation was then examined.
All experiments were approved by the Institutional Animal Care and Use Committee of the Beth Israel Deaconess Medical Center and the Joslin Diabetes Center, Boston, Massachusetts, USA.
Animal care.
All studies involved male animals, housed singly, and maintained under a standard 12-hour light cycle at 20°C. Mice used for some studies of body weight were fed standard mouse chow (F6 rodent diet, 8664) containing 6% of total energy as fat (Harlan Teklad, Madison, Wisconsin, USA); all other animals were fed a high-fat diet (D12451) containing 45% of total energy as fat (Research Diets Inc., New Brunswick, New Jersey, USA) beginning at age 5 weeks. Mice were weighed to the nearest 0.1 g on an electronic scale (Sartorius AG, Gottingen, Germany).
Northern blot analysis.
Hypothalamic RNA (20 μg per lane) was used for Northern analysis as described previously (3). Briefly, RNA samples were electrophoresed in a 1.2% agarose gel, transferred to a nylon membrane overnight, and probed with a riboprobe generated by in vitro transcription using a commercially available kit (Promega Corp., Madison, Wisconsin, USA) and the appropriate DNA templates, as described previously (3). Blots were prehybridized at 58°C for 4 hours, hybridized at 58°C overnight, and washed twice in 2 × SSC, 0.1% SDS (room temperature), and once in 0.1 × SSC, 0.1% SDS for 10 minutes (60°C), as described in our previous protocol (3). Air-dried blots were exposed to Kodak X-OMAT film (Eastman Kodak, Rochester, New York, USA) for 48 hours and quantitated using a Molecular Dynamics (Sunnyvale, California, USA) densitometer.
In situ hybridization histochemistry.
Animals were anesthetized with sodium pentobarbital (90 mg/kg intraperitoneally) and perfused with 25 ml of saline and 60 ml of 10% neutral buffered formalin (Accustain; Sigma Chemical Co., St. Louis, Missouri, USA). Brains were removed and postfixed for 4 hours in 10% formalin and cryoprotected in 20% sucrose in diethylpyrocarbonate-treated (DEPC-treated) PBS for at least 24 hours. Thirty-micrometer coronal sections of dry ice–frozen brains were obtained using a sliding microtome (AO Instrument Co., Buffalo, New York, USA). In situ hybridization histochemistry was performed as described previously (18). Briefly, brain slices were mounted, postfixed, acetylated, ethanol dehydrated, and stored at –20°C until hybridization. Antisense riboprobes were generated using an in vitro transcription kit (Promega Corp.) as described previously (18). Sections were hybridized with the appropriate riboprobe in hybridization buffer according to a protocol used previously (18) at 57°C in an air oven for 18 hours. Subsequently, tissue sections were RNAase A–treated, washed, ethanol dehydrated, air dried, and exposed to Biomax MR film (Eastman Kodak) for 24–48 hours as described previously (18).
The absorbance of the autoradiographic images was measured with a computing densitometer (Molecular Dynamics) and the ImageQuant software (Molecular Dynamics), employing our technique used previously (18). Densitometry data were plotted in percentage of relative density units, with the highest absorbance in each figure set arbitrarily at 100%.
Immunohistochemistry.
Animals were anesthetized with sodium pentobarbital (90 mg/kg intraperitoneally) and perfused with 25 ml of saline and 60 ml of 10% neutral buffered formalin (Accustain; Sigma Chemical Co.). Brains were removed and postfixed for 4 hours in 10% formalin and cryoprotected in 20% sucrose in DEPC-treated PBS for at least 24 hours. Thirty-micrometer coronal sections of dry ice–frozen brains were obtained using a sliding microtome (AO Instrument Co.). Sections were subsequently rinsed twice with PBS for 10 minutes each, treated with 0.3% hydrogen peroxide in PBS and 0.25% Triton X-100 (Sigma Chemical Co.) for 30 minutes, rinsed three times with PBS for 10 minutes each, and treated with blocking solution (3% normal goat serum in PBS, 0.25% Triton X-100, and 0.02% sodium azide) for 2 hours at room temperature. Sections were incubated subsequently with a rabbit anti-mouse MCH Ab (1:2,000) in PBS, 3% normal goat serum, 0.25% Triton X-100, and 0.02% sodium azide at room temperature overnight. The next morning, sections were rinsed with PBS six times for 10 minutes each and incubated with a secondary goat anti-rabbit Ab (1:500) (Jackson Immunoresearch Laboratories Inc., West Grove, Pennsylvania, USA) in PBS, 0.25% Triton X-100, and 3% normal goat serum for 2 hours. Sections were subsequently rinsed with PBS three times for 10 minutes each, and incubated with ABC (1:500) (Vector Laboratories, Burlingame, California, USA) for 1 hour at room temperature. Sections were subsequently rinsed twice with PBS for 10 minutes each and treated with diaminobenzidine (1:100) (Sigma Chemical Co.) in PBS with 30% hydrogen peroxide for 10 minutes, rinsed twice with PBS for 10 minutes each and mounted on slides, dehydrated in serial ethanol solutions, cleared with xylene (Sigma Chemical Co.), and coverslipped.
Carcass analysis.
Mouse carcass analysis was performed according to the method of Salmon and Flatt (19). Briefly, carcasses were digested in 40 ml of alcoholic KOH (10% KOH in ethanol) at 60°C. Subsequently, MgCl2 was added to 500-μl aliquots from the carcass digests to a final concentration of 0.5 M. The samples were placed on ice for 10 minutes, spun for 10 minutes in an Eppendorf microcentrifuge, and the supernatants were used in a triglyceride assay, using the GPO-Trinder reagent and triglyceride standards (Sigma Chemical Co.). Triglyceride concentrations were estimated by measuring sample absorbance at 540 nm, in comparison with absorbance values of the known standards, using a Perkin-Elmer spectrophotometer (Perkin-Elmer Corp., Norwalk, Connecticut, USA). Linear curve fitting and estimation of unknown triglyceride concentrations were done using the CurveExpert 1.34 software.
Blood glucose and hormone measurements.
Blood samples were obtained by tail bleed and analyzed for glucose concentration immediately using a glucometer (Lifescan, Milpitas, California, USA). Alternatively, samples were centrifuged within 2 hours and stored as plasma or serum at –20°C until assay. Insulin and leptin concentrations were determined by 125I radioimmunoassay kits (Linco Research Inc., Saint Louis, Missouri, USA).
Glucose-tolerance test.
Animals were tested in the morning, after a 15-hour fast. Blood glucose was measured on samples obtained by tail bleeding before the intraperitoneal injection of glucose (2 g/kg), as well as at 15, 30, 60, and 120 minutes after glucose administration.
Insulin-tolerance test.
Fed mice were injected with regular insulin (1 unit/kg; Eli Lilly and Co., Indianapolis, Indiana, USA) at time zero, and tail-blood samples were obtained before insulin administration (time-zero sample), as well as at 15, 30, and 60 minutes after the insulin injection.
Morphological analysis of pancreas.
Pancreata were rapidly dissected, weighed, fixed in 10% buffered formalin for 48 hours, and then placed in PBS, pH 7.4. Paraffin-embedded pancreata were sectioned and stained with Harris-modified hematoxylin and alcoholic eosin stains (Fisher Scientific Co., Pittsburgh, Pennsylvania, USA). Sections were analyzed using a BX70 Olympus microscope using a Phase 3 Imaging system (Image Pro 4.0; Media Cybernetics L.P., Santa Clara, California, USA) as described previously (20).
Statistics.
Data were analyzed by unpaired, two-tailed t tests (food intake, leptin and insulin concentration, baseline glucose concentration, and carcass analysis) or repeated measures ANOVA (body weight, glucose-tolerance test, and insulin-tolerance test) comparing transgenic to wild-type animals (Statview 4.5; Abacus Concepts Inc.) and P values less than 0.05 were considered significant. Error bars in figures represent one SE.
Results
Production of transgenic animals.
Restriction analysis of one P1 clone containing the murine MCH gene allowed for the creation of an unambiguous physical map (Figure 1) showing the position and orientation of the MCH-coding region. The clone consists of the expected 16-kb P1 vector and a 72-kb genomic insert. The 70-kb DNA construct used for generation of transgenic mice included approximately 25 kb of 5′ and 45 kb of 3′ sequence flanking the MCH-coding region.
Fifty-four offspring were obtained from injection of about 200 oocytes, five of which were found to be transgenic by Southern blot analysis (data not shown). A colony from one of these founders with the highest evident gene copy number (approximately five, with one apparent integration site) was established. The transgene has remained stably integrated and has demonstrated simple Mendelian inheritance. Both heterozygous and homozygous transgenic animals appeared healthy and demonstrated no gross anatomic or behavioral abnormalities.
Overexpression of the MCH transgene.
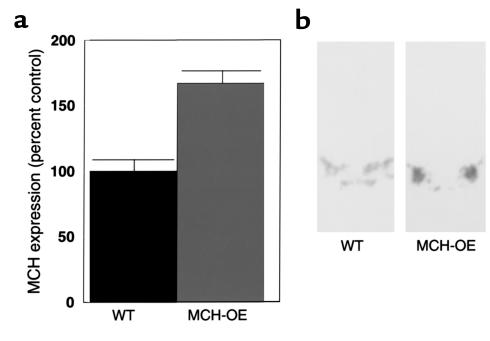
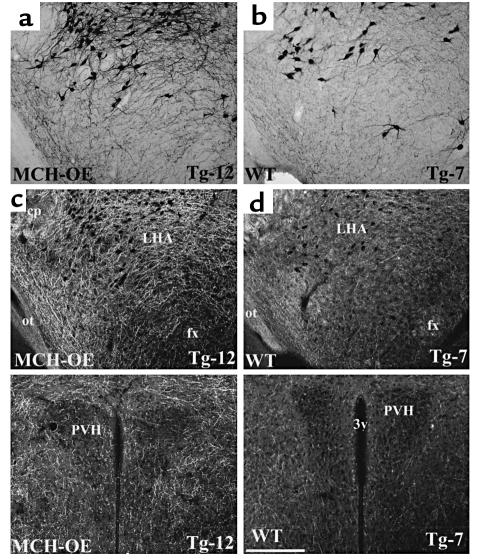
Northern blot analysis performed on hypothalamic tissue of heterozygous transgenic mice showed up to a fourfold difference in MCH mRNA expression between wild-type littermates and transgenic animals in the fed state (data not shown). The average difference between wild-type (n = 9) and overexpresser mice (n = 8) was almost twofold (45.1 ± 3.0 versus 84.6 ± 3.4 arbitrary units, P < 0.0001 by t test). MCH overexpression was confirmed by in situ hybridization histochemistry, which indicated a 50% increase in MCH expression (Figure 2a) in the fed state. The pattern of distribution of MCH message in the transgenic animals is indistinguishable from that of wild-type mice, as assessed by in situ hybridization studies (Figure 2b). No MCH signal could be detected by Northern blot analysis in mRNA from various organs in the periphery including liver, spleen, lung, heart, brown adipose tissue, and white adipose tissue (data not shown). These data indicate that MCH expression is eutopic in MCH-OE. Immunohistochemical analysis of MCH levels indicated a visually evident increase in MCH immunoreactivity in MCH-OE mice compared with wild type mice (Figure 3).
Figure 2.
Overexpression of MCH mRNA in the lateral hypothalamic area of MCH-transgenic mice is demonstrated by Northern blot analysis (P < 0.01) (a) and in situ hybridization (b). WT, wild-type.
Figure 3.
(a and b) A series of bright-field photomicrographs demonstrate MCH-immunoreactive neurons in the lateral hypothalamic area (LHA) in the brain (a) of an MCH-OE mouse (mouse Tg-12) and in the corresponding hypothalamic area in the brain (b) of a wild-type mouse (mouse Tg-7), showing a visually evident increase in MCH immunostaining in neurons of the MCH-OE mouse in comparison with the wild-type mouse. (c and d) A series of dark-field photomicrographs demonstrate the distribution of MCH-immunoreactive fibers in the LHA in the brain (c) of an MCH-transgenic mouse (mouse Tg-12) and in the corresponding hypothalamic area in the brain (d) of a wild-type mouse (mouse Tg-7). Within the LHA, the MCH-immunoreactive cell bodies are distributed in similar patterns in the MCH-OE and wild-type brains (c and d). However, note the visually apparent increase in MCH immunoreactivity in the LHA (c and d). There is also visually evident increase in MCH immunoreactivity surrounding the paraventricular hypothalamic nucleus (PVH) in the MCH-OE brain (bottom left panel) compared with the wild-type brain (bottom right panel). Scale bar, 200 μm. cp, cerebral peduncle; fx, fornix; ot, optic tract; 3v, third ventricle.
Body weight, food intake, and percentage of body adiposity.
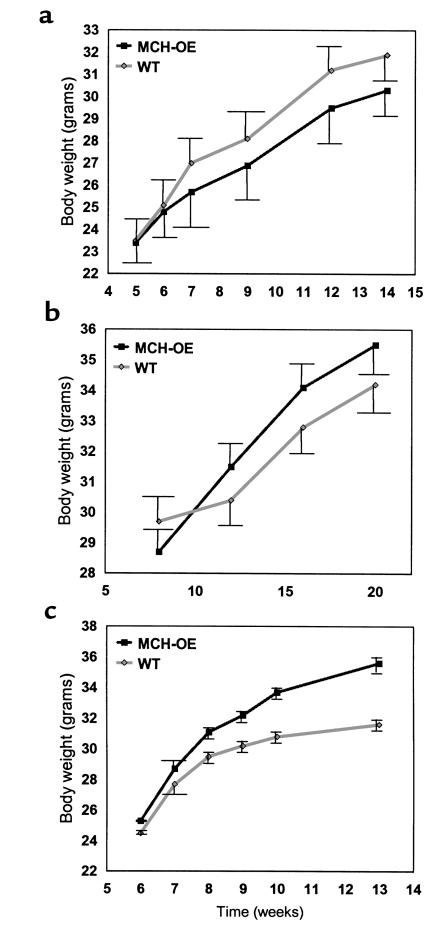
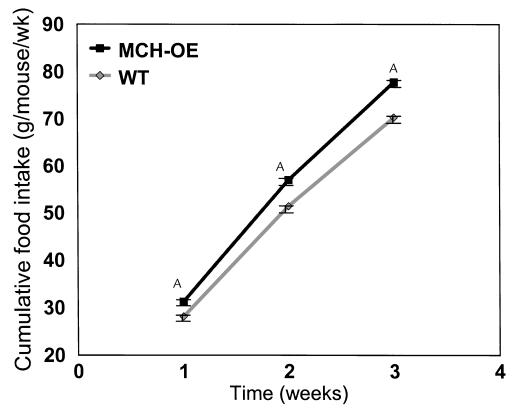
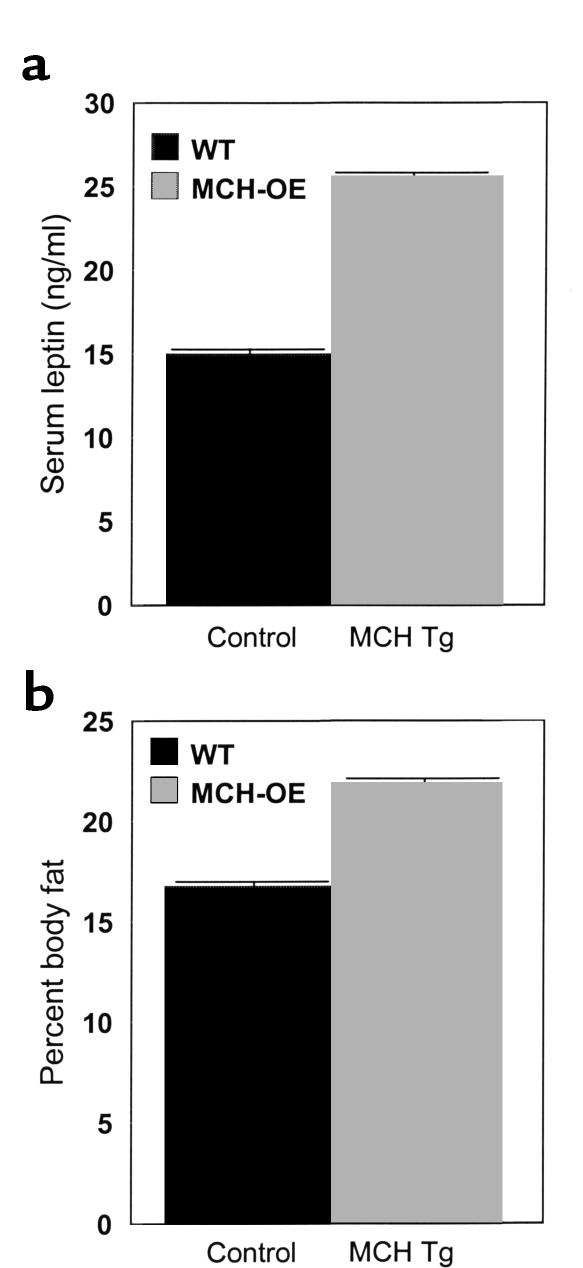
Weight gain of heterozygous and homozygous transgenic mice was studied under several conditions. Heterozygotes fed standard chow (data not shown) or a high-fat diet (Figure 4a) showed no differences in body weight compared with wild-type littermates. Homozygotes fed standard chow showed a nonsignificant tendency to be heavier than wild-type animals raised under identical conditions (Figure 4b). When fed a high-fat diet, however, homozygotes gained significantly more weight than wild-type mice, with a difference of 12.6% by age 13 weeks (P < 0.001) (Figure 4c). The greater body weight of homozygous transgenic mice on a high-fat diet appears to be, at least in part, attributable to increased food intake, as these animals ate about 10% more than wild-type mice (P < 0.001) (Figure 5). Moreover, these mice were fatter than wild-type mice, as demonstrated by elevated serum leptin concentration (25.6 ± 1.9 vs. 15.0 ± 1.7 ng/ml; P < 0.001) (Figure 6a) and carcass analysis (21.9 ± 1.4 vs. 16.7 ± 1.4% body fat; P = 0.02) (Figure 6b).
Figure 4.
Weight curve of male MCH-transgenic heterozygotes on high-fat diet (a) shows no significant increase in body weight of MCH heterozygotes (P = NS, repeated measures ANOVA). Male MCH-transgenic homozygotes on standard diet (b) show no significant increase (P = NS, repeated measures ANOVA) in body weight. Male MCH-transgenic homozygotes on a high-fat diet (c) show a significant increase (P < 0.001, repeated measures ANOVA) in body weight.
Figure 5.
Food intake of male MCH transgenic homozygotes on high-fat diet, showing an approximately 10% increase in food intake (P < 0.001 for the comparisons at weeks 1, 2, and 3) in these animals compared with wild-type mice. ASignificant difference.
Figure 6.
Serum leptin (a) and percentage of body fat (b) in male MCH transgenic homozygote mice, showing a significant (approximately twofold, P < 0.001) increase in serum leptin and percentage of body fat (approximately 31%, P = 0.02) in male MCH-transgenic homozygotes placed on high-fat diet.
Glucose homeostasis.
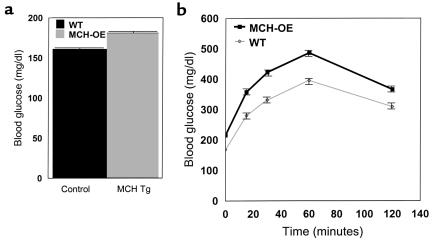
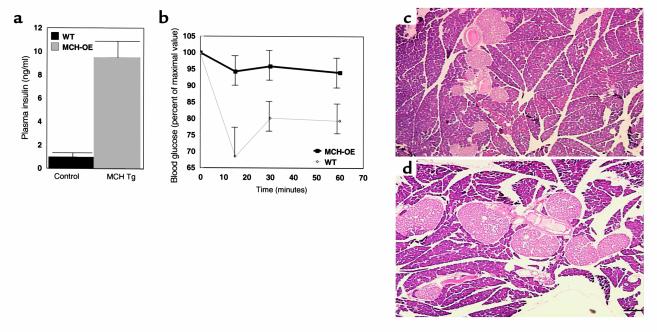
Mean blood glucose determined at the end of the light cycle (e.g., preprandial) for homozygous transgenic mice compared with wild-type mice was 181 ± 4 versus 161 ± 5 mg/dl (P = 0.003), respectively (Figure 7a). Transgenic mice also had higher mean blood glucose measured for 2 hours after intraperitoneal glucose injection than wild-type mice (369 ± 19 vs. 296 ± 14 mg/dl; P = 0.002) (Figure 7b). Mean plasma insulin concentration determined at the beginning of the light cycle (e.g., postprandial) was dramatically higher in the homozygous transgenic compared with wild-type animals (9.5 ± 1.7 vs. 1.0 ± 0.2 ng/ml; P < 0.001) (Figure 8a). Fifteen minutes after injection of insulin, mean blood glucose decreased by only 5% in the homozygous transgenics compared with 31% in the wild-type mice (difference between groups for blood glucose response: P < 0.001) (Figure 8b). Finally, pancreatic islet histology of transgenic mice demonstrated marked increase in islet size (Figure 8c).
Figure 7.
Fed blood glucose (a) and intraperitoneal glucose-tolerance test (b) in male MCH transgenic homozygote mice placed on a high-fat diet, showing significantly higher fed blood glucose (P = 0.003) and impaired glucose tolerance (P = 0.002, repeated measures ANOVA) in the MCH-transgenic homozygotes.
Figure 8.
Fed plasma insulin (a), insulin-tolerance test (b), and pancreatic islet cell histology (c and d) in male control animals. Plasma insulin was approximately tenfold higher (P < 0.001) in MCH-transgenic mice, which showed insulin resistance on insulin-tolerance testing (P < 0.001, repeated measures ANOVA). Representative sections of pancreas showed that when compared with control animals (c), MCH-transgenic mice had a twofold increase in islet size (d) (P < 0.02).
Transgene on the C57BL background.
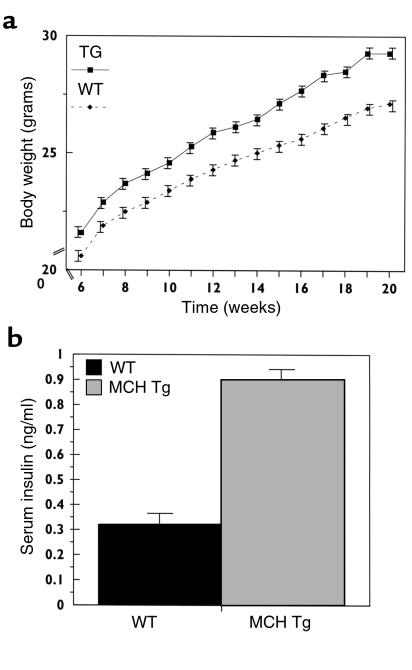
In contrast to the findings in the FVB mice, male C57BL/6J animals heterozygous for the MCH transgene and fed a standard (6% fat) chow diet were heavier than wild-type animals (Figure 9a). Weights diverged as early as 5 weeks of age and the difference persisted out to 20 weeks of age, when MCH-OE mice were approximately 10% heavier than wild-type animals (P = 0.002) (Figure 9a). We have calculated that male C57BL/6J animals heterozygous for the MCH transgene show a 6.8% (statistically not significant) increase in food intake over wild-type littermates (data not shown), corresponding to a 0.99 kcal/day difference (statistically not significant). Serum insulin levels were increased threefold (P = 0.009) (Figure 9b), while fed blood glucose levels were normal in MCH-OE heterozygote, C57BL/6J mice (data not shown).
Figure 9.
Weight curves (a) and serum insulin levels (b) of male MCH-transgenic heterozygotes back-bred on C57BL/6J background for seven generations. These MCH-OE mice showed a significant increase (P = 0.002, repeated measures ANOVA) in body weight on a standard (6% fat) diet. Serum insulin levels were increased threefold (P = 0.009) in the MCH-OE mice in comparison with wild-type mice.
Discussion
MCH is an important regulator of feeding behavior (1–4). In the brain, MCH is synthesized exclusively in neurons of the lateral hypothalamus, which make monosynaptic connections throughout the cortex (21). MCH neurons also synapse with neurons in the parabrachial nucleus and the nucleus of the tractus solitarius, hindbrain nuclei important in ingestive behavior (21). When administered ICV, MCH induces an acute increase in feeding (3). Mice in which the MCH gene has been ablated are hypophagic and lean (6). This suggested that overexpression of MCH might result in obesity. To test this hypothesis we generated mice overexpressing the MCH gene by way of the native (endogenous) promoter. These MCH-OE mice were made on an FVB genetic background.
Despite the confirmed overexpression of MCH on this background, heterozygote mice did not demonstrate a feeding or obesity phenotype, nor did heterozygotes placed on a high-fat diet show an increased tendency toward obesity compared with wild-type mice. However, homozygote animals placed on a high-fat diet gained excessive weight compared with littermate wild-type animals on a high-fat diet. MCH-OE mice were hyperphagic and had a 31% increase in total body fat.
Our findings contrast with those seen with repeated, central MCH administration to rats, which did not lead to sustained hyperphagia or obesity (22). The reason for the apparent discrepancy between our data and the previous study (22) most likely reflects differences between the two models. MCH-OE mice have sustained endogenous MCH overexpression over their lifetime, whereas rats in the previous study were given MCH twice a day. We have demonstrated previously (3) that the effect of centrally administered MCH wanes after 6 hours. In addition to seeing the tachyphylaxis noted in the rat study, it is likely that rats given MCH twice a day have compensatory hypophagia during the period between injections, after the MCH effect has likely waned.
Obesity in MCH-OE mice was associated with an increase in leptin levels and impaired glucose tolerance, insulin resistance, and increase in islet size. The increase in islet size may be associated with insulin resistance in MCH-OE mice, as is observed in other animal models of insulin resistance (23).
Obesity may result from either an increase in food intake or a decrease in energy expenditure. MCH-OE showed a small increase in food intake amounting to 1.4 kcal/day in the FVB strain and 0.99 kcal/day in the C57BL/6J strain. In some animal models it is possible to compare weight gain in pair-fed animals and thereby determine to what degree weight differences are determined by food intake. However, the differences in food intake seen between MCH-OE and control animals are quite small (300 mg/day in MCH-OE on the C57BL/6J background) and pair feeding to such a small difference is problematic. Rather, to address the possibility that differences in energy expenditure also contribute to the weight difference, we plan to evaluate both voluntary and involuntary energy expenditure in future studies.
One feature of obesity in mice is that susceptibility to obesity varies widely between different strains of mice. C57BL/6J are known to be susceptible to diet-induced obesity, while A/J mice are resistant to diet-induced obesity (14). The susceptibility of the FVB strain to obesity is not well studied, but FVB mice are generally considered to be resistant (24). We therefore bred the MCH-OE gene onto the known obesity-susceptible C57BL/6J background. The F7 generation was then examined. We found that C57BL/6J males heterozygous for the MCH-OE transgene were spontaneously obese on a standard chow diet. Weights for these animals diverged at approximately 5 weeks, and a 10% difference was maintained as the animals matured into adulthood. At 14 weeks, C57BL/6J back-bred MCH-OE mice continued to weigh 10% more than wild-type littermate mice. This finding demonstrates the importance of genetic background to the development of obesity caused by MCH-OE overexpression. While obesity is spontaneous in heterozygous C57BL mice, obesity in the FVB mice is seen only when homozygote mice are fed a high-fat diet. This finding also indicates that other, as yet undefined, factors can compensate for MCH overexpression. As seen in the FVB mice overexpressing MCH, C57BL/6J back-bred MCH-OE mice also develop impaired insulin sensitivity. To date, the impairment is limited to a threefold rise in endogenous insulin levels, although it is possible that, over time, these mice may develop further impairments in glucose homeostasis.
Insulin resistance is seen in the absence of leptin, as Lepob/Lepob mice are significantly hyperinsulinemic and may become overtly diabetic (25, 26). However, insulin resistance is also seen in hyperleptinemic models of obesity, such as the agouti (Ay) (27) mouse, the brown adipose tissue–deficient (UCP-DTA) mouse (24), and in diet-induced obesity (24). Interestingly, insulin resistance may also occur as a response to direct treatment of animals with NPY. Rats treated with ICV NPY develop insulin resistance, even when obesity and overeating are prevented by pair feeding NPY-treated animals to vehicle-treated animals (28). Hence, it is intriguing to speculate that some of the insulin resistance seen in the MCH-OE mice is the result of an effect of MCH independent of body weight. The evolution of insulin resistance with age and susceptibility of C57BL/6J back-bred MCH-OE mice to impaired glucose tolerance is the subject of ongoing studies.
These findings further support the importance of MCH in the regulation of energy homeostasis. Disruption of the MCH gene leads to a lean phenotype (6), while eutopic overexpression, as reported here, leads to susceptibility to hyperphagia, obesity, and to a dysregulation of glucose homeostasis. In addition, our findings point out the importance of genetic background in evaluating susceptibility to both obesity and impaired glucose homeostasis.
Acknowledgments
We wish to thank Joseph Majzoub for stimulating discussions and advice. This work was supported by grants from the Charles H. Hood Foundation and the NIH (1K08 DK-02440) to David Ludwig, as well as from grants from the NIH to J.S. Flier and E. Maratos-Flier (RO1 DK-56113 and PO1 DK-56116). Both J.S. Flier and E. Maratos-Flier are the recipients of sponsored research awards from Eli Lilly and Co. Nicholas A. Tritos was supported by a Mary K. Iacocca Fellowship sponsored by the Mary K. Iacocca Foundation. Rohit N. Kulkarni was supported by a NIH NRSA Fellowship (DK-09825).
References
- 1.Flier JS, Maratos-Flier E. Obesity and the hypothalamus: novel peptides for new pathways. Cell. 1998; 92:437–440. doi: 10.1016/s0092-8674(00)80937-x. [DOI] [PubMed] [Google Scholar]
- 2.Tritos NA, Maratos-Flier E. Two important systems in energy homeostasis: melanocortins and melanin-concentrating hormone. Neuropeptides. 1999; 33:339–349. doi: 10.1054/npep.1999.0055. [DOI] [PubMed] [Google Scholar]
- 3.Qu D, et al. A role for melanin-concentrating hormone in the central regulation of feeding behaviour. Nature. 1996; 380:243–247. doi: 10.1038/380243a0. [DOI] [PubMed] [Google Scholar]
- 4.Ludwig DS, et al. Melanin-concentrating hormone: a functional melanocortin antagonist in the hypothalamus. Am J Physiol. 1998; 274:E627–E633. doi: 10.1152/ajpendo.1998.274.4.E627. [DOI] [PubMed] [Google Scholar]
- 5.Bittencourt JC, et al. The melanin-concentrating hormone system of the rat brain: an immuno- and hybridization histochemical characterization. J Comp Neurol. 1992; 319:218–245. doi: 10.1002/cne.903190204. [DOI] [PubMed] [Google Scholar]
- 6.Shimada M, Tritos NA, Lowell BB, Flier JS, Maratos-Flier E. Mice lacking melanin-concentrating hormone are hypophagic and lean. Nature. 1998; 396:670–674. doi: 10.1038/25341. [DOI] [PubMed] [Google Scholar]
- 7.Clark JT, Sahu A, Kalra PS, Balasubramaniam A, Kalra SP. Neuropeptide Y (NPY)-induced feeding behavior in female rats: comparison with human NPY ([Met17]NPY), NPY analog ([norLeu4]NPY) and peptide YY. Regul Pept. 1987; 17:31–39. doi: 10.1016/0167-0115(87)90030-9. [DOI] [PubMed] [Google Scholar]
- 8.Stanley BG, Kyrkouli SE, Lampert S, Leibowitz SF. Neuropeptide Y chronically injected into the hypothalamus: a powerful neurochemical inducer of hyperphagia and obesity. Peptides. 1986; 7:1189–1192. doi: 10.1016/0196-9781(86)90149-x. [DOI] [PubMed] [Google Scholar]
- 9.Erickson JC, Clegg KE, Palmiter RD. Sensitivity to leptin and susceptibility to seizures of mice lacking neuropeptide Y. Nature. 1996; 381:415–421. doi: 10.1038/381415a0. [DOI] [PubMed] [Google Scholar]
- 10.Erickson JC, Hollopeter G, Palmiter RD. Attenuation of the obesity syndrome of ob/ob mice by the loss of neuropeptide Y. Science. 1996; 274:1704–1707. doi: 10.1126/science.274.5293.1704. [DOI] [PubMed] [Google Scholar]
- 11.Huszar D, et al. Targeted disruption of the melanocortin-4 receptor results in obesity in mice. Cell. 1997; 88:131–141. doi: 10.1016/s0092-8674(00)81865-6. [DOI] [PubMed] [Google Scholar]
- 12.Krude H, et al. Severe early-onset obesity, adrenal insufficiency and red hair pigmentation caused by POMC mutations in humans. Nat Genet. 1998; 19:155–157. doi: 10.1038/509. [DOI] [PubMed] [Google Scholar]
- 13.Nonogaki K, Strack AM, Dallman MF, Tecott LH. Leptin-independent hyperphagia and type 2 diabetes in mice with a mutated serotonin 5-HT2C receptor gene. Nat Med. 1998; 4:1152–1156. doi: 10.1038/2647. [DOI] [PubMed] [Google Scholar]
- 14.Bergen HT, Mizuno T, Taylor J, Mobbs CV. Resistance to diet-induced obesity is associated with increased proopiomelanocortin mRNA and decreased neuropeptide Y mRNA in the hypothalamus. Brain Res. 1999; 851:198–203. doi: 10.1016/s0006-8993(99)02186-1. [DOI] [PubMed] [Google Scholar]
- 15.Nahon JL, Presse F, Breton C, Hervieu G, Schorpp M. Structure and regulation of the melanin-concentrating hormone gene. Ann NY Acad Sci. 1993; 680:111–129. doi: 10.1111/j.1749-6632.1993.tb19678.x. [DOI] [PubMed] [Google Scholar]
- 16.Nahon JL. The melanin-concentrating hormone: from the peptide to the gene. Crit Rev Neurobiol. 1994; 8:221–262. [PubMed] [Google Scholar]
- 17.Southern EM, Mitchell AR. Chromatography of nucleic acid digests on thin layers of cellulose impregnated with polyethyleneimine. Biochem J. 1971; 123:613–617. doi: 10.1042/bj1230613. [DOI] [PMC free article] [PubMed] [Google Scholar]
- 18.Tritos NA, Elmquist JK, Mastaitis JW, Flier JS, Maratos-Flier E. Characterization of expression of hypothalamic appetite-regulating peptides in obese hyperleptinemic brown adipose tissue-deficient (uncoupling protein-promoter-driven diphtheria toxin A) mice. Endocrinology. 1998; 139:4634–4641. doi: 10.1210/endo.139.11.6308. [DOI] [PubMed] [Google Scholar]
- 19.Salmon DM, Flatt JP. Effect of dietary fat content on the incidence of obesity among ad libitum fed mice. Int J Obes. 1985; 9:443–449. [PubMed] [Google Scholar]
- 20.Kulkarni RN, et al. Altered function of insulin receptor substrate-1-deficient mouse islets and cultured beta-cell lines. J Clin Invest. 1999; 104:R69–R75. doi: 10.1172/JCI8339. [DOI] [PMC free article] [PubMed] [Google Scholar]
- 21.Bittencourt JC, Elias CF. Melanin-concentrating hormone and neuropeptide EI projections from the lateral hypothalamic area and zona incerta to the medial septal nucleus and spinal cord: a study using multiple neuronal tracers. Brain Res. 1998; 805:1–19. doi: 10.1016/s0006-8993(98)00598-8. [DOI] [PubMed] [Google Scholar]
- 22.Rossi M, et al. Melanin-concentrating hormone acutely stimulates feeding, but chronic administration has no effect on body weight. Endocrinology. 1997; 138:351–355. doi: 10.1210/endo.138.1.4887. [DOI] [PubMed] [Google Scholar]
- 23.Bruning JC, et al. Development of a novel polygenic model of NIDDM in mice heterozygous for IR and IRS-1 null alleles. Cell. 1997; 88:561–572. doi: 10.1016/s0092-8674(00)81896-6. [DOI] [PubMed] [Google Scholar]
- 24.Frederich RC, et al. Leptin levels reflect body lipid content in mice: evidence for diet-induced resistance to leptin action. Nat Med. 1995; 1:1311–1314. doi: 10.1038/nm1295-1311. [DOI] [PubMed] [Google Scholar]
- 25.Joosten HF, van der Kroon PH. Enlargement of epididymal adipocytes in relation to hyperinsulinemia in obese hyperglycemic mice (ob/ob) Metabolism. 1974; 23:59–66. doi: 10.1016/0026-0495(74)90104-8. [DOI] [PubMed] [Google Scholar]
- 26.Muzzin P, Eisensmith RC, Copeland KC, Woo SL. Correction of obesity and diabetes in genetically obese mice by leptin gene therapy. Proc Natl Acad Sci USA. 1996; 93:14804–14808. doi: 10.1073/pnas.93.25.14804. [DOI] [PMC free article] [PubMed] [Google Scholar]
- 27.Boston BA, Blaydon KM, Varnerin J, Cone RD. Independent and additive effects of central POMC and leptin pathways on murine obesity. Science. 1997; 278:1641–1644. doi: 10.1126/science.278.5343.1641. [DOI] [PubMed] [Google Scholar]
- 28.Sainsbury A, et al. Chronic central neuropeptide Y infusion in normal rats: status of the hypothalamo-pituitary-adrenal axis, and vagal mediation of hyperinsulinaemia. Diabetologia. 1997; 40:1269–1277. doi: 10.1007/s001250050820. [DOI] [PubMed] [Google Scholar]


