

Abstract
Gene expression profiles in the periaqueductal gray (PAG) of adult Long-Evans rats as a function of a stressful social defeat in inter-male fighting encounters were examined. This social subordination model mimics prototypical behavioral changes that parallel aspects of clinical depression, has been postulated to simulate early changes in the onset of depression in the losers, and has been successfully utilized for the evaluation of antidepressant activity. 22-kHz ultrasonic vocalizations (USVs) have been shown to reflect negative emotional states akin to anxiety and depression. Social defeat is the most robust and reliable method of eliciting these calls. The PAG has been shown to be a key brain region for the generation of 22-kHz ultrasonic vocalizations, and 22-kHz USVs have been shown to be controlled by the mesolimbic cholinergic system. In this present study we examined gene expression changes in the PAG of social subordinate rats compared to dominant rats (that do not exhibit 22-kHz USVs). We found that social defeat significantly altered the genes associated with cholinergic synaptic transmission in the PAG. The most robust of these were the increased expression of the β2 subunit of the nicotinic acetylcholine receptor (CHRNB2) and the T-subunit of acetylcholinesterase (ACHE) in the subordinate animals. These changes were corroborated by qRT-PCR and found to be exclusive to the PAG compared to seven other brain regions examined. These data suggest that cholinergic transmission in the PAG is involved in the generation of 22-kHz USVs and provide potential therapeutic targets for the treatment of affective disorders.
Keywords: Aggression, Depression, Genes, Microarray, qRT-PCR, Cholinergic, Ultrasonic vocalizations, Rats
1. Introduction
Major depression is among the most prevalent psychological disorders in America [reviewed in 37, 62]. The incidence is increasing in virtually all age groups, and the highest growth rate is seen in the young, especially teens. At the current rate of increase, it will be the second most disabling condition in the world by 2020, behind heart disease. In any given 1-year period, over 10 percent of the adult population, or about 18.8 million American adults, suffer from a depressive illness [68].
The development of novel antidepressants is an evolving field [8, 29]. Current therapeutic strategies for the treatment of depression, primarily aimed at amelioration of the symptoms observed after disease progression, are effective in only a subset of patients. A large proportion of patients are resistant to currently available treatment options [26]. Most traditional antidepressants appear to work only in those with excessive activity in anterior cingulate regions that mediate negative emotions [53]. For the most part, the newer antidepressants appear no more powerful than older types, albeit significantly better tolerated and with fewer side effects [55]. A more detailed understanding of the molecular mechanisms underlying the onset of depression is clearly needed to significantly impact the course of this debilitating illness.
There are several animal models that can potentially be used to mimic these earlier events [reviewed in 58, 88], including those based on exposure to acute or chronic low-grade stress (e.g., learned helplessness, forced swim test, and early social isolation) and selectively bred genetic models (e.g., Flinders sensitive line (FSL), Roman low-avoidance (RLA), and Fawn hooded (FH) lines) [reviewed in 88]. For a full review of models, see the special issue of Neuroscience and Biobehavioral Reviews (edited by A. Markou) devoted to the topic [52]. We have chosen to use another well standardized model, based on social submission in adult male rats [50, 69], to identify the genetic consequences of social loss. The chronic stress that occurs in the presence of persistent loss in aggressive social encounters [2, 57 especially in the absence of social support [69, 18], is a major factor that sets in motion incompletely understood neurobiological events that leads to affective deficits and depressive disorders [49, 57, 58, 66, 81].
The purpose of the present work was to identify gene expression changes in an animal model that shows prototypical behavioral changes that parallel aspects of clinical depression [reviewed in 86, 54, 87]; specifically, (1) dysregulation of the HPA axis [69], (2) increases in indices of anxiety, including significant loss of body weight [70, 69], (3) anhedonia [85, 70], (4) learned helplessness [70], and (5) increased number of 22-kHz vocalizations and freezing behavior indicative of anxiety and negative affect [11, 12]. Of the various models of depression (i.e. swim test, tail suspension test, fear conditioning, shock avoidance, and social defeat) the principle dependent measure is freezing behavior and / or 22-kHz ultrasonic vocalizations. Additionally, and perhaps most importantly, models based on social submission have recently been successfully utilized for the evaluation of antidepressant activity [33, 51].
We have recently identified several molecular pathways in neocortical tissue associated with the genesis of depression [41]. As part of our comprehensive molecular strategy, analysis of additional, critical brain regions will augment our ability to identify targetable molecular pathways relevant to the onset of depression, as well as the development of the next generation of more efficacious antidepressants.
The periaqueductal gray (PAG) is a critical brain structure involved in fear-related behaviors [46, 6]. It has all the anatomical connectivities one would expect of a major emotion system integrator [7, 15, 27, 61] and it exhibits functional changes as a result of emotional arousal [1, 4, 6, 36]. Electrical and chemical stimulation of the PAG produces defensive and freezing behaviors in the rat [3, 30] and many studies have shown that distinct regions of the PAG are involved in the acquisition and expression of various defensive behaviors [19, 34]. Dramatic increases in transcriptional activity in the PAG during dominant/submissive encounters have been observed. In hamsters, agonistic encounters between dominant and submissive animals produce increased fos-immunolabeled neurons in the dorsolateral columns of the PAG in the subordinate animals [40]. In addition, recent studies in the rat demonstrated that excitation of the lateral PAG produced largely defensive responses, including emission of 22-kHz distress ultrasonic vocalizations (USVs). Conversely, stimulation of the ventral PAG produced submissive behavior (mainly comprised of immobility/freezing behaviors) without emission of USVs [reviewed in 14].
Here we report on a carefully selected cohort of six pairs of male rats from inter-male aggression encounters that exhibited robust asymmetries in dominance and submission. mRNAs isolated from the periaqueductal gray regions were examined by microarray analysis. We utilized an integrated transcriptome profiling platform that coupled (1) design and fabrication of focused oligonucleotide microarrays containing a restricted number of transcripts carefully selected to provide near complete representation of the major rat ontological categories, with (2) stringent statistical and ontological analyses to identify relevant genesets, and (3) ultimate corroboration of the geneset by quantitative real-time PCR [41]. We have overcome the necessity for broad transcriptome coverage typically provided by global commercial arrays by the strategic selection of genes which are represented on our microarrays. Notwithstanding, in-house design and fabrication allows a stringent level of quality control, exquisite sensitivity, and economy that typically constrains the number of arrays required to conduct experiments with sufficient numbers of biological samples/replicates and provide statistically acceptable sensitivity and specificity. This approach has reliably identified transcripts having as low as 10% differences in transcript expression between RNA samples observed in heterogeneous tissue sources such as neocortex and hippocampus [41, 56]. In sum, our approach of highly selective yet broad ontological coverage of the rat transcriptome facilitates the generation of high quality data from systems/paradigms sensitive to small regulatory changes that can be confirmed by independent measurements.
This approach yielded 22 genes found to be predominantly expressed in the PAG of submissive animals compared to the PAG of dominant animals, and 10 genes predominantly expressed in the PAG of dominant animals compared to the PAG of submissive animals. Ontological analyses using the GoMiner algorithm and Gene Set Enrichment Analysis (GSEA) identified significant enrichment in genes regulating the apoptotic pathway, small GTPase-mediated signal transduction, and cholinergic synaptic transmission. A subset of these genes was further examined and quantified by qRT-PCR: the β2 subunit of the nicotinic acetylcholine receptor (CHRNB2) and the T-subunit of acetylcholinesterase (ACHE).
2. Methods
2.1 Behavioral Analysis
2.1.1 Subjects
The cohort of animals used in this study was previously described [41]. In sum, this research was approved by the Bowling Green State University IACUC. The 18 animals for this study were derived from a larger group of 29 Long-Evans adult male rats that were evaluated for behavioral dominance in an isolation-induced resident-intruder aggression paradigm, after which they were sacrificed, and brain tissues harvested. From this larger group, the 6 male pairs from different litters that exhibited the clearest dominance-submission patterns and six littermate control males that were treated the same way, except for aggression testing, were selected for further genetic analysis.
2.1.2 Behavioral Testing
Prior to testing, animals were weighed and assigned to either the experimental resident or intruder groups, or the control group, approximately matched for weight, with residents being approximately 10% heavier than the intruders. Subjects in the dominant and subordinate groups were matched with former littermates during testing, to provide some control for background genetic factors, and all animals remained singly housed from weaning and throughout testing. All animals were habituated to the testing environment (a separate room) for 2 consecutive days for 30 min each day. During testing, ultrasonic vocalizations elicited from each rat pair were also recorded using a Pettersson D980 ultrasonic detector (Pettersson Elektronik AB, Uppsala, Sweden; frequency division 1/10), and the animals were videotaped using a commercially available camera and VCR. Videotape records were hand scored by a single observer for three behaviors: 1) freezing, 2) bites, and 3) dorsal contacts. Inter-observer reliability scores for freezing, bites, and dorsal contacts, were 0.99, 0.98, and 0.87, respectively (Pearson correlations, all p’s<0.05), as previously reported [63]. Ultrasonic vocalizations (USVs) were scored via sonogram (Avisoft BioAccoustics) with 50-kHz USVs scored from heterodyne (tuned to 55-kHz) and 22-kHz calls scored from frequency division recordings (broad-band recording). All behaviors monitored were scored blind with respect to biochemical results.
Testing occurred on the days immediately after habituation, and consisted of 2 consecutive days of placing the intruder in the resident’s cage and video recording their social interaction for 30 min for each day. This initial period was followed by 4 days of no testing and concluded with two additional days of testing. To minimize the effect of handling and exploration of a novel environment, control animals were placed alone into the home cage of another adult male rat during testing, and transported to the same test room at the same time as the experimental rats. Animals were euthanized with carbon dioxide six hours after the last encounter. Their brains were rapidly removed, olfactory bulbs were discarded, and the rest of the brain was dissected and immersed into an RNase inhibitor (RNAlater, Ambion). Prior to analysis, brain samples were further dissected into nine sub-areas: 1) frontal cortex (FCTX, tissue anterior to the frontal pole of the basal ganglia); 2) posterior cortex (PCTX, including all the posterior neocortical areas dorsal to the rhinal sulcus behind the FCTX sample); 3*) basal ganglia (including caudate nuclei, globus pallidus and nucleus accumbens); 4*) temporal-amygdaloid area; 5*) hippocampus; 6*) diencephalon (including most of the thalamus and hypothalamus); 7*) the cerebellum, 8) the mesencephalon, containing the periaqueductal gray, and 9*) the brainstem (Note: for explanation of asterisks, see end of paragraph). The cortical areas were the focus of an earlier report [41]. For these studies, the PAG was isolated by taking a circular punch from a transverse section of mesencephalon extending from the meso-diencephalic juncture to the entry of the fourth ventricle. The punch (3 mm inner diameter) was essentially tangent to the dorsal and lateral convexities of the central gray, and extended ventrally to the sting-ray like “tail” from the approximately -5.6 to -8.8 mm from bregma as defined by the atlas of Paxinos & Watson [65], see Figure 1. This means that some additional tissue was included in the core sample, especially in ventral regions just lateral to the gradually tapering “tail” of the PAG as seen in the transverse plane. The average weight of the PAG samples was 18.9 (± 4.6) mg. The remaining mesencephalic tissue (-PAG) was used as a control sample in follow up control studies that included seven additional brain samples (as described in Figure 3, and asterisked above).
Figure 1.
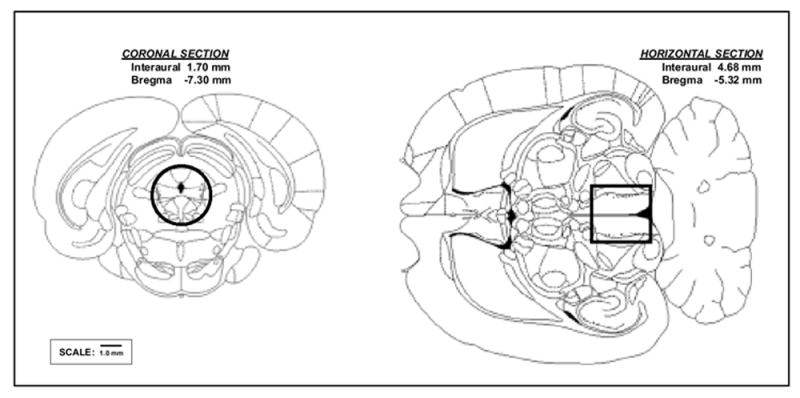
Reconstruction of the periaqueductal gray (PAG) tissue punch used in this study based on the atlas of Paxinos & Watson (1998). PAG was isolated by taking a circular punch (3 mm inner diameter) through the PAG from a transverse section of a coronal section of the brain cut from the anterior boundary of the superior colliculus to the posterior boundary of the junction between the inferior colliculus and the cerebellum.
Figure 3.
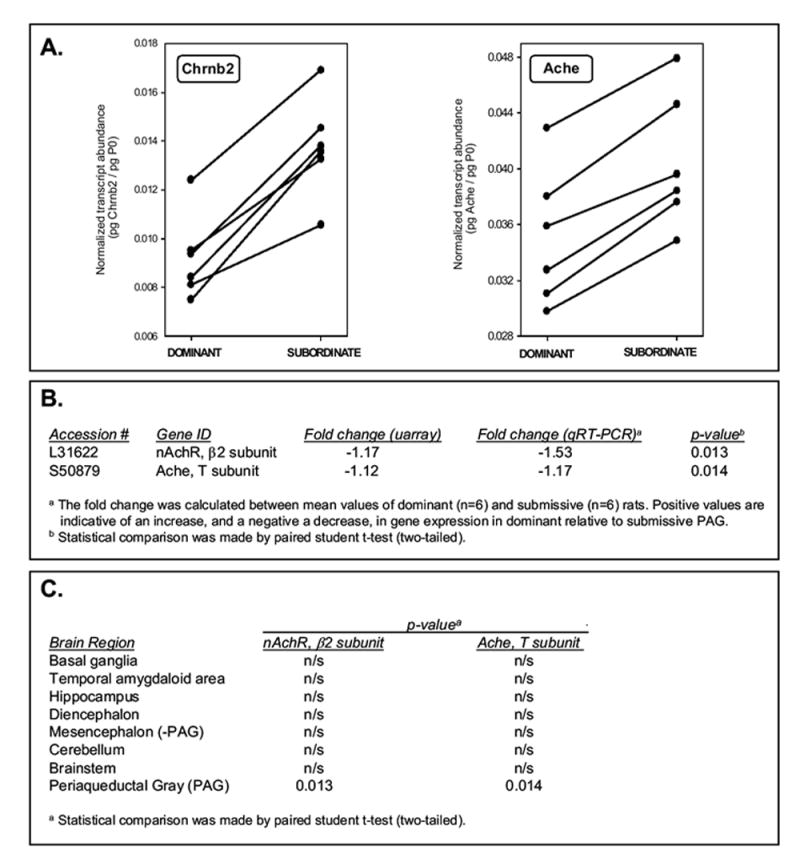
qRT-PCR corroboration of the synaptic cholinergic transmission targets in PAG. Panel A: For each mRNA, transcript abundance, normalized to acidic ribosomal protein P0, was calculated by qRT-PCR, as described in the Materials and Methods. Data presented for each dominant:subordinate littermate pair (n=6). Significant differences between dominant and subordinate animals were observed for both genes (* p<0.05, paired student’s t-test). Panel B: Direct comparison of the microarray and qRT-PCR analyses for the selected genes. Panel C: qRT-PCR analysis of Chrnb2 and Ache expression in additional brain regions (methods as per Panel A). n/s, not significant (p>0.05)
2.2 Gene Expression Analysis
2.2.1 Microarray fabrication
The genes comprising our Rat CNS microarrays were compiled from currently available NCBI/EMBL/TIGR rat sequence databases and commercially available CNS arrays (Clontech, Mountain View, CA, USA/Affymetrix, Santa Clara, CA, USA), as described [41], and strategically chosen to provide representation of greater than 90% of the major gene ontological categories.
Oligonucleotide microarrays were fabricated, as previously described [41]. Briefly, individual 45mer oligonucleotides complementary to sequences of 1178 cloned rat CNS mRNAs were designed and prioritized (ArrayDesigner v2.03, and [48]) and included control oligonucleotides representing the most traditionally-accepted and commonly-utilized housekeeping genes [44]. These optimal oligonucleotides were individually synthesized on a PolyPlex™ 96-well oligonucleotide synthesizer (GeneMachines®, Palo Alto, CA), utilizing standard phosphoramidite chemistry and addition of a 5’-amino linker (C6-TFA, Glen Research, Sterling, VA, USA) to facilitate covalent attachment of only full length, properly synthesized oligos to aldehyde-treated glass microarray slides. Array manufacture utilized an OmniGrid™ robotic microarrayer (GeneMachines®, Palo Alto, CA). Each oligonucleotide was covalently linked in quadruplicate to aldehyde-coated glass microscope slides (TeleChem International, Inc., Sunnyvale, CA) and stored desiccated until use.
The dynamic range, discrimination power, accuracy, reproducibility, and specificity of the resultant microarrays allow for detection of significant expression changes as small as 10%. Importantly, although smaller changes may actually demonstrate statistical significance, a 10-13% change, in our hands, is currently the limit of discrimination for qRT-PCR quantitation [41, 56].
2.2.2 Target Preparation; RNA Extraction and Labeling, and Microarray Hybridization
Total RNA was extracted from PAG tissue sections with guanidine isothiocyanate and CsCl-ultracentrifugation, purified (Qiagen, Valencia, CA, USA) and used as the substrate for RNA amplification and labeling exactly as described [41]. Universal rat reference RNA (Stratagene, La Jolla, CA, USA) was utilized in our analyses and identical aliquots treated concurrently with the tissue samples. 10μg each of the Cy5-labeled (experimental) and purified Cy3-labeled (reference) amplified RNA (aRNA) targets (each labeled to 15-18% incorporation) were combined in a hybridization solution, denatured and hybridized at 46°C for 16 hours. Following sequential high-stringency washes, individual Cy3 and Cy5 fluorescence hybridization to each spot on the microarray was quantitated by a high resolution confocal laser scanner.
2.2.3 Data Acquisition and Statistical Analysis
Arrays were scanned using two lasers (633nm & 543nm) at 5 micron resolution on the ScanArray 4000XL (Packard Biochip Technologies, Billerica, MA, USA) utilizing QuantArray software (v3.0) at the maximal laser power that produced no saturated spots. Data from these scans analyzed using the adaptive threshold method to differentiate the spot from the background and spot intensity was determined using median pixel intensity. Prior to normalization, quality confidence measurements were calculated for each scanned array [41] to assess overall quality and to ensure that acceptable tolerance limits are not exceeded. Following LOWESS normalization, statistical analyses comparing expression data derived from dominant animals vs. subordinate animals were performed using the permutation-based SAM-RS (Significance Analysis of Microarrays using Rank Scores) [82, 84]. The cutoff for significance in these experiments was set at a False Discovery Rate (FDR) of 3.9% at a specified ±1.1-fold change.
2.2.4 Ontological Analysis
The translation of the lists of differentially expressed genes into organized, functionally-related gene families and biological pathways provides a means to better understand the underlying molecular mechanism relevant in social subordination. The Gene Ontology (GO) Consortium has organized individual genes into biological pathways within three larger, independent hierarchical categories (i.e., ontologies) based on (1) biological process, (2) molecular function and (3) subcellular localization, detailed at http://www.geneontology.org. The genes identified in this study were examined for their biological association to Gene Ontology (GO) categories using the ontological mapping software GoMiner [89], available at http://discover.nci.nih.gov/gominer. GoMiner calculates the enrichment or depletion of individual ontological categories with genes that have changed expression and identifies cellular pathways potentially relevant to social dominance and submission. Pathways within the three independent functional hierarchies, namely, biological process, molecular function and cellular component, were queried. Statistical analysis (via Fishers Exact test) highlights and ascribes a measure of confidence (p-value) to individual GO annotations and potential biological characteristics of the given coregulated gene set.
2.2.5 Quantitative Real-Time PCR Analysis
The expression levels of selected genes were analyzed by quantitative real-time PCR, exactly as previously described [41] using Brilliant SYBR Green qRT-PCR Master Mix (Stratagene, La Jolla, CA, USA) on an Mx3000P Real-Time PCR System. ROX reference dye was included in all reactions. All primer sets were designed across intron:exon boundaries to derive ~100bp amplicons, and individual primer concentrations and final amplification conditions individually optimized. Dissociation curves were performed on all reactions to assure product purity. Original input RNA amounts were calculated by comparison to standard curves using purified PCR product as a template for the mRNAs of interest and were normalized to amount of acidic ribosomal phosphoprotein P0. The minimum expression level of most genes detectable by qRT-PCR was approximately 1 × 10⁻⁸ pg, well below the limit of detectability on the microarrays. Experiments were performed in triplicate for each data point.
The sequences of the qRT-PCR primers used in the study were as follows:
P0 (NM_022402), forward 5’-CAGAGGTACCATTGAAATCC-3’ and reverse 5’-GTTCAACATGTTCAGCAGTG-3’
CHRNB2 (L31622), forward 5’-GCGAAGTGAGGATGATGAC-3’ and reverse 5’-CCCAAAGACACAGACAAAGAC-3’
ACHE (S50879), forward 5’-GAGGGTACCGAGATGTGGAA-3’ and reverse 5’-CAGGTGTGGGAGAAGTAGGC-3’
3. Results
3.1 Behavioral Analyses
As reviewed in the earlier report of this series [41], dominant animals exhibited more dorsal contacts and bites than subordinate animals, and subordinate animals exhibited more freezing behavior than dominant animals on the final test day (summarized in Table 1). Weight gain across testing was significantly greater for dominant rats than submissive rats. Across the test session, levels of 50-kHz vocalizations decreased markedly across trial blocks, while levels of 22-kHz vocalizations increased dramatically across trial blocks on the final test day. Inspection of dominance-submission videotapes indicated that in each case when potential thoracic movements in each animal could be observed while 22-kHz USVs were being emitted, it was the submissive animals’ thoracic movements that were coincident with 22-kHz USVs (a methodology that cannot be used for the 50-kHz USVs). Indeed, past data using such procedures indicate that practically all 22-kHz USVs are generated by the submissive animals [63, 78].
Table 1.
Summary of the Behavioral Results
| BEHAVIOR | DOMINANT (n=6) | SUBMISSIVE (n=6) | p-value |
|---|---|---|---|
| # Dorsal Contacts | 12.3 (± 2.8) | 1.0 (± 0.8) | 0.0079 |
| # Bites | 9.5 (± 4.5) | 0.0 (± 0.0) | 0.0313 |
| % Time Freezing | 1.4 (± 1.4) | 67.2 (± 7.5) | 0.0004 |
| Weight Gain (g) | 9.5 (± 3.2) | 3.0 (± 3.8) | 0.0379 |
| Ultrasonic Vocalizations per pair (n=6) | |||
| mean 50kHz USVs | 159.2 (± 68.1) | ||
| mean 20kHz USVs | 703.2 (± 179.0) | ||
Data expressed as: Mean (± Standard Error of the Mean).
p-value results of two-tailed within subject t-tests are reported, except in the case of # Bites, where a two-tailed sign test was used due to skewness of the data.
3.2 Gene Expression Analyses
Identification of dominance-associated genes
The microarrays described in the Experimental Procedures were used to identify genes expressed in PAG tissue associated with dominance and submission by comparing the expression profile of dominant animals and subordinate animals. Analysis was performed with 6 individual specimens per group to decrease bias that may be introduced by donor-specific gene expression patterns. A reference experimental design was used [16, 21]. Dominant (n=6), subordinate (n=6), and control (n=6) RNA samples were studied in triplicate with three microarray slides for each sample. As each oligonucleotide is spotted in quadruplicate on the array, there are a total of 72 expression measurements for each gene in each group.
Statistical evaluation at a stringent FDR of 3.9% for the dominant-subordinate comparison identified 10 and 22 genes in dominant and subordinate PAG, respectively (Table 2). Importantly, at this stringent FDR, only 1 of these changes was expected to be a false positive. Table 2 shows the identities, functional annotations, and relative expression ratios of these genes. Although the abundance ratios of these genes did not exceed 2-fold, these results clearly indicate that statistically significant changes could be detected. Many functional categories of genes were represented in theses analyses, including synaptic transmission, signal transduction, and apoptosis. Specifically, several of the genes clustered in pathways representative of glutamatergic neurotransmission, neurogenesis, and growth factor activity
Table 2.
Dominance-associated transcripts in the periaqueductal gray (@ 3.9% FDR)
| RGDa symbol | Fold changeb | Gene ID | Function/Ontology | |||
|---|---|---|---|---|---|---|
| SYNAPTIC FUNCTION (signal transduction) | ||||||
| GTPase-mediated | ||||||
| Gnb1 | 1.26 | guanine nucleotide binding protein β1 subunit | Ras protein signal transduction | |||
| Igfbp3 | -1.14 | insulin-like growth factor-binding protein (IGF-BP3) | insulin-like growth factor receptor signaling pathway | |||
| Pak1 | -1.12 | MUK2 | small GTPase mediated signal transduction | |||
| Igf1 | -1.12 | insulin-like growth factor I | insulin-like growth factor receptor signaling pathway | |||
| Kinase-mediated | ||||||
| Pdgfa | 1.25 | platelet-derived growth factor A | growth factor activity | |||
| Gnb2l1 | 1.25 | protein kinase C receptor | intracellular signaling cascade | |||
| Mapk14 | 1.17 | p38 mitogen activated protein kinase | cell surface receptor linked signal transduction | |||
| Camk2b | -1.98 | Ca2+-calmodulin-dependent protein kinase, β subunit | signal transduction | |||
| Ntrk3 (S62933) | -1.29 | receptor tyrosine kinase (TrkC(ki14)) | receptor protein tyrosine kinase activity | |||
| Ntrk3 (S60953) | -1.20 | receptor tyrosine kinase (TrkC(ki39)) | receptor protein tyrosine kinase activity | |||
| Tnf | -1.14 | TNF | signal transduction | |||
| Other | ||||||
| Cart | -1.53 | cocaine and amphetamine regulated transcript | neuropeptide signaling pathway | |||
| SYNAPTIC TRANSMISSION | ||||||
| Cholinergic | ||||||
| Chrnb2 | -1.17 | nicotinic acetylcholine receptor, β2 subunit | synaptic transmission, cholinergic | |||
| Ache | -1.12 | acetylcholinesterase, T subunit | acetylcholine catabolism | |||
| Glutamatergic | ||||||
| Grm2 | 1.15 | metabotropic glutamate receptor 2 | synaptic transmission, glutamatergic | |||
| Other | ||||||
| Il4r | 1.24 | interleukin 4 receptor | immune response | |||
| Maob | 1.13 | monoamine oxidase B | neurotransmitter catabolism | |||
| SYNAPTIC STRUCTURE / REMODELING (metabolism and biosynthesis) | ||||||
| Hspb1 | 1.43 | heat shock protein 27 | protein folding | |||
| Hspcb | 1.21 | heat shock protein 90 | heat shock response/chaperone activity | |||
| Lamr1 | -1.63 | 40kDa ribosomal protein (laminin receptor) | protein biosynthesis | |||
| Apoe | -1.60 | apolipoprotein E | lipoprotein transport | |||
| Ppia | -1.54 | cyclophilin | protein folding and transport | |||
| Lmnb1 | -1.39 | lamin B1 | structural molecule activity | |||
| Gapd | -1.39 | glyceraldehyde 3-phosphate-dehydrogenase | glycolysis | |||
| Hk3 | -1.34 | hexokinase type III | glycolysis | |||
| ION CHANNEL ACTIVITY | ||||||
| Slack | -1.29 | potassium channel subunit (Slack) | potassium ion transport | |||
| Kcna5 | -1.13 | potassium channel-Kv1 | potassium ion transport | |||
| OTHER | ||||||
| Cspg5 | 1.11 | neuroglycan | neurogenesis | |||
| Mif | -1.44 | macrophage migration inhibitory factor | negative regulation of apoptosis | |||
| Egr1 | -1.29 | nerve growth factor-induced gene (NGFI-A) | regulation of transcription | |||
| Sod2 | -1.19 | manganese-containing superoxide dismutase | response to oxidative stress | |||
| Mgat1 | -1.11 | N-acetylglucosaminyltransferase I | protein amino acid N-linked glycosylation | |||
Rat Genome Database
The fold change was calculated between mean values of dominant (n=6) and subordinate (n=6) rats. Positive values are indicative of an increase, and a negative a decrease, in gene expression in dominant relative to subordinate PAG.
The directionalities of all of the significant gene expression changes, derived from expression ratio differences in dominant or submissive animals relative to controls, were compared. As was observed in previously published analyses of the frontal neocortex [41], the majority of the differences were due either to changes of opposite directionality (i.e., up-regulated in one and down-regulated in the other) or to significant changes exhibited in only the dominant or submissive animals (not shown). Only a minor fraction of the significant expression differences between dominant and submissive animals was due to similar changes in directionality, differing only in magnitude. Again, similar to the neocortical changes we previously observed, more than two thirds of the gene expression differences were found exclusively in the submissive animals, and included the specific differences described below.
In order to provide additional statistical stringency to the identification of potential targets, we then analyzed the datasets generated by the SAM-RS analysis of the microarray data for dominance-associated co-regulation of multiple, functionally related genes. The 32 genes identified at a 3.9% FDR were examined for their biological association to Gene Ontology (GO) categories. Using GoMiner software, three independent category structures (biological process, molecular function, and cellular component) based on the 1178 rat genes represented on our microarrays (of which, 923 currently carry GO annotations) were initially constructed and used as Query gene files. The genes identified in this study were then loaded as a “Query Changed Gene File” into the program to examine the distribution of these genes within the GO category structures. All of these queried genes carried current GO annotations. Among the most significant of the functionally clustered genes, several involved in biological processes associated with (1) cholinergic synaptic transmission and (2) small GTPase mediated signal transduction were enriched greater than 2-fold (p<0.05, see Figure 2). Similar to the data observed in neocortical tissue [41], several genes were also significantly clustered in GO categories associated with the molecular functions of growth factor activity.
Figure 2.
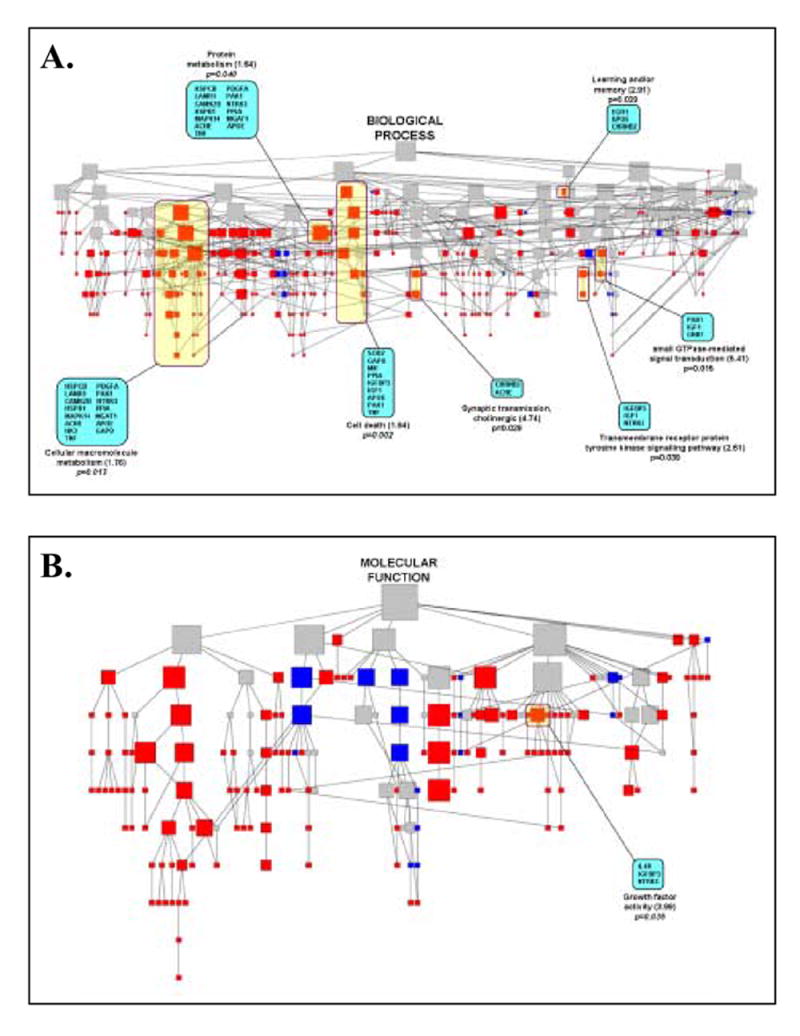
Distribution of asymmetrically regulated genes at various levels of Gene Ontology (GO) categories. The genes identified in this study were imported into the GoMiner program to generate directed acylic graphs (DAG) for the biological processes and molecular functions represented by the changes and were based on current annotations in the GO database. Each node of the DAG represents one GO category at various levels, and the relative size of the node is indicative of the number of genes in each category. The thirty two genes differentially expressed in dominant vs. submissive PAG (panels A, B) were used as queries and loaded into GoMiner to classify these genes into each GO category. The distribution of these genes is represented by a different color at each node. The color of the node indicates enrichment (red), depletion (blue) or no change (gray) of the genes compared with the distribution over all identified genes at that level. Several critical GO categories are labeled. The actual nodes contained in each pathway are depicted in the shaded yellow boxes. The individual statistically significant differentially expressed genes within each pathway are denoted within the shaded blue boxes. For each pathway, the fold enrichment with the statistical significance of the enrichment for each category is shown below.
The expression pattern of two of the major genes involved in nicotinic, cholinergic neurotransmission, identified by stringent SAM analysis of the microarray data and that clustered into a functionally related GO category, were further studied by quantitative real-time RT-PCR. The β2 subunit of the nicotinic acetylcholine receptor (CHRNB2) and the T-subunit of acetylcholinesterase (ACHE) were found to be robustly elevated in submissive animals compared to dominant ones and in close agreement with the microarray results (Figure 3). The expression of CHRNB2 and ACHE was then quantitated in the additional brain regions (described in the Methods Section) by qRT-PCR. No significant expression differences were observed between dominant and subordinate animals in any of these other brain regions examined (Figure 3).
4. Discussion
Identification of molecular pathways associated with the emergence of depression is fundamental to our understanding of this psychiatric disorder, as well as others where depressive affect is a co-morbid symptom [8, 29, 62]. The present studies were undertaken as part of a larger program aimed at utilizing molecular biological technologies with appropriate animal models to give some insight into these molecular mechanisms. We used our established microarray-based platform for stringent analysis of transcriptome changes in the social submissive model that robustly induces 22-kHz USVs, and we have recently identified several necortical pathways that are dysregulated in subordinate animals [41]. Using the same cohort of animals, we have now expanded our studies to include the analysis of the molecular changes in the periaqueductal gray (PAG), a well-established integrator of many emotional responses [5, 61].
Our animal model demonstrates clear physiological and behavioral correlates that parallel aspects of clinical depression [69] and that also relate to well described functions within the PAG [reviewed in 6]; specifically fear/anxiety-related behaviors as measured in this study by defensive posture (freezing), dorsal contacts and bites, as well as emission of 22-kHz USVs indicative of negative affect [11, 12]. The PAG is a critical brain structure involved in fear-related behaviors [46, 5]. The anatomical organization of the PAG and the resultant expression of emotional behavioral correlates is complex [reviewed in 83]. Whereas the ventral PAG appears to be involved in animal models of depression [73], the dorsal PAG has been implicated in animal models of anxiety [59]. However, it is important to note that the PAG plays a key role in many other emotional / motivational states besides negative affective ones such as maternal and predatory behavior [76].
The PAG is organized into at least four main areas: the longitudinal lateral and ventral columns, and the dorsomedial (dmPAG) and dorsolateral (dlPAG) subdivisions. Recent studies in the rat demonstrated that excitation of the lateral PAG produced largely defensive responses, including emission of 22-kHz distress USVs [20]. Conversely, stimulation of the ventral PAG produced submissive behavior (mainly comprised of immobility/freezing behaviors) without emission of USVs [reviewed in 14]. In addition, lesioning the PAG dramatically alters both innate [9] and learned [43] defensive behaviors. Electrical and excitatory amino acid stimulation of the PAG elicits vocalizations in multiple species [28, 34, 35, 42] and, in contrast, lesions there attenuate or abolish these vocalizations and related emotional behaviors [61]. Specifically, kainic acid injections into the caudal third of the PAG evoked 22-kHz vocalizations, in addition to the freezing behavior [20]. Freezing behavior and 22-kHz USVs critically depend on the PAG: lesions of the PAG abolish this behavior, and electrical or chemical stimulation of the PAG elicit these behaviors, even at the lowest concentration of drug / electrical stimulation. In addition, i) electrical stimulation of the PAG in humans produces an intense negative affective state of anxiety [77], ii) lesions of the PAG abolish emotional functioning [64], and iii) brain imaging studies reveal that PAG activation is strongly related to feelings of intense sadness [17].
Ontological analysis of the microarray data derived in these studies revealed significant enrichment in several gene categories related to overall intracellular metabolism, cell death, learning and memory, receptor protein tyrosine kinase signaling, small GTPase-mediated signal transduction, and cholinergic synaptic transmission (Figure 2A, B). Social defeat robustly elicits 22-kHz USVs, which have been show to index a negative affective state in rats akin to anxiety/depression, and 22-kHz USVs have been shown to be primarily controlled by the mesolimbic cholinergic system [10]. Several lines of evidence implicate the brain cholinergic system in negative affectivity and depression. As initially proposed by Janowsky and colleagues in the early 1970s [31], dysfunction of cholinergic transmission (hyperactivity/hypersensitivity) is likely involved in the pathophysiology of depression. In most animal models, treatment with centrally acting cholinomimetics consistently produces behavioral inhibitory effects including lethargy and hypoactivity, HPA axis activation, decreases in self-stimulation [31, 32, 33], increases in behavioral despair in the forced swim test, and anhedonia [67]. Treatment with anticholinergic drugs generally reverses these induced phenomena. Recently, it has been shown that administration of the anticholinergic agent scopolamine in humans produces a rapid and robust alleviation of depressive symptoms [24].
The differential expression of both of the genes representative of the cholinergic synaptic transmission category (CHRNB2 and ACHE) were verified by qRT-PCR. To address the region-specificity of these changes, CHRNB2 and ACHE expression was also quantitated in seven additional brain regions; namely, basal ganglia, temporal amygdaloid area, hippocampus, diencephalon (incl. thalamus & hypothalamus), mesencephalon (minus the PAG), cerebellum, and brainstem. There were no significant expression differences in either gene in any of the additional brain regions between dominant and subordinate animals. The PAG-specific dysregulation of the nicotinic pathway in this model is particularly intriguing.
Nicotine has antidepressant properties in animal models [79, 71, 22, 80]. This, along with the observation that β2-nAchR knockout mice are more prone to learned helplessness [13], emphasizes that there is a strong relationship between nicotinic receptor modulation and mood control. Nicotine, administered acutely and chronically, shows an antidepressant-like effect on the behavior of FSL rats (bred for cholinergic hypersensitivity) in the forced swim test [79], implicating the involvement of central nicotinic receptors in the depressive characteristics of the FSL rats. Interestingly, these rats also demonstrated selective α4β2 nicotinic receptor subtype binding of [3H]cytisine [23] in various discrete brain regions, including midbrain regions (indicative of increased receptor densities). These effects were blocked by preadministration of the nicotinic antagonist mecamylamine. [80]. Similar effects were observed using SIB-1508Y, an α4β2-specific nAchR agonist, in the learned helplessness rat model of depression [22]. It also seems clear from our data that, although the major focus of central cholinergic involvement in affective disorders has traditionally been on muscarinic hyperactivity, the potential role of nicotinic mechanisms must also be considered [reviewed in 72].
Although it is tempting to speculate on the use of cholinergic hypersensitivity as a trait marker (cause) vs. a state marker (consequence), the data suggest that the mechanism for this hypersensitivity is likely an early event in the onset of the disease, and these earlier events are mediated, at least in part, by nicotinic rather than muscarinic mechanisms. These data further suggest that the development of specific nicotinic agonists selectively targeting the β2 subunit of the receptor will have therapeutic benefits in depressive disorders.
The second gene expressed predominantly in the PAG of submissive animals as compared to the dominant animal of the pair was the T-subunit of acetylcholinesterase (ACHE). Acetylcholinesterase is a multisubunit enzyme complex responsible for the hydrolysis of synaptically released acetylcholine and termination of cholinergic signaling. Our results are difficult to reconcile based on what is currently known regarding cholinergic hypersensitivity in depressed animals. However, the presence of multiple ACHE isoforms allows for alternative possibilities, perhaps unrelated to simple neurotransmitter hydrolysis. These ACHE isoforms result from the differential assembly of structural and catalytic enzymatic subunits, the latter of which arise from alternative splicing of a single gene giving rise to ACHE splice variants containing either the T subunit and/or the hydrophobic H subunit [reviewed in 47, 74]. Stress-induced alternative splicing of acetylcholinesterase in the hippocampus has been demonstrated to alter both its ability to associate with the neuronal membrane and interact with the structural subunit of the active enzyme [60]. There is also mounting evidence, especially from other tissues, that ACHE may function in the regulation of cellular differentiation and adhesion [25]. This potentially behaviorally-inducible dysfunction suggests that the increased ACHE expression we observed in our model following social subordination, especially splice variants containing the T subunit (exon6) [45], may be explained by mechanisms other than or in addition to acetylcholine hydrolysis. Of the submissive behaviors elicited in rats, the most robust of these behaviors and the one most closely linked to negative affectivity is 22-kHz USVs. The key neurotransmitter for the generation of this vocalization is acetylcholine [10], and the PAG is part of the essential neural circuit of these vocalizations [35]. Although speculative, changes in acetylcholinesterase T subunit may reflect a change in affective set point by increasing tonic levels of acetylcholine or serve as a switching mechanism from low to high defensive behavioral responses [76], and therapies that alter the expression or activity of this subunit may provide novel treatment for depressive disorders.
The relationship between muscarinic cholinergic hyperactivity and depression has been supported by many clinical and experimental observations over the past several decades. GoMiner analysis of the gene changes obtained in our social dominance model did not reveal any genes related to this pathway. However, using Gene Set Enrichment Analysis (GSEA) [75], this geneset was one of the more highly enriched genesets identified in the subordinate animals. GSEA has similar advantages to that of GoMiner-based ontological analysis, in that GSEA extends the interpretation of large-scale experiments from the identification of single genes to the identification of pathways and processes, and focuses on gene sets which tend to be more reproducible and interpretable. However, unlike GoMiner, GSEA analysis considers all of the genes in an experiment rather than only those above an arbitrary cutoff in terms of fold-change or significance.
There are, however, caveats that must be addressed. The a priori design of well-defined genesets is paramount to the success of analyses like GSEA, and optimization of geneset design is a continually evolving process. We chose initially to use the GO Consortium’s definitions; the identical ones used in the GoMiner algorithm. Thus, this approach [recently reviewed in 38] allowed us to build in quality control measures to assure proper output. Secondly, although the pathways identified by this approach will be difficult to validate directly (e.g., by traditional methods such as qRT-PCR and in situ hybridization studies) because there are few individually statistically significant gene changes within the overall geneset. That is, the geneset is a statistically significant entity, but the individual genes within the set are not. Clearly, more complex pharmacological and/or molecular approaches will be needed.
Taken as a whole, these data indicate that emotional stressors that can lead to the cascade of neurochemical processes that result in depression can evoke many gene expression changes in the PAG, a critical brain region mediating emotional integration.
Acknowledgments
This research was supported by National Institute of Mental Health Grant R21 MH069762 to Roger A. Kroes and by the Hope for Depression Research Foundation, New York, NY, and The Falk Foundation, Chicago, IL to Joseph R. Moskal.
Abbreviations
- GO
Gene ontology
- USV
Ultrasonic vocalization
- SAM
Significance Analysis of Microarrays
- PAG
periaqueductal gray
- FDR
false discovery rate
- qRT-PCR
quantitative real time polymerase chain reaction
- LOWESS
Locally Weighted Scatterplot Smoothing
- DAG
directed acylic graph
Footnotes
Publisher's Disclaimer: This is a PDF file of an unedited manuscript that has been accepted for publication. As a service to our customers we are providing this early version of the manuscript. The manuscript will undergo copyediting, typesetting, and review of the resulting proof before it is published in its final citable form. Please note that during the production process errors may be discovered which could affect the content, and all legal disclaimers that apply to the journal pertain.
References
- 1.Adamec RE, Blundell J, Burton P. Phosphorylated cyclic AMP response element binding protein expression induced in the periaqueductal gray by predator stress: its relationship to the stress experience, behavior and limbic neural plasticity. Prog Neuropsychopharmacol Biol Psychiatry. 2003;27:1243–1267. doi: 10.1016/j.pnpbp.2003.09.017. [DOI] [PubMed] [Google Scholar]
- 2.Agid O, Kohn Y, Lerer B. Environmental stress and psychiatric illness. Biomed Pharmacother. 2000;54:135–141. doi: 10.1016/S0753-3322(00)89046-0. [DOI] [PubMed] [Google Scholar]
- 3.Bandler R, Depaulis A. Elicitation of intraspecific defense reactions in the rat from midbrain periaqueductal grey by microinjection of kainic acid without neurotoxic effects. Neurosci Lett. 1988;88:291–296. doi: 10.1016/0304-3940(88)90226-1. [DOI] [PubMed] [Google Scholar]
- 4.Bandler R, Keay KA. Columnar organization in the midbrain periaqueductal gray and the integration of emotional expression. Prog Brain Res. 1996;107:285–300. doi: 10.1016/s0079-6123(08)61871-3. [DOI] [PubMed] [Google Scholar]
- 5.Bandler R, Shipley M. Columnar organization in the midbrain periaqueductal gray - modules for emotional expression. Trends Neurosci. 1994;17:379–389. doi: 10.1016/0166-2236(94)90047-7. [DOI] [PubMed] [Google Scholar]
- 6.Behbehani MM. Functional characteristics of the midbrain periaqueductal gray. Prog Neurobiol. 1995;46:575–605. doi: 10.1016/0301-0082(95)00009-k. [DOI] [PubMed] [Google Scholar]
- 7.Beitz AJ. The organization of afferent projections to the midbrain periaqueductal gray of the rat. Neuroscience. 1982;7:133–159. doi: 10.1016/0306-4522(82)90157-9. [DOI] [PubMed] [Google Scholar]
- 8.Berton O, Nestler EJ. New approaches to antidepressant drug discovery: beyond monoamines. Nat Rev Neurosci. 2006;7:137–151. doi: 10.1038/nrn1846. [DOI] [PubMed] [Google Scholar]
- 9.Blanchard DC, Lee EMC, Williams G, Blanchard RJ. Taming of Rattus norvegicus by lesions of the mesencephalic central gray. Physiol Psych. 1981;9:157–163. [Google Scholar]
- 10.Brudzynski SM. Pharmacological and behavioral characteristics of 22 kHz alarm calls in rats. Neurosci Biobehav Rev. 2001;25:611–617. doi: 10.1016/s0149-7634(01)00058-6. [DOI] [PubMed] [Google Scholar]
- 11.Brudzynski SM, Holland G. Acoustic characteristics of air puff-induced 22-kHz alarm calls in direct recordings. Neurosci Biobehav Rev. 2005;29(8):1169–1180. doi: 10.1016/j.neubiorev.2005.04.007. [DOI] [PubMed] [Google Scholar]
- 12.Burgdorf J, Knutson B, Panksepp J, Shippenberg T. Evaluation of rat ultrasonic vocalizations as predictors of the conditioned aversive effects of drugs. Psychopharmacology. 2001;155:35–42. doi: 10.1007/s002130100685. [DOI] [PubMed] [Google Scholar]
- 13.Caldarone BJ, Harrist A, Cleary MA, Beech RD, King SL, Picciotto MR. High-affinity nicotinic acetylcholine receptors are required for antidepressant effects of amitriptyline on behavior and hippocampal cell proliferation. Biol Psychiatry. 2004;56:657–664. doi: 10.1016/j.biopsych.2004.08.010. [DOI] [PubMed] [Google Scholar]
- 14.Carrive P. The periaqueductal gray and defensive behavior: functional representation and neuronal organization. Behav Brain Res. 1993;58:27–47. doi: 10.1016/0166-4328(93)90088-8. [DOI] [PubMed] [Google Scholar]
- 15.Carrive P, Bandler R, Dampney RA. Somatic and autonomic integration in the midbrain of the unanesthetized decerebrate cat: a distinctive pattern evoked by excitation of neurones in the subtentorial portion of the midbrain periaqueductal grey. Brain Res. 1989;483:251–258. doi: 10.1016/0006-8993(89)90169-8. [DOI] [PubMed] [Google Scholar]
- 16.Churchill GA. Fundamentals of experimental design for cDNA microarrays. Nat Genet. 2002;32(Suppl):490–495. doi: 10.1038/ng1031. [DOI] [PubMed] [Google Scholar]
- 17.Damasio AR, Grabowski TJ, Bechara A, Damasio H, Ponto LL, Parvizi J, Hichwa RD. Subcortical and cortical brain activity during the feeling of self-generated emotions. Nat Neurosci. 2000;3(10):1049–1056. doi: 10.1038/79871. [DOI] [PubMed] [Google Scholar]
- 18.de Jong JG, van der Vegt BJ, Buwalda B, Koolhaas JM. Social environment determines the long-term effects of social defeat. Physiol Behav. 2005;84:87–95. doi: 10.1016/j.physbeh.2004.10.013. [DOI] [PubMed] [Google Scholar]
- 19.De Oca BM, DeCola JP, Maren S, Fanselow MS. Distinct regions of the periaqueductal gray are involved in the acquisition and expression of defensive responses. J Neurosci. 1998;18:3426–3432. doi: 10.1523/JNEUROSCI.18-09-03426.1998. [DOI] [PMC free article] [PubMed] [Google Scholar]
- 20.Depaulis A, Keay KA, Bandler R. Longitudinal neuronal organization of defensive reactions in the midbrain periaqueductal gray region of the rat. Exp Brain Res. 1992;90:307–318. doi: 10.1007/BF00227243. [DOI] [PubMed] [Google Scholar]
- 21.Dobbin K, Simon R. Comparison of microarray designs for class comparison and class discovery. Bioinformatics. 2002;18(11):1438–1445. doi: 10.1093/bioinformatics/18.11.1438. [DOI] [PubMed] [Google Scholar]
- 22.Ferguson SM, Brodkin JD, Lloyd GK, Menzaghi F. Antidepressant-like effects of the subtype-selective nicotinic acetylcholine receptor agonist, SIB-1508Y, in the learned helplessness rat model of depression. Psychopharmacology (Berl) 2000;152:295–303. doi: 10.1007/s002130000531. [DOI] [PubMed] [Google Scholar]
- 23.Flores CM, Rogers SW, Pabreza LA, Wolfe BB, Kellar KJ. A subtype of nicotinic cholinergic receptor in rat brain is composed of alpha 4 and beta 2 subunits and is up-regulated by chronic nicotine treatment. Mol Pharmacol. 1992;41:31–37. [PubMed] [Google Scholar]
- 24.Furey ML, Drevets WC. Antidepressant efficacy of the antimuscarinic drug scopolamine: a randomized, placebo-controlled clinical trial. Arch Gen Psychiatry. 2006;63(10):1121–1129. doi: 10.1001/archpsyc.63.10.1121. [DOI] [PMC free article] [PubMed] [Google Scholar]
- 25.Genever PG, Birch MA, Brown E, Skerry TM. Osteoblast-derived acetylcholinesterase: a novel mediator of cell-matrix interactions in bone? Bone. 1999;24:297–303. doi: 10.1016/s8756-3282(98)00187-2. [DOI] [PubMed] [Google Scholar]
- 26.Greden JF. Unmet need: what justifies the search for a new antidepressant? J Clin Psychiatry. 2002;63(Suppl 2):3–7. [PubMed] [Google Scholar]
- 27.Grofova I, Ottersen OP, Rinvik E. Mesencephalic and diencephalic afferents to the superior colliculus and periaqueductal gray substance demonstrated by retrograde axonal transport of horseradish peroxidase in the cat. Brain Res. 1978;146:205–220. doi: 10.1016/0006-8993(78)90969-1. [DOI] [PubMed] [Google Scholar]
- 28.Herman BH, Panksepp J. Ascending endorphin inhibition of distress vocalization. Science. 1981;211(4486):1060–1062. doi: 10.1126/science.7466377. [DOI] [PubMed] [Google Scholar]
- 29.Holtzheimer PE, 3rd, Nemeroff CB. Future prospects in depression research. Dialogues Clin Neurosci. 2006;8:175–189. doi: 10.31887/DCNS.2006.8.2/pholtzheimer. [DOI] [PMC free article] [PubMed] [Google Scholar]
- 30.Hunsperger RW, Bucher VM. Affective behaviour produced by electrical stimulation in the forebrain and brainstem of the cat. Prog Brain Res. 1967;27:103–127. doi: 10.1016/s0079-6123(08)63095-2. [DOI] [PubMed] [Google Scholar]
- 31.Janowsky DS, El-Yousef MK, Davis JM, Sekerke HJ. A cholinergic-adrenergic hypothesis of mania and depression. Lancet. 1972;2:632–635. doi: 10.1016/s0140-6736(72)93021-8. [DOI] [PubMed] [Google Scholar]
- 32.Janowsky DS, Risch SC. Cholinomimetic and anticholinergic drugs used to investigate an acetylcholine hypothesis of affective disorder and stress. Drug Dev Res. 1984;4:125–142. [Google Scholar]
- 33.Janowsky DS, Risch SC. Role of acetylcholine mechanisms in the affective disorders. In: Meltzer HY, editor. Psychopharmacology. The third generation of progress. New York: Raven Press; 1987. pp. 527–534. [Google Scholar]
- 34.Jürgens U. The role of the periaqueductal grey in vocal behaviour. Behav Brain Res. 1994;62:107–117. doi: 10.1016/0166-4328(94)90017-5. [DOI] [PubMed] [Google Scholar]
- 35.Jürgens U. Neuronal control of mammalian vocalization, with special reference to the squirrel monkey. Naturwissenschaften. 1998;85:376–388. doi: 10.1007/s001140050519. [DOI] [PubMed] [Google Scholar]
- 36.Keay KA, Bandler R. Distinct central representations of inescapable and escapable pain: observations and speculation. Exp Physiol. 2002;87:275–279. doi: 10.1113/eph8702355. [DOI] [PubMed] [Google Scholar]
- 37.Kessler RC, Chiu WT, Demler O, Merikangas KR, Walters EE. Prevalence, severity, and comorbidity of 12-month DSM-IV disorders in the National Comorbidity Survey Replication. Arch Gen Psychiatry. 2005;62(6):617–27. doi: 10.1001/archpsyc.62.6.617. [DOI] [PMC free article] [PubMed] [Google Scholar]
- 38.Khatri P, Draghici S. Ontological analysis of gene expression data: current tools, limitations, and open problems. Bioinformatics. 2005;21:3587–3595. doi: 10.1093/bioinformatics/bti565. [DOI] [PMC free article] [PubMed] [Google Scholar]
- 39.Knapp RJ, Goldenberg R, Shuck C, Cecil A, Watkins J, Miller C, Crites G, Malatynska E. Antidepressant activity of memory-enhancing drugs in the reduction of submissive behavior model. Eur J Pharmacol. 2002;440:27–35. doi: 10.1016/s0014-2999(02)01338-9. [DOI] [PubMed] [Google Scholar]
- 40.Kollack-Walker S, Watson SJ, Akil H. Social stress in hamsters: defeat activates specific neurocircuits within the brain. J Neurosci. 1997;17:8842–8855. doi: 10.1523/JNEUROSCI.17-22-08842.1997. [DOI] [PMC free article] [PubMed] [Google Scholar]
- 41.Kroes RA, Panksepp J, Burgdorf J, Otto NJ, Moskal JR. Modeling depression: social dominance-submission gene expression patterns in rat neocortex. Neuroscience. 2006;137:37–49. doi: 10.1016/j.neuroscience.2005.08.076. [DOI] [PubMed] [Google Scholar]
- 42.Kyuhou S, Gemba H. Two vocalization-related subregions in the midbrain periaqueductal gray of the guinea pig. NeuroReport. 1998;9:1607–1610. doi: 10.1097/00001756-199805110-00064. [DOI] [PubMed] [Google Scholar]
- 43.LeDoux JE, Iwata J, Cicchetti P, Reis DJ. Different projections of the central amygdaloid nucleus mediate autonomic and behavioral correlates of conditioned fear. J Neurosci. 1988;8:2517–2529. doi: 10.1523/JNEUROSCI.08-07-02517.1988. [DOI] [PMC free article] [PubMed] [Google Scholar]
- 44.Lee PD, Sladek R, Greenwood CM, Hudson TJ. Control genes and variability absence of ubiquitous reference transcripts in diverse mammalian expression studies. Genome Res. 2002;12(2):292–297. doi: 10.1101/gr.217802. [DOI] [PMC free article] [PubMed] [Google Scholar]
- 45.Legay C, Bon S, Vernier P, Coussen F, Massoulie J. Cloning and expression of a rat acetylcholinesterase subunit: generation of multiple molecular forms and complementarity with a Torpedo collagenic subunit. J Neurochem. 1993;60:337–346. doi: 10.1111/j.1471-4159.1993.tb05856.x. [DOI] [PubMed] [Google Scholar]
- 46.Libman JM, Mayer DJ, Liebeskind JC. Mesencephalic central gray lesions and fear motivated behavior in rats. Brain Res. 1970;23:353–370. doi: 10.1016/0006-8993(70)90062-4. [DOI] [PubMed] [Google Scholar]
- 47.Li Y, Camp S, Rachinsky TL, Getman D, Taylor P. Gene structure of mammalian acetylcholinesterase. Alternative exons dictate tissue-specific expression. J Biol Chem. 1991;266:23083–23090. [PubMed] [Google Scholar]
- 48.Lockhart DJ, Dong H, Byrne MC, Follettie MT, Gallo MV, Chee MS, Mittmann M, Wang C, Kobayashi M, Horton H, Brown EL. Expression monitoring by hybridization to high-density oligonucleotide arrays. Nat Biotechnol. 1996;14:1675–1680. doi: 10.1038/nbt1296-1675. [DOI] [PubMed] [Google Scholar]
- 49.Lopez JF, Akil H, Watson SJ. Neural circuits mediating stress. Biol Psychiatry. 1999;46:1461–1471. doi: 10.1016/s0006-3223(99)00266-8. [DOI] [PubMed] [Google Scholar]
- 50.Malatynska E, Knapp RJ. Dominant-submissive behavior as models of mania and depression. Neurosci Biobehav Rev. 2005;29:715–737. doi: 10.1016/j.neubiorev.2005.03.014. [DOI] [PubMed] [Google Scholar]
- 51.Malatynska E, Rapp R, Harrawood D, Tunnicliff G. Submissive behavior in mice as a test for antidepressant drug activity. Pharmacol Biochem Behav. 2005;82:306–313. doi: 10.1016/j.pbb.2005.08.020. [DOI] [PubMed] [Google Scholar]
- 52.Markou A, editor. Neurosci Biobehav Rev. 45. Vol. 29. 2005. Special Issue: Animal Models of Depression and Antidepressant Activity; pp. 501–909. [Google Scholar]
- 53.Mayberg HS. Depression: A Neuropsychiatric perspective. In: Panksepp J, editor. Textbook of Biological Psychiatry. New Jersey: Wiley; 2004. pp. 197–229. [Google Scholar]
- 54.Mitchell PJ, Fletcher A. Venlafaxine exhibits pre-clinical antidepressant activity in the resident–intruder social interaction paradigm. Neuropharmacology. 1993;32:1001–1009. doi: 10.1016/0028-3908(93)90065-b. [DOI] [PubMed] [Google Scholar]
- 55.Morrant JCA. Depression and Some Newer Antidepressants. BC Med J. 1997;39:636–640. [Google Scholar]
- 56.Moskal JR, Kroes RA, Otto NJ, Rahimi O, Claiborne BJ. Distinct patterns of gene expression in the left and right hippocampal formation of developing rats. Hippocampus. 2006;16(8):629–634. doi: 10.1002/hipo.20198. [DOI] [PubMed] [Google Scholar]
- 57.Nemeroff CB. The neurobiology of depression. Sci Am. 1998;278:42–49. doi: 10.1038/scientificamerican0698-42. [DOI] [PubMed] [Google Scholar]
- 58.Nestler EJ, Gould E, Manji H, Buncan M, Duman RS, Greshenfeld HK, Hen R, Koester S, Lederhendler I, Meaney M, Robbins T, Winsky L, Zalcman S. Preclinical models: status of basic research in depression. Biol Psychiatry. 2002;52:503–528. doi: 10.1016/s0006-3223(02)01405-1. [DOI] [PubMed] [Google Scholar]
- 59.Netto CF, Guimaraes FS. Anxiogenic effect of cholecystokinin in the dorsal periaqueductal gray. Neuropsychopharmacology. 2004;29(1):101–107. doi: 10.1038/sj.npp.1300334. [DOI] [PubMed] [Google Scholar]
- 60.Nijholt I, Farchi N, Kye M, Sklan EH, Shoham S, Verbeure B, Owen D, Hochner B, Spiess J, Soreq H, Blank T. Stress-induced alternative splicing of acetylcholinesterase results in enhanced fear memory and long-term potentiation. Mol Psychiatry. 2004;9:174–183. doi: 10.1038/sj.mp.4001446. [DOI] [PubMed] [Google Scholar]
- 61.Panksepp J. Affective Neuroscience: The foundations of human and animal emotions. New York: Oxford University Press; 1998. p. 466. [Google Scholar]
- 62.Panksepp J. Textbook of Biological Psychiatry. Hoboken, NJ: Wiley; 2004. p. 699. [Google Scholar]
- 63.Panksepp J, Burgdorf J, Beinfeld M, Kroes R, Moskal JR. Regional brain cholecystokinin changes as a function of friendly and aggressive social interactions in rats. Brain Res. 2004;1025:75–84. doi: 10.1016/j.brainres.2004.07.076. [DOI] [PubMed] [Google Scholar]
- 64.Parvizi J, Damasio AR. Neuroanatomical correlates of brainstem coma. Brain. 2003;126:1524–1536. doi: 10.1093/brain/awg166. [DOI] [PubMed] [Google Scholar]
- 65.Paxinos G, Watson C. The Rat Brain in Stereotaxic Coordinates. 4. New York: Academic Press; 1998. [Google Scholar]
- 66.Price JS, Sloman L, Gardner R, Gilbert P, Rhode P. The social competition model of depression. Br J Psychiatry. 1994;164:309–315. doi: 10.1192/bjp.164.3.309. [DOI] [PubMed] [Google Scholar]
- 67.Pucilowski O, Overstreet DH, Rezvani AH, Janowsky DS. Chronic mild stress-induced anhedonia: greater effect in a genetic rat model of depression. Physiol Behav. 1993;54:1215–1220. doi: 10.1016/0031-9384(93)90351-f. [DOI] [PubMed] [Google Scholar]
- 68.Robins LN, Regier DA, editors. Psychiatric Disorders in America: The Epidemiologic Catchment Area Study. New York: The Free Press; 1990. p. 449. [Google Scholar]
- 69.Ruis MA, te Brake JH, Buwalda B, De Boer SF, Meerlo P, Korte SM, Blokhuis HJ, Koolhaas JM. Housing familiar male wildtype rats together reduces the long-term adverse behavioural and physiological effects of social defeat. Psychoneuroendocrinology. 1999;24:285–300. doi: 10.1016/s0306-4530(98)00050-x. [DOI] [PubMed] [Google Scholar]
- 70.Rygula R, Abumaria N, Flugge G, Fuchs E, Ruther E, Havemann-Reinecke U. Anhedonia and motivational deficits in rats: impact of chronic social stress. Behav Brain Res. 2005;162:127–134. doi: 10.1016/j.bbr.2005.03.009. [DOI] [PubMed] [Google Scholar]
- 71.Semba J, Mataki C, Yamada S, Nankai M, Toru M. Antidepressantlike effects of chronic nicotine on learned helplessness paradigm in rats. Biol Psychiatry. 1998;43:389–391. doi: 10.1016/s0006-3223(97)00477-0. [DOI] [PubMed] [Google Scholar]
- 72.Shytle RD, Silver AA, Lukas RJ, Newman MB, Sheehan DV, Sanberg PR. Nicotinic acetylcholine receptors as targets for antidepressants. Mol Psychiatry. 2002;7:525–535. doi: 10.1038/sj.mp.4001035. [DOI] [PubMed] [Google Scholar]
- 73.Siuciak JA, Lewis DR, Wiegand SJ, Lindsay RM. Antidepressant-like effect of brain-derived neurotrophic factor (BDNF) Pharmacol Biochem Behav. 1997;56(1):131–137. doi: 10.1016/S0091-3057(96)00169-4. [DOI] [PubMed] [Google Scholar]
- 74.Small DH, Michaelson S, Sberna G. Non-classical actions of cholinesterases: role in cellular differentiation, tumorigenesis and Alzheimer’s disease. Neurochem Int. 1996;28:453–483. doi: 10.1016/0197-0186(95)00099-2. [DOI] [PubMed] [Google Scholar]
- 75.Subramanian A, Tamayo P, Mootha VK, Mukherjee S, Ebert BL, Gillette MA, Paulovich A, Pomeroy SL, Golub TR, Lander ES, Mesirov JP. Gene set enrichment analysis: a knowledge-based approach for interpreting genome-wide expression profiles. Proc Natl Acad Sci U S A. 2005;102:15278–15279. doi: 10.1073/pnas.0506580102. [DOI] [PMC free article] [PubMed] [Google Scholar]
- 76.Sukikara MH, Mota-Ortiz SR, Baldo MV, Felicio LF, Canteras NS. A role for the periaqueductal gray in switching adaptive behavioral responses. J Neurosci. 2006;26:2583–9. doi: 10.1523/JNEUROSCI.4279-05.2006. [DOI] [PMC free article] [PubMed] [Google Scholar]
- 77.Tasker RR. Identification of pain processing systems by electrical stimulation of the brain. Hum Neurobiol. 1982;1(4):261–272. [PubMed] [Google Scholar]
- 78.Takahashi LK, Thomas DA, Barfield RJ. Analysis of ultrasonic vocalizations emitted by residents during aggressive encounters among rats (Rattus norvegicus) J Comp Psychol. 1983;97:207–212. [PubMed] [Google Scholar]
- 79.Tizabi Y, Overstreet DH, Rezvani AH, Louis VA, Clark E, Jr, Janowsky DS, Kling MA. Antidepressant effects of nicotine in an animal model of depression. Psychopharmacology (Berl) 1999;142:193–199. doi: 10.1007/s002130050879. [DOI] [PubMed] [Google Scholar]
- 80.Tizabi Y, Rezvani1 AH, Russell LT, Tyler KY, Overstreet DH. Depressive characteristics of FSL rats: involvement of central nicotinic receptors. Pharmacol Biochem Behav. 2000;66:73–77. doi: 10.1016/s0091-3057(00)00236-7. [DOI] [PubMed] [Google Scholar]
- 81.Tornatzky W, Miczek KA. Long-term impairment of autonomic circadian rhythms after brief intermittent social stress. Physiol Behav. 1993;53:983–993. doi: 10.1016/0031-9384(93)90278-n. [DOI] [PubMed] [Google Scholar]
- 82.Tusher VG, Tibshirani R, Chu G. Significance analysis of microarrays applied to the ionizing radiation response. Proc Natl Acad Sci U S A. 2001;98:5116–5121. doi: 10.1073/pnas.091062498. [DOI] [PMC free article] [PubMed] [Google Scholar]
- 83.Vianna DM, Graeff FG, Landeira-Fernandez J, Brandao ML. Lesion of the ventral periaqueductal gray reduces conditioned fear but does not change freezing induced by stimulation of the dorsal periaqueductal gray. Learn Mem. 2001;8:164–169. doi: 10.1101/lm.36101. [DOI] [PMC free article] [PubMed] [Google Scholar]
- 84.van de Wiel MA. Significance analysis of microarrays using rank scores. Kwantitatieve Methoden. 2004;71:25–37. [Google Scholar]
- 85.Willner P, Towell A, Sampson D, Sophokleous S, Muscat R. Reduction of sucrose preference by chronic unpredictable mild stress, and its restoration by a tricyclic antidepressant. Psychopharmacology (Berl) 1987;93:358–364. doi: 10.1007/BF00187257. [DOI] [PubMed] [Google Scholar]
- 86.Willner P. Animal models of depression: an overview. Pharmacol Ther. 1990;45:425–455. doi: 10.1016/0163-7258(90)90076-e. [DOI] [PubMed] [Google Scholar]
- 87.Willner P, D’Aquila PS, Coventry T, Brain P. Loss of social status: preliminary evaluation of a novel animal model of depression. J Psychopharm. 1995;9:207–213. doi: 10.1177/026988119500900302. [DOI] [PubMed] [Google Scholar]
- 88.Willner P, Mitchell PJ. The validity of animal models of predisposition to depression. Behav Pharmacol. 2002;13:169–188. doi: 10.1097/00008877-200205000-00001. [DOI] [PubMed] [Google Scholar]
- 89.Zeeberg BR, Feng W, Wang G, Wang MD, Fojo AT, Sunshine M, Narasimhan S, Kane DW, Reinhold WC, Lababidi S, Bussey KJ, Riss J, Barrett JC, Weinstein JN. GoMiner: a resource for biological interpretation of genomic and proteomic data. Genome Biol. 2003;4(4):R28. doi: 10.1186/gb-2003-4-4-r28. [DOI] [PMC free article] [PubMed] [Google Scholar]