

Abstract
Using a combined master equation and kinetic cluster approach, we investigate RNA pseudoknot folding and unfolding kinetics. The energetic parameters are computed from a recently developed Vfold model for RNA secondary structure and pseudoknot folding thermodynamics. The folding kinetics theory is based on the complete conformational ensemble, including all the native-like and non-native states. The predicted folding and unfolding pathways, activation barriers, Arrhenius plots, and rate-limiting steps lead to several findings. First, for the PK5 pseudoknot, a misfolded 5′ hairpin emerges as a stable kinetic trap in the folding process, and the detrapping from this misfolded state is the rate-limiting step for the overall folding process. The calculated rate constant and activation barrier agree well with the experimental data. Second, as an application of the model, we investigate the kinetic folding pathways for hTR (human Telomerase RNA) pseudoknot. The predicted folding and unfolding pathways not only support the proposed role of conformational switch between hairpin and pseudoknot in hTR activity, but also reveal molecular mechanism for the conformational switch. Furthermore, for an experimentally studied hTR mutation, whose hairpin intermediate is destabilized, the model predicts a long-lived transient hairpin structure, and the switch between the transient hairpin intermediate and the native pseudoknot may be responsible for the observed hTR activity. Such finding would help resolve the apparent contradiction between the observed hTR activity and the absence of a stable hairpin.
Keywords: Kinetics, RNA pseudoknot, Activation energy, Misfolded state, Telomerase
Introduction
An RNA pseudoknot structure is formed through base pairing between loop and other regions of RNA such as loops or unpaired 5′ or 3′ ends. The simplest RNA pseudoknot is the H (hairpin)-type pseudoknot. As shown in Figs. 1a and b, an H-pseudoknot consists of two stems S1 and S2 and two loops L1 and L2 that span across the deep (major) groove of S2 and the shallow (minor) groove of S1, respectively. RNA pseudoknots play critical roles in a wide range of biological functions from ribosomal frameshifting1–7 to human telomerase RNA (hTR) activity8–15 and hepatitis delta virus (HDV) ribozyme functions.16–18 Several experiments have clearly demonstrated the essential kinetic roles in pseudoknot functions. For example, in ribosomal pausing at mRNA slippery sites and the -1 frameshifting,4 where pseudoknot plays a central role, the time scale of pseudoknot formation/disruption is one of the key factors to determine the frameshifting effciency.1,3 In hTR functions, genetic and biochemical experiments revealed the critical functional role of a molecular switch between hairpin and pseudoknot of hTR.9,10 For instance, mutants that alter the hairpin-pseudoknot equilibrium would cause hTR to lose activity, resulting in disease such as dyskeratosis congenita.9–11,14,15 On the other hand, in a separate mutational study, a hairpin-destabilizing mutation was found to retain hTR activity, raising questions on the functional role of hairpin-pseudoknot switch.13 It would be intriguing to understand whether such a mutation can possibly result in a kinetically (instead of thermodynamically) populated hairpin intermediate state. The ability to quantitatively predict pseudoknot folding kinetics from the nucleotide sequence would be essential for the deconvolution of the molecular mechanisms of the functions of pseudoknots such as hTR.
Figure 1.
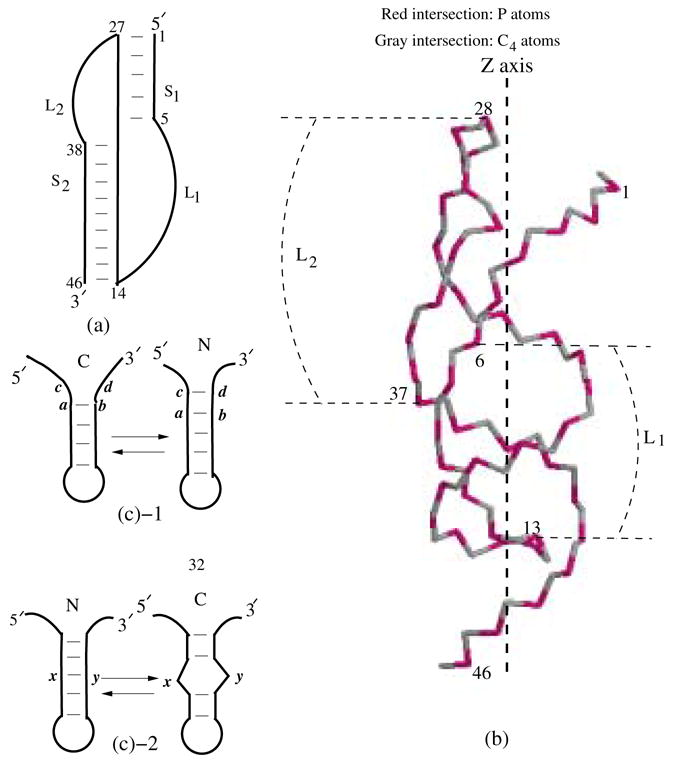
A simplified secondary structure representation (a) and a C4 and P virtual bond representations32,62 (b) for a pseudoknot consists of two helix stems (S 1 and S 2) and two loops (L1 and L2). (c) Kinetic moves between two kinetically adjacent conformation states are defined as the formation and breaking of a base stack (c-1) or a stacked base pair (c-2).
Quantitative predictions for RNA secondary structures and secondary structure folding thermodynamics have been quite successful.19–25 One of the possible limiting factors for predicting RNA folding has been the treatment of RNA pseudoknots. Recently, several computational models have been developed for pseudoknot structural prediction26–29 and pseudoknot folding thermodynamics.30–32 In particular, based on the rigorous statistical mechanics and a virtual bond model for pseudoknot structures, we recently calculated and tabulated pseudoknot loop entropy parameters for different pseudoknots. Using the loop entropy parameter table, we can predict free energy landscape for RNA pseudoknots, including the native structure and all the possible thermodynamic intermediates and their stabilities. However, despite the successful development of the folding thermodynamic stability and structural prediction models, there are relatively few folding kinetics models. Besides Monte Carlo33 and analytical34 kinetics calculations for RNA secondary structures, several computer simulation studies have been performed to analyze the dynamic behavior of hTR pseudoknot35 and the folding pathway of HDV ribozyme.36 These simulational studies provided useful insights into pseudoknot functions. For example, the simulated dynamic behaviors of hTR pseudoknot provided information about the structural fluctuations for hairpin with tandem mismatches and the related functional role.35 However, the simulational studies are based on incomplete conformational sampling. The complete conformational ensemble for pseudoknot and secondary structures are huge. Monte Carlo simulations may miss some of the low-stability conformations, leading to incomplete conformational sampling. Such low-stability conformations can be important for the formation of transition states and possible kinetic traps. In the present study, we consider the complete conformational ensemble, including all the possible native-like and misfolded states. The work is motivated by the need to explore the global and complete landscape of the pseudoknot folding kinetics, such as the folding pathways for the experimentally proposed molecular switch of hTR.
Our pseudoknot folding kinetics model relies on the recently developed RNA pseudoknot folding thermodynamic model (denoted as Vfold, where V stands for Virtual Bond Model).32 Based on the thermodynamic parameters derived from Vfold, we develop a combined master equation and kinetic cluster theory 34 for pseudoknot folding kinetics. From the model, we obtain folding pathways, intermediates, rates, rate-limiting steps, activation energies, etc., for RNA pseudoknot. After developing the model, we validate the model through comparisons with extensive experimental data such as the Arrhenius plot and the folding rate for the PK5 pseudoknot.37,38 For a great variety of RNA pseudoknots, we find that pseudoknots fold/unfold through two-step (biphasic) processes, where a hairpin is formed as a kinetic intermediate in the first step, followed by the rate-limiting disruption of the misfolded structures and the formation of the native pseudoknot. As a further application of the model, we investigate the kinetic pathways for the folding of hTR pseudoknot.10,11 The results are in accordance with the experiments. Moreover, the predicted kinetic pathways provides mechanisms for the proposed hairpin-pseudoknot molecular switch.
Model and theory
Kinetic moves and master equation
The master equation is constructed from the transition rates between different states. We define a state by the base pairing pattern. For a given sequence, we enumerate all the possible base pair patterns (= states) for the secondary structures and the pseudoknotted structures. For each given state, the helical stems are modeled as an A-form RNA helix, while the un-paired segments of the chain, such as the loops, are treated as flexible chains that can adopt multiple conformations. Therefore, a state usually corresponds to many accessible conformations. For a given state, the energies (enthalpies) of the base pairing/stacking are obtained from the empirical experimental parameters39,40 and the entropy is calculated from the Vfold model.23,24,32 In the Vfold model, the conformation of the helix stems are described by the atomic coordinates of the virtual-bonds of A-form RNA helices, and the loop conformations are exhaustively enumerated through self-avoiding walks of the virtual-bonds. The number of conformations for a given state is determined by the viable conformations of the loops and other non-base-paired regions, the different orientations of the helix stems, and the volume exclusion between different parts of the chain. An important feature of the Vfold model is that it takes into account the mismatched intraloop base pairing/stacking interactions.
Since RNA helices are mainly stabilized by the base stacking force, we assume that different RNA conformations are inter-converted via the formation and disruption of a base stack such as (a, b, c, d) in Fig. 1c-1 or a stacked base pair such as (x, y) in Fig. 1c-2.
Figure 2.
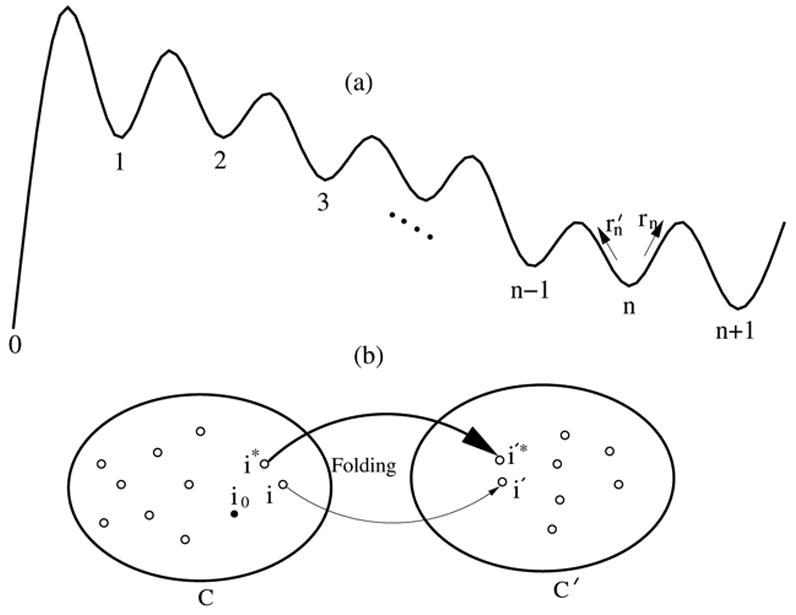
(a) A schematic pathway from the initial cluster (state) 0 to the final cluster (state) n + 1 with n intermediate clusters (states). (b) Inter-cluster transition between clusters C and C′, where i → i′ denotes a micro-pathway for the inter-cluster transition, i* → i′* denotes the dominant micro-pathway, and i0 denotes the most stable state in cluster C.
To calculate the rate constant for a kinetic move, we need a transition state model. For the formation of a base pair/stack, we assume that the transition state occurs when the participating nucleotides have been restricted to the full base-paired positions, but not yet stabilized by the hydrogen bonding/base stacking interactions. So the entropy of the transition state S ‡ is equal to the entropy S (close) of the stable base-paired state and the enthalpy of the transition state H‡ is equal to the enthalpy H(open) of the unpaired open state. Since the base pairing/stacking is short-ranged, we expect that the specific configuration of the transition state is in the close vicinity of the stable base pairing configuration. The precise configuration of the transition state requires detailed atomic computation. According to the transition state assumption, the kinetic barrier for the formation of a base pair is entropic, as characterized by the entropic loss (S ‡ – S (open)) upon the formation of the base pair/stack.
Similarly, for the disruption of a base pair/stack, we assume that the transition state occurs when the stabilizing interactions have been disrupted (so H‡ ≃ H(open)) but the nucleotides are not yet liberated from the base-paired positions (so S ‡ ≃ S (close)). Such a transition state would have the same configuration as the transition state for the formation of a base pair/stack as defined above. The kinetic barrier for the disruption of a base pair/stack is enthalpic, as quantified by the activation enthalpy (H‡ – H(close)) required to activate the transition from the stable base-paired state to the transition state. We note that the above transition state model has been used to compute RNA hairpin folding kinetics and has given good theory-experiment agreements.39
For a kinetic move between states N and C in Fig. 1c, the activation free energies are and for the formation and disruption of a base pair/stack, respectively. Here Sx and Hx denote the entropy and enthalpy of state x (= N or C), respectively. The corresponding rate constants are thus given by the following equations:
where kB is the Boltzmann constant, T is the temperature. The constant k0 is a prefactor fitted from the experimental data (Ref. [41]). The rate constants for all transitions that cannot be connected by kinetic moves are set to be zero.
The time evolution of the population pi(t) for the ith state is governed by the following master equation:
| (1) |
where ω is the total number of conformations, kx→y is the transition rate from state x to state y. The rate constants constitute an ω × ω rate matrix M, defined by matrix element Mi j = kj→i for i ≠ j and . From the eigenvalues λm (m = 1, 2, …,ω) and eigenvectors nm, we obtain the populational kinetics for any given initial conformational distribution:
| (2) |
where p(t) = [p1(t), p2(t), … ,pω(t)] is the populational vector and Cm’s are the coeffcients dependent on the initial condition.
The advantages of the master equation are that (a) its solution is analytical and (b) the solution is based on the complete conformational ensemble. The disadvantages are (a) it cannot treat large molecules (> 30 nt) because of the large conformational space and (b) it cannot give microscopic pathways. Therefore, in order to treat long chains and to obtain the detailed pathways, we use the kinetic cluster approach, as described below.
Kinetic cluster method
For a system with discrete rate-limiting folding/unfolding steps, we can classify the conformational ensemble into preequilibrated clusters. Different clusters are separated by the rate-limiting (slow) steps.42,43 The overall kinetics is determined by the much reduced network of clusters, from which we can perform the detailed kinetic analysis.42
From the inter-conformation transition rate, for a folding process, a rate-limiting step is either (a) the formation of native base pairs (stacks) with large entropic decreases or (b) the disruption of the nonnative base pairs (stacks) with large enthalpic increases. For an unfolding process, rate-limiting steps are the disruptions of the native base pairs (stacks) with large enthalpic increases.
For each pair of clusters C and C′ (see Fig. 2), there usually exist multiple micro-pathways between them. Each micro-pathway connects a conformation i in cluster C to a conformation i′ in cluster C′. Throughout the study, we use micro-pathways to denote structural transformations at the level of conformations, and use macro-pathways to denote transformations at the level of clusters. Each inter-cluster micro-pathway i → i′ between clusters C and C′ involves the rate-limiting kinetic move that separates the two clusters. The overall inter-cluster transition rate kC→C′ and kC′ →C are the averages over all the micro-pathways:
| (3) |
where px (x = i or i′) is the equilibrium fractional population of conformation x in the respective cluster. Among all the micro-pathways from C to C′, the probability of folding or unfolding along the i → i′ micro-pathway is determined by the following partitioning probability (See Eq. 4):
| (4) |
The largest f micro–path gives the dominant micro-pathway.
A cluster is usually connected to several other clusters. The probability for a molecule to escape from cluster C through the C → C′ transition is determined by the following fraction.
| (5) |
The largest f macro–path gives the dominant macro-pathway.
Folding rates with multiple intermediates
From the kinetic cluster method, we can identify the dominant macro-pathway. How to compute the rate constant along a macro-pathway, which, in general, can have multiple inter-cluster transitions (See Fig. 2)? If there exists only one intermediate (n = 1 in Fig. 2a), the lowest eigenvalue of the rate matrix for the 3-state (0, 1, 2 in Fig. 2a) system gives the rate k2 for 0 → 1 → 2:
| (6) |
If the intermediate states (clusters) for a given macro-pathway are short-lived, we can then obtain an analytical expression for the rate constant as shown below. The condition of the short lifetime for the intermediates leads to the following recursive relation between rate kn for pathway 0 → n and kn−1 for pathway 0 → n − 1 in Fig. 2a.
| (7) |
where the sum corresponds to the iterative rebounce processes and rn−1 and are the forward and backward (rebounce) probabilities for a molecule in Cn−1 and Cn, respectively:
The above recursive relation results in the rate for a macro-pathway with n intermediates:
| (8) |
RNA pseudoknot folding and unfolding often involve several parallel folding pathways. The total folding rate is the sum of the rate over all the parallel pathways.
Activation energy
The temperature-dependence of rate constant (Arrhenius plot) reveals the information about the microscopic mechanism of the folding/unfolding kinetics.34,44–50 For simple two-state kinetics, the activation energy Ea (the change in the mean energy (enthalpy) in the rate-limiting step) can be extracted from Arrhenius equation:
| (9) |
If the folding process is rate-limited by an inter-cluster transition C → C′, then Eqs. 3 and 9 lead to the following expression for Ea.
| (10) |
Here H is the enthalpy of a conformation, ε denotes the activation barrier ε(i→i′) = −d ln ki→i′/d (1/kBT ) for micro-pathway i → i′, < >micro–path and < >cluster are the averages over the micro-pathways weighted by the fractional pathway partitioning factor (Eq. 4) and the conformations in cluster C weighted by the equilibrium Boltzmann factor, respectively.
Clusters are separated by a rate-limiting step. is the activation barrier for such rate-limiting step. Therefore, is independent of the micro-pathway i → i′ and is a constant εa. As a result, the activation barrier Ea has a much simpler form:
| (11) |
If C → C′ is rate-limited by the formation/breaking of a base pair (stack) whose kinetic barrier is entropic/enthalpic, εa would be zero/positive (=the enthalpic change for the disruption of the rate-limiting base stack).
To understand the physical meaning of the expression for Ea as shown in Fig. 2b, we use i0 to denote the most stable conformation in cluster C and assume i* → i′* to be the most probable micro-pathway for C → C′. Then the activation energy in Eq. 10 gives the enthalpic difference between i* and i0. Physically, this is the energy required to excite the transition from the most highly populated state i0 to the kinetically most active state i*.
As a test, we find that the number of conformations for RNA secondary structures and pseudoknotted structures grows with the chain length L as ω = (0.2)(1.35)L for a 77-nt tRNA sequence.51,52 Given the large number ω of the conformations, the most time-consuming step of the computational process is the calculation of the large number of the rate constants between all the possible kinetically connected pairs of the conformations. Therefore, the computation time for the folding kinetics calculation scales as ω × ω (= the number of conformational pairs). In the kinetic cluster approach, the number of clusters is dramatically smaller than the original number of conformations. Therefore, unlike the computation time, the limiting factor for the required computer memory in the calculation is not the inter-cluster rate matrix. Instead, the memory is determined by the required space to save the large number of the original conformations. So the required memory scales as ω. For a 45-nt sequence that we tested, there are ω = 163578 secondary and pseudoknot conformations. The folding kinetic computation took 150 minutes with 56 M memory.
Results and discussion
PK5 pseudoknot
As shown in Fig. 3, PK5 pseudoknot is a 26-nt pseudoknot, which consists of two stems connected by two loops. We choose PK5 because it is one of the few pseudoknots of which the folding kinetics, including the activation energy and unfolding rate, has been experimentally measured.
Figure 3.
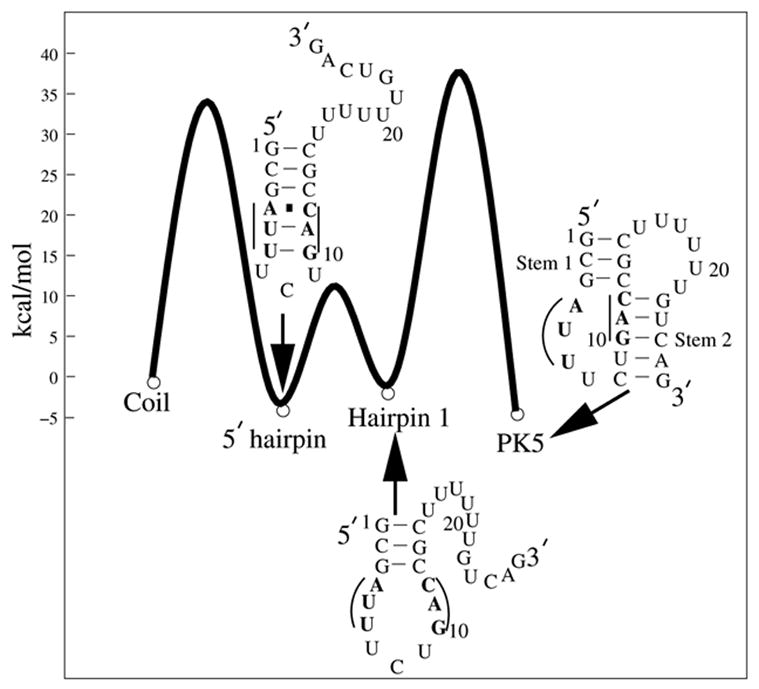
A schematic free energy landscape for the transition from the unfolded (coil) state to the PK5 pseudoknot at T=37°C. A three-state process has been observed by the experiment.38 The single-strand coil is found to form the misfolded hairpin first, followed by the disruption of the three misfolded base pairs (in bold). Then hairpin 1 folds into the native pseudoknot (PK5).
Using the Vfold model for RNA pseudoknot folding thermodynamics,32 we predict the native structure and the thermal stability for PK5. One of the problems presented in the folding thermodynamic calculation is how to treat the energetics for mismatched base pairs. For a single mismatched base pair in the internal loop, we add entropy and enthalpy penalties according to the sequence-dependent energy parameters obtained from experiments.38,50 Theory-experiment38 comparison shows that our native structure prediction is exact, and the predicted stability −4.2 kcal/mol is very close to the experimental results of −4.3 kcal/mol (NMR) and −4.9 kcal/mol (optical).38 Moreover, the predicted melting temperature Tm = 67°C is also close to the experimental result 64°C.38
Folding kinetics experiments show that the folding of PK5 involves a misfolded 5′ hairpin38 as a kinetic intermediate. The 5′ hairpin contains three non-native base pairs, which must be disrupted in order for the native stem 1 to be formed; see Fig. 3. We call a base pair to be “native” if it exists in the native structure (PK5 pseudoknot) and “nonnative” otherwise. Our folding thermodynamic calculation shows that the 5′ hairpin is substantially less stable than the native pseudoknot PK5 with an equilibrium constant [PK5]/[5′ hairpin] = 13.1 at T = 37°C. Therefore, the 5′ hairpin is thermodynamically unstable and can only possibly emerge in the form of a transient intermediate state.
Wyatt et al have measured the (pseudoknot) → (5′ hairpin) unfolding rates at five different temperatures, 19.4°C, 22.2°C, 24.5°C, 27.2°C and 29.5°C. The Arrhenius plot for the temperature-dependence of the unfolding rate gives an apparent activation energy of about 42 kcal/mol. The experiment study suggested that the unfolding activation barrier corresponds to the disruption of stem 2 in PK5 pseudoknot.38 Based on the kinetic cluster analysis described above, we can predict not only the experimentally measured activation energy and the rate constants but also the detailed folding pathways for PK5 pseudoknot.
Relaxation kinetics
By exhaustively enumerated all the different arrangements of the base stacks, we find that the 26-nt pseudoknot-forming sequence can form 1328 possible secondary structures and 177 pseudoknotted conformations, with a total of 1505 states. We label the conformation state using I(N,NN), where N is the number of the native base pairs, and NN is the number of nonnative base pairs. The two stems of a pseudoknot may or may not form coaxial stacking. For the PK5 pseudoknot, experimental results suggest the possibility of partial coaxial stacking.37 Our predicted folding stability without coaxial stacking shows a better experimental agreement than that with coaxial stacking,32 indicating that the coaxial stacking is weak. Therefore, as a simplified approximation, we assume no coaxial stacking for PK5. Solving the eigenvalues and eigenvectors of the 1505 × 1505 matrix requires 6 minutes on a 3.06 GHz PC.
The 1505 × 1505 rate matrix for the complete conformational ensemble gives the full populational kinetics for each and every state. In Fig. 4, we show the populational kinetics in the folding process from the completely unfolded state at temperature T = 19.4°C. The populational kinetics curves clearly show that, consistent with the experiment,38 the misfolded 5′ hairpin (denoted as I(3,3)) is a kinetic intermediate.
Figure 4.
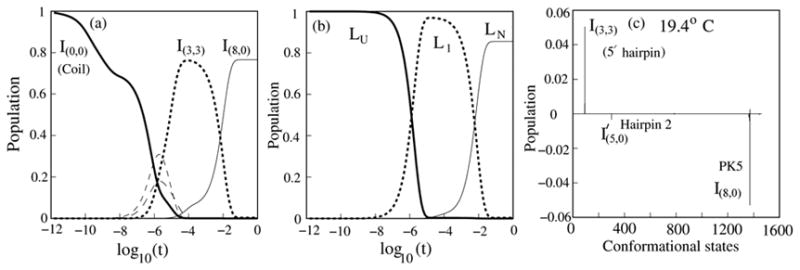
Folding kinetics for PK5 at T=19.4°C. Populational kinetics from the exact master equation (a) and the kinetic cluster method (b). Populational curves for states whose populations never reach 10% are not shown. The two methods unambiguously show that the misfolded state (I (3,3)), which is in cluster L1, is a kinetic intermediate in the folding from the coil state (I(0,0)) to the native pseudoknot (I(8,0)). The two states whose populational kinetics are shown as thin dashed lines in (a) are contained in cluster LU. (c) The eigenvectors for the slowest mode (λ1). Hairpin 2 is a stem-loop structure with stem 2 closed by a hairpin loop.
In order to obtain the detailed information about folding pathways, rates, and rate-limiting steps, we go beyond the conformational ensemble-based master equation approach by using the kinetic cluster approach. From the exhaustive examination for all the possible conformations, we find five rate-limiting base stacks. Four native base stacks, 10GA11-23UC24, 1GC2-14GC15, 9UG10-24CA25 and 11AC12-22GU23, are slow to form because of the large entropic decreases of ΔS = −35.5, −34.9, −27.9 and −26.2 kcal/mol·K, respectively. The formation of these four base stacks are thus rate-limiting. In addition, the disruption of the nonnative base stack 3GA4-23UC24 is also slow due to the large enthalpic increase of ΔH = 13.3 kcal/mol in the disruption process and is hence a rate-limiting base stack. According to the formation/disruption of these five base stacks, we classify the original conformational ensemble into 15 kinetic clusters. Conformations that do not contain any of these rate-limiting base stacks are classified as cluster LU, the misfolded 5′ hairpin (see Fig. 3) is in a cluster denoted as L1, and the native PK5 pseudoknot is in the native cluster LN.
The overall folding kinetics can be described by the 15 × 15 rate matrix. The lowest nonzero eigenvalue of the rate matrix, denoted as λ1, corresponds to the rate constant of the slowest kinetic mode. If there exists a single pronounced slowest mode (smallest λ1), then the kinetic process is single exponential and the relaxation rate kr is equal to λ1. For the system under folding condition (T < Tm = 67°C), the relaxation rate kr is approximately equal to the folding rate kf. Likewise, under the unfolding condition (T > Tm), is approximately equal to the unfolding rate ku.
In Fig. 5a, we show the temperature-dependence of λ1. We find that the eigenvector of the slowest mode is dominated by the components corresponding to the coil state and the native pseudoknot, suggesting that the slowest model for the folding process is the transition from the coil state to the native pseudoknot. The comparison with the exact master equation results (Fig. 5a) shows that the 15 clusters can well describe the folding kinetics.
Figure 5.
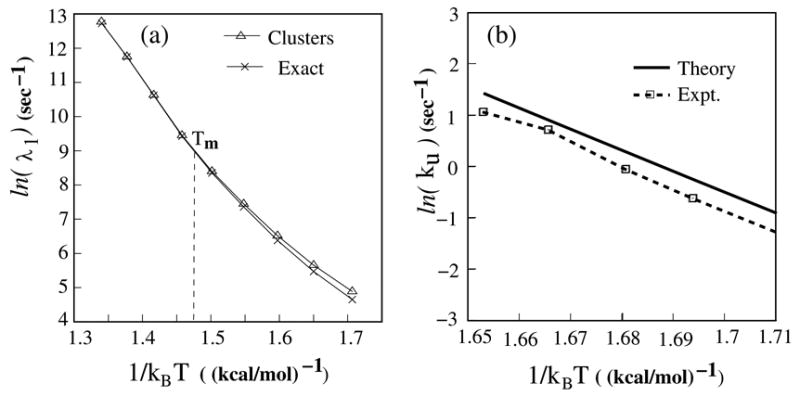
(a) The Arrhenius plot for the lowest nonzero eigenvalue from the exact master equation and the kinetic cluster method. (b) The comparison of the unfolding rates between the experiments (dot line) and the calculations. The unfolding rates are measured at five different temperatures, 19.4°C, 22.2°C, 24.5°;C, 27.2°C and 29.5°C. The unfolding process is from the native pseudoknot (I(8,0)) to a misfolded 5′ hairpin (I(3,3)).
(1) Folding pathways (19°C–30°C)
In the experiment, the rate constants are measured in the temperature range between 19°C and 30°C.38 Our kinetic cluster theory gives two apparent parallel folding pathways. As shown in Fig. 6, the two folding pathways are LU →L1 →L2 →L3 → LN (pathway 1) and (pathway 2). Also shown in the figure are the dominant micro-pathways between the kinetically adjacent clusters on each pathway. We find that the folding pathways can be well described as biphasic processes, as explained the following.
Figure 6.
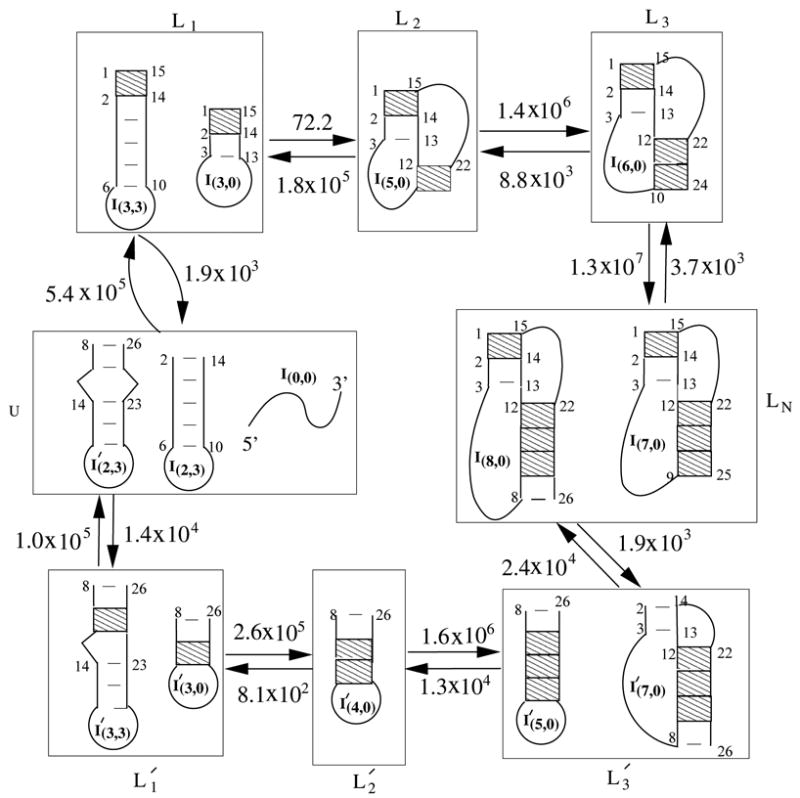
The folding of PK5 at temperature 19°C – 30°C involves two parallel folding pathways: LU → L1 → L2 → L3 → LN and . Also shown in the figure are the intercluster transition rates (in sec−1) and the dominant micro-pathways between adjacent clusters on the pathways. The shaded regions denote the rate-limiting base stacks.
Phase I: Fast trapping in the misfolded state (10−5–10−3 s)
The coil state (I(0,0)) in cluster LU rapidly folds into a misfolded 5′ hairpin (I(3,3) in cluster L1). Because the detrapping rate from the misfolded state is slow, the misfolded 5′ hairpin population would quickly accumulate to form a kinetic trap. Fig. 4a shows that about 80% population is trapped in the misfolded state I(3,3). What causes the fast folding from the coil state to the misfolded 5′ hairpin I(3,3)? First, from Fig. 6, we find that hairpin I(2,3) is the most populated state in the preequilibrated distribution of cluster LU (25.2 %). With a single kinetic move (the formation of the (1,2,14,15) base stack), I(2,3) is rapidly converted into the misfolded state I(3,3). The pathway from cluster LU to is less probable because the pathway conformation in cluster LU is much less populated (0.03 %) than I(2,3) (25.2 %). Eq. 3 gives that . As a result, most population would be trapped in the misfolded state I(3,3) at , which agrees with the populational kinetics curve shown in Figs. 4a and b.
Phase II: Slow detrapping from the misfolded state (10−3–10−1 s)
From Fig. 6, we find that the slowest step for the overall kinetics is the detrapping process L1 → L2. Since the most stable state in cluster L1 is the misfolded 5′ hairpin I(3,3), the detrapping transition from L1 corresponds to the breaking of I(3,3). There exist two detrapping pathways from L1: L1 → L2 → L3 → LN (pathway 1) and , with rates (from Eq. 8) and , respectively. So the total folding rate (kF) can be calculated as a sum of the two pathways , which is close to 100.1 sec−1 from the exact master equation. The estimated rate, which accounts for the contributions only from the above two dominant pathways is slightly smaller than the total folding rate from the cluster analysis. This is due to the neglected contributions from other pathways. Because , the majority of the population in cluster L1 would fold along pathway 1 into the final native state. Therefore, pathway 1 is the most dominant folding pathway. In the overall folding process, the transition from cluster L1 to cluster L2, i.e., the disruption of the misfolded hairpin I(3,3), is rate-limiting.
(2) Activation barrier of folding (19°C–30°C)
At temperature 19.4°C, the main folding pathway is L1 → L2 → L3 → LN in Fig. 6. The slowest (rate-limiting) inter-cluster transition is L1 → L2, which has a rate constant of 72.2 sec−1. Eq. 10 gives the activation energy for L1 → L2 as . To understand the result, we note that the misfolded 5′ hairpin (state I(3,3)) is the most stable state in cluster L1 with a fractional population of 84%, while the dominated micro-pathway for L1 → L2 is I(3,0) → I(5,0) with a fractional pathway partitioning factor of fmicro–path ≃ 93%. Therefore, the activation energy can be estimated as the energy required to excite the molecule from I(3,3) to I(3,0). The two states differ by three base pairs with a total enthalpy difference of 13.8 kcal/mol, which is close to .
For the other detrapping pathway ( ) from cluster L1, which contains the 5′ hairpin I(3,3) as the most stable state, the rate-limiting step and the activation energy are determined by the L1 → LU transition, which is the slowest process on the pathway. The L1→ LU transition is an unzipping process. Eq. 10 gives the activation energy of , which is close to the enthalpic change 14.2 kcal/mol for the breaking of the rate-limiting base stacking 1GC2-14GC15 (14.2 kcal/mol).
The overall activation energy of folding can be estimated as the following:
| (12) |
where and are the folding rates of pathway 1 and pathway 2, respectively. The result agrees exactly with that obtained from the slope of the Arrhenius plot in Fig. 5a.
(3) Unfolding kinetics (19°C–30°C)
From the eigenvector of the slowest mode (=relative populational changes of different conformations) in Fig. 4c, we find that the kinetic process can be primarily described as a transition I(3,3) → I(8,0), where the population of the misfolded conformation I(3,3) is depleted and most of the population is converted to the native pseudoknot I(8,0).
Because cluster , which contains , and the native cluster LN (See Fig. 6) can inter-convert rapidly, and LN can quickly pre-equilibrate to form a “macrostate”. As a result, the overall kinetics is effective between a macrostate ( ) and the misfolded cluster L1. For such a two-state transition, the detailed balance principle relates the unfolding rate kU to the folding rate kF:
| (13) |
Here kF under the folding condition (19°C–30°C) is approximately equal to the relaxation rate λ1 (= the lowest eigenvalue of the rate matrix). In Fig. 5b, we show the theory-experiment comparison for the unfolding rate kU at different temperatures. From the Arrhenius equation (Eq. 9), the calculated unfolding rate gives an activation energy of 42 kcal/mol, which is in exact agreement with the experiment.38
The calculated unfolding rate is slightly faster than the experiment. In our model, we have neglected the additional stability of the pseudoknot due to partial coaxial stacking between helices37 and the stabilizing tertiary interaction between loop and helices.3,6,7 The inclusion of such effects would lower the unfolding rate. But these additional interactions may not cause a notable change in the activation energy (42 kcal/mol).
(4) Unfolding kinetics (T > Tm = 67°C)
At high temperature (T = 80°C), the rate-limiting step for the unfolding of the native pseudoknot is controlled by the disruption of the base stacks of high enthalpic barriers. There exist two such rate-limiting base stacks, 1GC2-14GC15 and 10GA11-23UC24, whose disruption involve large enthalpic costs of ΔH = 14.2 kcal/mol and 13.3 kcal/mol, respectively. According to the two rate-limiting base stacks, we classify the 1505 conformations into four clusters: Cluster HN for conformations with base stacks 1GC2-14GC15 and 10GA11-23UC24, cluster H1 for conformations with base stack 1GC2-14GC15, cluster for conformations with base stack 10GA11-23UC24, cluster HU for conformations without any of the two stacks.
As shown in Fig. 7, the kinetic cluster method gives two parallel unfolding pathways: H N → H1 → HU (pathway 1) and (pathway 2). Eq. 6 gives the rate constants for each pathway: 1.7×10⁴ sec−1 for pathway 1 and 5.8×10⁴ sec−1 for pathway 2, respectively. Pathway 2 is likely a more probable unfolding pathway. On pathway 2, the pseudoknot unfolds from stem 1, followed by the breaking of stem 2. Furthermore, from Fig. 7, we find that the rate-limiting step for the unfolding is from cluster to HU, which, according to Eq. 10, has the activation energy of 27.1 kcal/mol.
Figure 7.
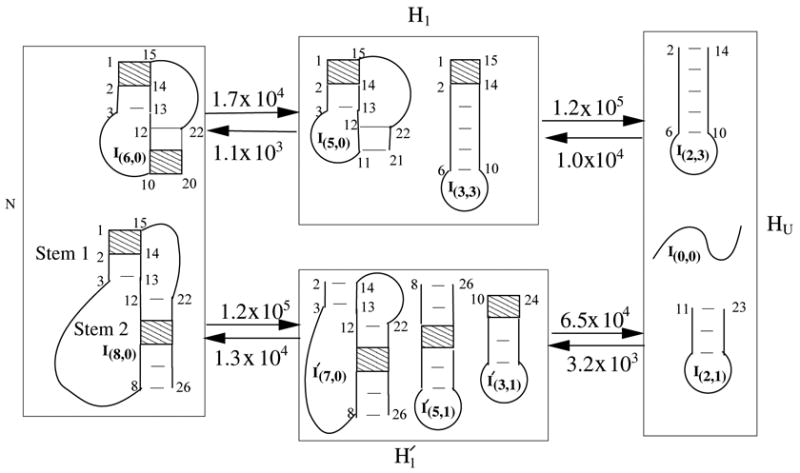
The unfolding pathway from the native PK5 pseudoknot to the coil state I(0,0). We find two parallel unfolding pathways (HN → H1 → HU and ). Also shown in the figure are the inter-cluster rate constants (in sec−1). The rate-limiting base stacks are shown as the shaded regions.
The estimated activation energy is close to the slope of the Arrhenius plot in Fig. 5a (29 kcal/mol). The positive activation is mainly from the disruption of three base stacks between states and I(2,1). The total enthalpy for the three base stacks is 31.4 kcal/mol.
Human Telomerase RNA (hTR) pseudoknots
It has been proposed that the conformational switch between an hairpin structure, denoted as HPWT, and the pseudoknot, denoted as PKWT, is critical to human telomerase RNA (hTR) activity. One of the experimental evidence is that mutations destabilizing the hairpin or the pseudoknot have been found to cause hTR to lose activity.9–11 On the other hand, a recent functional analysis of human telomerase RNA13 showed that the destabilization of the hairpin HPWT could preserve the telomerase activity, which appeared to disagrees with the conclusion about the functional importance of the hairpin ↔ pseudoknot conformational switch. We use an experimentally studied truncated hTR sequence10 with 48-nucleotide to study the folding kinetics of hTR pseudoknot. The sequence contains two helix stems (p2b and p3) and the j2b/3 loop as well as the highly conserved nucleotide sequence of the j2a/3 loop in the hTR pseudoknot.53
We show the HPWT hairpin structure in Fig. 8a. Thermodynamic experiments10,11 suggest that the tandem mismatches in HPWT can stabilize the structure. To extract the energy parameter for the tandem mismatches from the measured free energy (ΔG = −9.8 kcal/mol) and enthalpy (ΔH = −92.0 kcal/mol) for the hairpin,10,11 we assume that three base stacks from base pair (99U-U115) to (102U-C112) have approximately the same (ΔH, ΔS ). With such approximation, the experimental results for (ΔG, ΔH) for the hairpin give (ΔH, ΔS ) = (−1.8 kcal/mol, ΔS = −9.2 kcal/mol.K) for each base stack in the tandem mismatch. The other mismatches 98GU-UC116, 102UU-AC112 and 104CU-UG110 are assigned the energy parameters according to the Turner rule.39 To test the assigned energy parameters for the tandem mismatches, we calculate the heat capacity for the HPWT, and compare it with the experiment in Fig. 8b. The optical denaturation curves in the experiment are performed at 260 nm and 280 nm wavelengths. Consistent with the experiment, the calculated melting curve reveals two transitions in the experiment. The first peak corresponds to the unfolding of 6 base stacks from base pair (99U-U115) to (105U-U109). And the second peak corresponds to the unfolding of 6 base stacks from base pair (93G-C121) to (99U-U115). In general, the melting temperature in the calculation in 1M NaCl is higher than that of the experiment in 200 mM due to lower ion concentration in the experiment.
Figure 8.
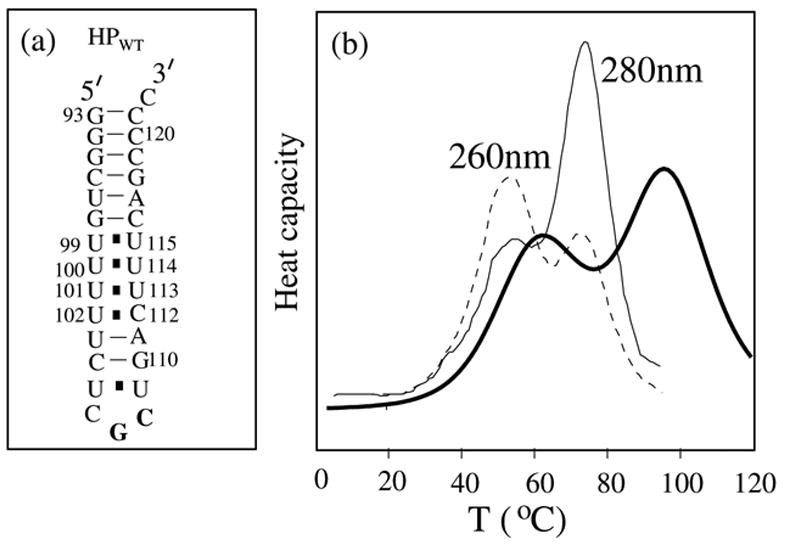
(a) The secondary structure of the hairpin-forming sequence HPWT. (b) Comparison between the calculated heat capacity (solid line) in 1M NaCl and the experimental optical spectroscopy at 260nm and 280nm in 200mM KCl. Our calculation can well reproduce the two peaks in the experiments. The first peak corresponds to the disruption of the tandem mismatches from base pair 99U-U115 to 105U-109U. The second peak corresponds to the disruption of the upper helix stem from base pair 93G-C121 to 99U-U115. The calculated melting curve has been normalized according to the first peak in the experimental optical spectroscopy at 280nm.
Folding kinetics
In Fig. 9, we show that the native structures of the wild-type pseudoknot-forming hTR sequence PKWT and the experimentally studied mutants: PK179AG/110CU,13 PKDC and PKΔU177.9–11 In the figure, the native structures of PKWT, PK179AG/110CU and PKΔU177 are denoted by I(15,0) or N and the native structure of PKDC is denoted by I(6,7) or C1. For the PK179AG/110CU mutant, the double-mutation 179AG/110CU destabilizes the hairpin HPWT by disrupting the tandem mismatches in HPWT. For the PKDC mutant, the 107GC→AG mutation disrupts the most stable base stacking (5′GC-GC3′) in PKWT, thus destabilizes PKWT. In contrast, for PKΔU177, the deletion of 177U eliminates the single bulge loop in PKWT, thus stabilizes the pseudoknot PKWT.
Figure 9.
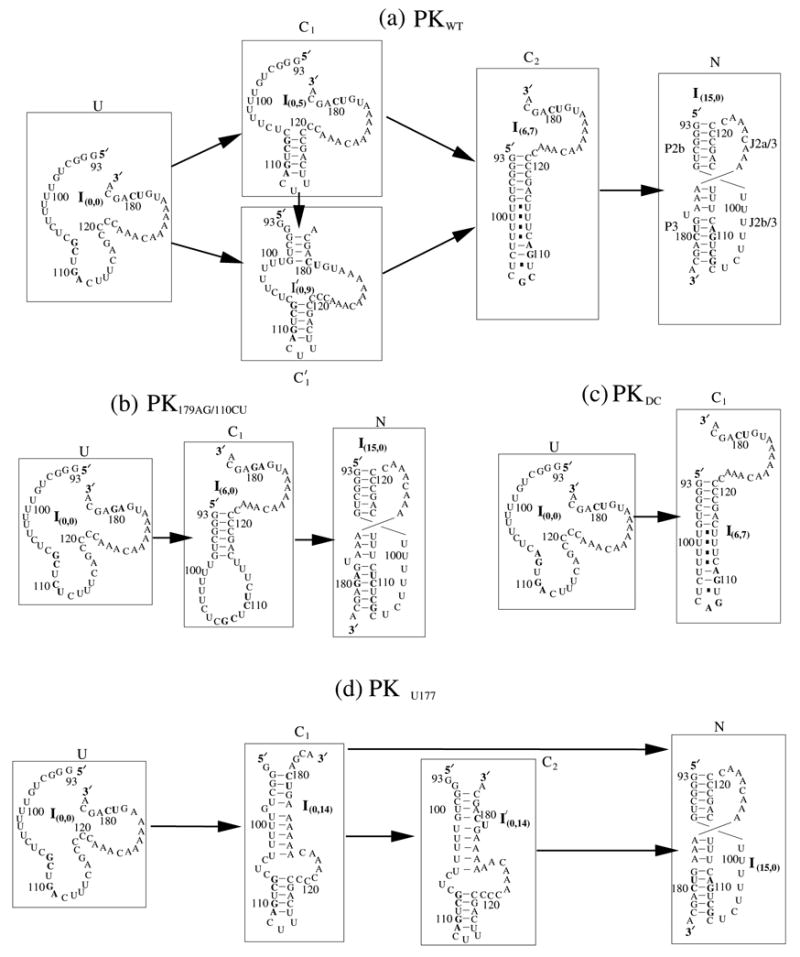
The kinetic intermediates appearing in the folding pathway for (a) PKWT, (b) PK179AG/110CU, (c) PKDC and (d) PKΔU177 at T=37°C. We find that for the mutants PKWT and PK179AG/110CU, the hairpin structure (I(6,7) in PKWT and I(6,0) in PK179AG/110CU ) appears as a long-lived stable kinetic intermediate before the formation of the native pseudoknot. The hairpin kinetic intermediate is absent in the folding pathway of PKDC and PKΔU177.
For PKWT, PK179AG/110CU, PKDC, PKΔU177 and the truncated short sequence HPWT, we find 150090, 77335, 195640, 133569 and 3938 conformations, respectively. For HPWT, we can use the exact master equation with a 3938×3938 rate matrix to obtain the exact solution for the eigenvalues and eigenvectors. However, for other sequences, the large number of conformations makes the computation with the master equation impossible, thus we use the kinetic cluster method.
In the kinetic cluster method, for PKWT, we exhaustively examine the rate for the formation/disruption of each native and nonnative base stack and classify the 150090 conformations into 405 clusters. The eigenvalues and eigenvectors for the 405×405 rate matrix for the ensemble of clusters give the detailed folding kinetics for the PKWT pseudoknot.
In Fig. 10a, we show the population kinetics of PKWT. In the folding process, clusters C1, and C2 emerge as populated intermediates. In Fig. 9, we show the kinetic pathways for PKWT. We use the most stable structure in each cluster to represent the respective cluster. For example, the hairpin I(6,7) in the figure is the most stable structure in cluster C2 for the PKWT folding pathway. In the first step, this misfolded hairpin emerges as a kinetic intermediate. In the second step, the hairpin is unzipped to form the native pseudoknot I(15,0). Our kinetic folding pathway gives strong support for the formation of a transient hairpin structure and the conformational switch between the hairpin structure and the pseudoknot.9–10 The hairpin structure I(6,7) (= HPWT ) and the native pseudoknot I(15,0) (= PKWT ) are formed in different stages of the folding pathway, and can play different functional roles in telomerase activity.
Figure 10.
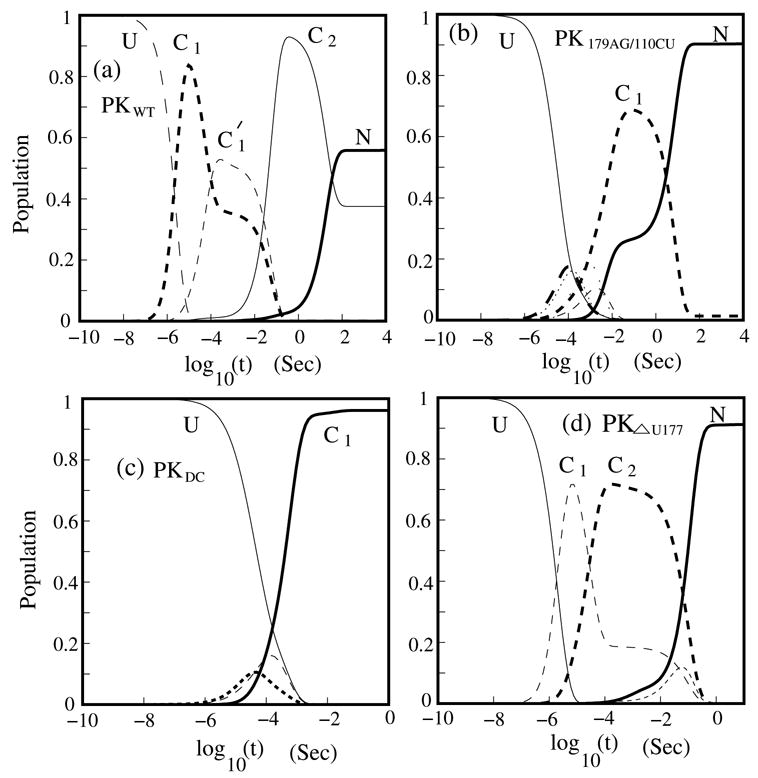
The populational kinetics for (a) the wild type pseudoknot (PKWT ) and the three mutants (b) PK179AG/110CU, (c) PKDC and (d) PKΔU177 at T=37°C. We only show the cluster with more than 10% population’s accumulation in the folding process.
Molecular switch and its relationship with telomerase activity
From the experiments,9,10 it was found that the pseudoknot-destabilizing mutation PK DC and the pseudoknot-stabilizing mutation PKΔU177 can reduce the telomerase activity to a much lower level. It was proposed that a molecular switch between hairpin and pseudoknot may be important for the telomerase activity, because the two mutations that alter the thermodynamic equilibrium between the hairpin and the pseudoknot result in the reduction in telomerase activity. However, in a different recent experiment,13 a hairpin-destabilizing mutation (PK179AG/110CU ) was found to preserve the telomerase activity. How can the seemingly contradictory experimental results be consistent with each other?
We propose that the hTR activity is kinetically (instead of thermodynamically) controlled. The activity-preserving PK179AG/110CU mutation, though destabilizes the hairpin state in thermal equilibrium, can actually cause the formation of the hairpin structure as a transient (kinetic) intermediate in the folding process. It is the switch between such kinetically formed (non-equilibrium) hairpin and the native pseudoknot that plays a role in telomerase activity.
To confirm the above hypothesis, we investigate the kinetic folding pathway for the three experimentally studied mutants. The original large conformational ensemble can be classified into 650, 434 and 290 clusters for PK179AG/110CU, PKDC and PKΔU177, respectively. In Figs. 10b, c and d, we give the populational kinetics for the three mutants. The kinetic intermediates on the folding pathways are shown in Figs. 9b, c and d. For PK179AG/110CU, we find that, as we predicted, hairpin structure (I(6,0) in cluster C1; See Fig. 9b.) is indeed a transient kinetic intermediate. Moreover, we find that the pseudoknot is absent in PK DC since the mutant destabilizes the pseudoknot stability by disrupting the two canonical base pairs in stem 2. We note that experimental studies on PKDC10 suggested a partial formation (50% fractional population) of the pseudoknot. The theory-experiment disagreement is due to the neglected loop-stem tertiary interactions, which can significantly stabilize the PKDC pseudoknot.11 In addition, we find that the hairpin structure (I(6,7) or I(6,0)) is absent in the folding pathway of PKΔU177. The absence of the hairpin in PKΔU177 and the pseudoknot in PKDC on the kinetic pathways explains why both PKDC and PKΔU177 are not functionally active. From our kinetic study, we find that a stable pseudoknot in the equilibrium state (final state) and a kinetic hairpin intermediate may be essential for the telomerase activity. Such conclusion is consistent with the functional analysis of the telomerase activity.9–11,13
What causes the hairpin structure to be formed as a kinetic intermediate on the folding pathways for PKWT and PK179AG/110CU ? The underlying mechanism is due to the slow folding rate for the pseudoknot. In Fig. 11, we give the detailed folding pathway from the hairpin to the pseudoknot for PK179AG/110CU. The folding rate for forming the pseudoknot is determined by two factors: (1) slow forward folding C1 → C2 and (2) the competition between the rapid backward transition C3 → C2 and the slow forward folding C3→ C4. The C3 → C4 transition corresponds to the formation of the single-nucleotide (U177) bulge loop and the AG-CU stack. Thus, deleting U177 as in mutant PKΔU177 would accelerate the formation of the pseudoknot and thus prevent the formation of the hairpin C1 in Fig. 11 as a kinetic intermediate.
Figure 11.
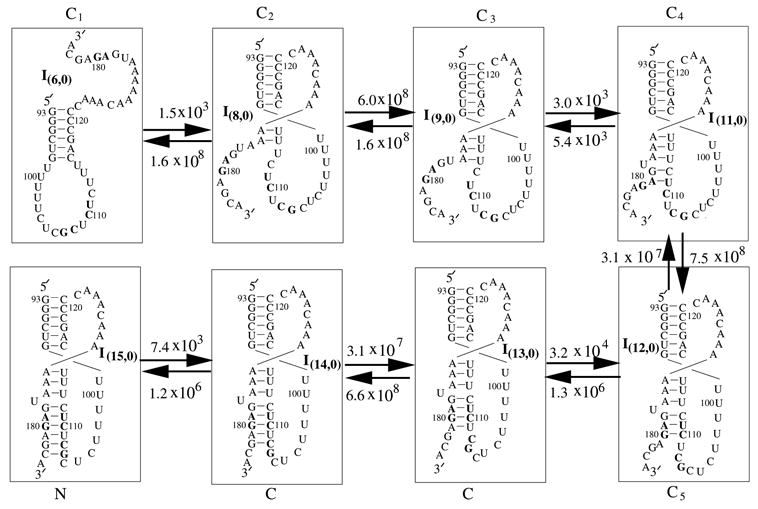
The detailed folding pathway from the hairpin I(6,0) to the pseudoknot I(15,0) for PK179AG/110CU at T=37°C. Also shown in the figure are the inter-cluster rate constants (in sec−1).
In conclusion, for the recent hairpin-destabilizing mutational experiment, we predict that the thermodynamically unstable hairpin structure (I(6,0)) is formed as a kinetic intermediate.13 This finding is consistent with the proposed hairpin-pseudoknot molecular switch mechanism for hTR activity.9–11,13 Recently, Yingling and Shapiro performed molecular dynamics simulations to investigate the dynamics of the conformational fluctuations/changes for hTR hairpin35 and pseudoknot.54 In particular, the simulational studies predicted that the bulged U177 residue in the P3 helix stem of the pseudoknot (see the predicted structure N in Fig. 9a) can form dynamic wobble U-U base pairs with the uridine residues in the J2b/3 loop. Such U-U pairs would juxtapose the J2b/3 loop and the P3 stem, causing the loop (J2b/3)-stem (P3) tertiary interactions. As a result, for the A174 residue in P3, its pairing with a uridine residue (e.g., U99) in the J2b/3 loop would lead to the disruption of its pairing with the U115 residue in the P3 stem. Therefore, the wild-type hTR is predicted to have a different structure (without the A174-U115 base pair in P3) from the NMR structure (with the A174-U115 base pair), which does contain the bulged U177 residue.
The current form of the folding kinetics model developed in this study does not treat loop-stem tertiary interactions. The model gives the pseudoknot folding kinetics prior to the formation of the tertiary interactions. The model cannot predict the tertiary disruption of the U115-A174 base pair following the formation of the pseudoknot (structure N in Fig. 9a). Moreover, the present theory is based on a reduced atomic model for RNA conformations, namely, the virtual bond model (Vfold) of RNA.23,24,32 In the Vfold model, a conformation is defined by the conformation of the nucleotide backbone and the base pairing constraints. The model does not keep track of the detailed positions for each individual atoms in the sugar rings or in the chemical groups of the bases. Instead, the energy functions used in model (implicitly) accounts for the interactions averaged over the ensemble of different atomic positions accessible to the given conformation. For example, the model does not consider the particular position and the resultant interaction for the atom of A174 and the atom of A175, which were found to be in close proximity (and thus possibly repel each other) in the NMR experiment.11
Summary
The kinetic cluster approach enables detailed analysis for RNA pseudoknot folding and unfolding kinetics, including rates, pathways, rate-limiting steps, activation energies, etc.. Applications to PK5 and hTR pseudoknots reveal biphasic (two-step) folding kinetics: The chain is rapidly trapped in a misfolded 5′ hairpin state at t ∼10−3 sec, followed by a detrapping transition from the misfolded hairpin to the native pseudoknot. The hairpin emerges as a kinetic intermediate because the hairpin → pseudoknot transition, which involves the breaking of the misfolded base pairs and the formation of the pseudoknot loops is slow. In general, the hairpin → pseudoknot transition is the rate-limiting step of the overall folding process and the disruption of the misfolded base pairs gives a positive activation energy.
For the hTR pseudoknot, the hairpin → pseudoknot mechanism may be essential for the telomerase activity and the function may be kinetically rather than thermodynamically controlled. For the experimentally studied mutation PKDC and PKΔU177, either the hairpin or the pseudoknot respectively is absent in the kinetic pathways, causing the reduction in telomerase activity for both PKDC and PKΔU177. For the hairpin-destabilizing mutation PK179AG/110CU, however, the hairpin is found to emerge as a kinetic intermediate in the folding process. Therefore, PK179AG/110CU preserves the telomerase activity.
The present model neglects the loop-stem tertiary interactions. For PK5 pseudoknot, the predicted pseudoknot stability without loop-stem interaction (4.2 kcal/mol) is close to the experimental result (4.3 kcal/mol (NMR) or 4.9 kcal/mol (optical)),38 suggesting a weak loop-stem interaction. Therefore, the loop-stem tertiary interaction would not cause significant changes in the predicted folding kinetics. For the hTR pseudoknot, though loop-stem tertiary interaction (Tm ∼ 40°) is less stable than pseudoknot ((Tm ∼ 60°),7,11 it can play significant structural and functional roles. Extensive RNA folding experiments have suggested that base-pairing patterns in the helix stems form first followed by the subsequent formation of the tertiary interactions.55–58 Here we assume that the loop-stem tertiary interactions are formed in the late stage after the pseudoknot (in the absence of the loop-stem tertiary interaction) is folded. Based on such an assumption, the results predicted in the present study would provide insights into the kinetics, including the formation of the transient hairpin intermediates, the rate-limiting steps, the rates and the pathways, prior to the formation of the tertiary interaction. However, as a caveat, we note that the present study assumes 1M NaCl solution condition and neglects the effect of the Mg2+ ions. Mg2+ can significantly stabilize the tertiary interactions59–61 and thus, depending on the nucleotide sequence and structural distribution, may possibly alter the folding pathways. Further development of the pseudoknot folding kinetics model should include loop-stem tertiary interactions. In fact, with the use of the Vfold model,23,32 which can give the chain entropy, it would be possible to obtain the loop-stem interaction energies from the thermodynamic experiments. Future development of the model by incorporating the tertiary interactions parameters and the Mg2+ effects into the model would allow us to treat the complete RNA pseudoknot folding kinetics (including tertiary structural folding).
Table 1.
The thermodynamic parameters for the loop formation with single mismatches. Sequences in line 1–6 are from Ref. 40. The last sequence is from Ref. 38.
| Sequences | ΔHexp | ΔSexp | ΔHcal | ΔScal | ΔΔH | ΔΔS |
|---|---|---|---|---|---|---|
| 5′GA(GCG)AG3′/3′CU(CAC)UC5′ | −13.4 | −41.6 | −16.7 | −43.9 | 3.3 | 2.3 |
| 5′GA(GAG)AG3′/3′CU(CGC)UC5′ | −11.4 | −36.5 | −15.0 | −35.2 | 3.6 | −1.3 |
| 5′GA(GCG)AG3′/3′CU(CUC)UC5′ | −10.4 | −33.6 | −11.3 | −30.0 | 0.9 | −3.6 |
| 5′GA(GUG)AG3′/3′CU(CUC)UC5′ | −12.6 | −40.6 | −14.3 | −40.0 | 1.7 | −0.6 |
| 5′GA(GAG)AG3′/3′CU(CAC)UC5′ | −12.3 | −40.9 | −15.5 | −41.9 | 3.2 | 1.0 |
| 5′GA(GUG)AG3′/3′CU(CCC)UC5′ | −7.7 | −26.4 | −11.7 | −32.6 | 4.0 | 6.2 |
| 5′GC(GAU)U3′/3′CG(CCA)G5′ | −10.2 | −29.4 | −11.4 | −30.3 | 1.2 | 0.9 |
|
| ||||||
| Average | – | – | – | – | 2.6 | 0.7 |
Acknowledgments
We thank Dr. Wenbing Zhang for valuable discussions about the kinetic model. We acknowledge grant support from NIH (GM063732 to S-J.C).
Footnotes
Publisher's Disclaimer: This is a PDF file of an unedited manuscript that has been accepted for publication. As a service to our customers we are providing this early version of the manuscript. The manuscript will undergo copyediting, typesetting, and review of the resulting proof before it is published in its final citable form. Please note that during the production process errors may be discovered which could affect the content, and all legal disclaimers that apply to the journal pertain.
References
- 1.Draper DE. Pseudoknots and the control of protein synthesis. Curr Opin Cell Biol. 1990;2:1099–1103. doi: 10.1016/0955-0674(90)90162-8. [DOI] [PMC free article] [PubMed] [Google Scholar]
- 2.Gesteland RF, Atkins JF. Recoding: Dynamic reprogramming of translation. Annu Rev Biochem. 1996;65:741–768. doi: 10.1146/annurev.bi.65.070196.003521. [DOI] [PubMed] [Google Scholar]
- 3.Giedroc DP, Theimer CA, Nixon PL. Structure, stability and function of RNA pseudoknots involved in stimulating ribosomal frameshifting. J Mol Biol. 2000;298:167–185. doi: 10.1006/jmbi.2000.3668. [DOI] [PMC free article] [PubMed] [Google Scholar]
- 4.Plant EP, Jacobs KLM, Harger JW, Meskauskas A, Jacobs JL, Baxter JL, Petrov AN, Dinman JD. The 9Å solution: How mRNA pseudoknots promote effcient programmed -1 ribosomal frameshifting. RNA. 2003;9:168–174. doi: 10.1261/rna.2132503. [DOI] [PMC free article] [PubMed] [Google Scholar]
- 5.Plant EP, Dinman JD. Torsional restraint: a new twist on frameshifting pseudoknots. Nucleic Acids Res. 2005;33:1825–1833. doi: 10.1093/nar/gki329. [DOI] [PMC free article] [PubMed] [Google Scholar]
- 6.Kim YG, Su L, Maas S, O’Neill A, Rich A. Specific mutations in a viral RNA pseudoknot drastically change ribosomal frameshifting effciency. Proc Natl Acad Sci USA. 1999;96:14234–14239. doi: 10.1073/pnas.96.25.14234. [DOI] [PMC free article] [PubMed] [Google Scholar]
- 7.Cornish PV, Hennig M, Giedroc DP. A loop 2 cytidine-stem 1 minor groove interaction as a positive determinant for pseudoknot-stimulated -1 ribosomal frameshifting. Proc Natl Acad Sci USA. 2005;102:12694–12699. doi: 10.1073/pnas.0506166102. [DOI] [PMC free article] [PubMed] [Google Scholar]
- 8.Blackburn EH. Telomerase RNA Structure and Function. In: Simons RW, Grunberg-Manago M, editors. RNA structure and Function. Cold Spring Harbor Lab. Press; New York: 1998. pp. 669–693. [Google Scholar]
- 9.Comolli LR, Smirnov I, Xu L, Blackburn EH, James TL. A molecular switch underlies a human telomerase disease. Proc Natl Acad Sci USA. 2002;99:16998–17003. doi: 10.1073/pnas.262663599. [DOI] [PMC free article] [PubMed] [Google Scholar]
- 10.Theimer CA, Finger LD, Trantirek L, Feigon J. Mutations linked to dyskeratosis congenita cause changes in the structural equilibrium in telomerase RNA. Proc Natl Acad Sci USA. 2003;100:449–454. doi: 10.1073/pnas.242720799. [DOI] [PMC free article] [PubMed] [Google Scholar]
- 11.Theimer CA, Blois CA, Feigon J. Structure of the human telomerase RNA pseudoknot reveals conserved tertiary interactions essential for function. Mol Cell. 2005;17:671–682. doi: 10.1016/j.molcel.2005.01.017. [DOI] [PubMed] [Google Scholar]
- 12.Theimer CA, Feigon J. Structure and function of telomerase RNA. Curr Opin Struct Biol. 2006;16:307–318. doi: 10.1016/j.sbi.2006.05.005. [DOI] [PubMed] [Google Scholar]
- 13.Chen JL, Greider CW. Functional analysis of the pseudoknot structure in human telomerase RNA. Proc Natl Acad Sci USA. 2005;102:8080–8085. doi: 10.1073/pnas.0502259102. [DOI] [PMC free article] [PubMed] [Google Scholar]
- 14.Chen JL, Greider CW. Telomerase RNA structure and function: implications for dyskeratosis congenita. Trends Biochem Sci. 2004;29:183–192. doi: 10.1016/j.tibs.2004.02.003. [DOI] [PubMed] [Google Scholar]
- 15.Marrone A, Walne A, Dokal I. Dyskeratosis congenita: telomerase, telomeres and anticipation. Curr Opin Genet Dev. 2005;15:249–257. doi: 10.1016/j.gde.2005.04.004. [DOI] [PubMed] [Google Scholar]
- 16.Batey RT, Rambo RP, Doudna JA. Tertiary motifs in RNA structure and folding. Angew Chem Int Ed. 1999;38:2326–2343. doi: 10.1002/(sici)1521-3773(19990816)38:16<2326::aid-anie2326>3.0.co;2-3. [DOI] [PubMed] [Google Scholar]
- 17.Tanner NK, Schaff S, Thill G, Petitkoskas E, Crainden Petitkoskas E, Craindenoyelle AM, Westhof E. A 3-dimensional model of hepatitis-delta virus ribozyme based on biochemical and mutational analyses. Curr Biol. 1994;4:488–498. doi: 10.1016/s0960-9822(00)00109-3. [DOI] [PubMed] [Google Scholar]
- 18.Ke AL, Zhou KH, Ding F, Cate JHD, Doudna JA. A conformational switch controls hepatitis delta virus ribozyme catalysis. Nature. 2004;429:201–205. doi: 10.1038/nature02522. [DOI] [PubMed] [Google Scholar]
- 19.Mathews DH, Turner DH. Prediction of RNA secondary structure by free energy minimization. Curr Opin Struct Biol. 2006;16:270–278. doi: 10.1016/j.sbi.2006.05.010. [DOI] [PubMed] [Google Scholar]
- 20.McCaskill JS. The equilibrium partition-function and base pair binding probabilities for RNA secondary structure. Biopolymers. 1990;29:1105–1119. doi: 10.1002/bip.360290621. [DOI] [PubMed] [Google Scholar]
- 21.Chen SJ, Dill KA. RNA folding energy landscapes. Proc Natl Acad Sci USA. 2000;97:646–651. doi: 10.1073/pnas.97.2.646. [DOI] [PMC free article] [PubMed] [Google Scholar]
- 22.Ding Y. Statistical and Bayesian approaches to RNA secondary structure prediction. RNA. 2006;12:323–331. doi: 10.1261/rna.2274106. [DOI] [PMC free article] [PubMed] [Google Scholar]
- 23.Cao S, Chen SJ. Predicting RNA folding thermodynamics with a reduced chain representation model. RNA. 2005;11:1884–1897. doi: 10.1261/rna.2109105. [DOI] [PMC free article] [PubMed] [Google Scholar]
- 24.Cao S, Chen SJ. Free energy landscapes of RNA/RNA complexes: with applications to snRNA complexes in spliceosomes. J Mol Biol. 2006;357:292–312. doi: 10.1016/j.jmb.2005.12.014. [DOI] [PMC free article] [PubMed] [Google Scholar]
- 25.Orland H, Zee A. RNA folding and large N matrix theory. Nucl Phys B. 2002;620:456–476. [Google Scholar]
- 26.Rivas E, Eddy SR. A dynamic programming algorithm for RNA structure prediction including pseudoknots. J Mol Biol. 1999;285:2053–2068. doi: 10.1006/jmbi.1998.2436. [DOI] [PubMed] [Google Scholar]
- 27.Lyngsφ RB, Pedersen CNS. RNA pseudoknot prediction in energy-based models. J Comput Biol. 2000;7:409–427. doi: 10.1089/106652700750050862. [DOI] [PubMed] [Google Scholar]
- 28.Dirks RM, Pierce NA. A partition function algorithm for nucleic acid secondary structure including pseudoknots. J Comput Chem. 2003;24:1664–1677. doi: 10.1002/jcc.10296. [DOI] [PubMed] [Google Scholar]
- 29.Ren J, Rastegari B, Condon A, Hoos HH. HotKnots: heuristic prediction of RNA secondary structures including pseudoknots. RNA. 2005;11:1494–1504. doi: 10.1261/rna.7284905. [DOI] [PMC free article] [PubMed] [Google Scholar]
- 30.Lucas A, Dill KA. Statistical mechanics of pseudoknot polymers. J Chem Phys. 2003;119:2414–2421. [Google Scholar]
- 31.Kopeikin Z, Chen SJ. Folding thermodynamics of pseudoknotted chain conformations. J Chem Phys. 2006;124:154903. doi: 10.1063/1.2188940. [DOI] [PMC free article] [PubMed] [Google Scholar]
- 32.Cao S, Chen SJ. Predicting RNA pseudoknot folding thermodynamics. Nucleic Acids Res. 2006;34:2634–2652. doi: 10.1093/nar/gkl346. [DOI] [PMC free article] [PubMed] [Google Scholar]
- 33.Flamm C, Fontana W, Hofacker IL, Schuster P. RNA folding at elementary step resolution. RNA. 2000;6:325–338. doi: 10.1017/s1355838200992161. [DOI] [PMC free article] [PubMed] [Google Scholar]
- 34.Zhang W, Chen SJ. RNA hairpin-folding kinetics. Proc Natl Acad Sci USA. 2002;99:1931–1936. doi: 10.1073/pnas.032443099. [DOI] [PMC free article] [PubMed] [Google Scholar]
- 35.Yingling YG, Shapiro BA. Dynamic behavior of the telomerase RNA hairpin structure and its relationship to dyskeratosis congenita. J Mol Biol. 2005;348:27–42. doi: 10.1016/j.jmb.2005.02.015. [DOI] [PubMed] [Google Scholar]
- 36.Isambert H, Siggia ED. Modeling RNA folding paths with pseudoknots: Application to hepatitis delta virus ribozyme. Proc Natl Acad Sci USA. 2000;97:6515–6520. doi: 10.1073/pnas.110533697. [DOI] [PMC free article] [PubMed] [Google Scholar]
- 37.Puglisi JD, Wyatt JR, Tinoco I., Jr Conformation of an RNA pseudoknot. J Mol Biol. 1990;214:437–453. doi: 10.1016/0022-2836(90)90192-O. [DOI] [PMC free article] [PubMed] [Google Scholar]
- 38.Wyatt JR, Puglisi JD, Tinoco I., Jr RNA pseudoknots–Stability and Loop size requirements. J Mol Biol. 1990;90:455–470. doi: 10.1016/0022-2836(90)90193-P. [DOI] [PubMed] [Google Scholar]
- 39.Serra MJ, Turner DH. Predicting thermodynamic properties of RNA. Methods Enzymol. 1995;259:242–261. doi: 10.1016/0076-6879(95)59047-1. [DOI] [PubMed] [Google Scholar]
- 40.Kierzek R, Burkard ME, Turner DH. Thermodynamics of single mismatches in RNA duplexes. Biochemistry. 1999;38:14214–14223. doi: 10.1021/bi991186l. [DOI] [PubMed] [Google Scholar]
- 41.Zhang WB, Chen SJ. Exploring the complex folding kinetics of RNA hairpins. 1 General folding kinetics analysis. Biophys J. 2006;90:765–777. doi: 10.1529/biophysj.105.062935. [DOI] [PMC free article] [PubMed] [Google Scholar]
- 42.Zhang WB, Chen SJ. Analyzing the biopolymer folding rates and pathways using kinetic cluster method. J Chem Phys. 2003;119:8716–8729. doi: 10.1063/1.1613255. [DOI] [PMC free article] [PubMed] [Google Scholar]
- 43.Chan HS, Dill KA. Transition-states and folding dynamics of proteins and heteropolymers. J Chem Phys. 1994;100:9238–9257. [Google Scholar]
- 44.Pörschke D, Uhlenbeck OC, Martin FH. Thermodynamics and kinetics of the helixcoil transition of oligomers containing GC base-pairs. Biopolymers. 1973;12:1313–1335. [Google Scholar]
- 45.Munõz V, Thompson PA, Hofrichter J, Eaton WA. Folding dynamics and mechanism of beta-hairpin formation. Nature. 1997;390:196–199. doi: 10.1038/36626. [DOI] [PubMed] [Google Scholar]
- 46.Bonnet G, Krichevsky O, Libchaber A. Kinetics of conformational fluctuations in DNA hairpin-loops. Proc Natl Acad Sci USA. 1998;95:8602–8606. doi: 10.1073/pnas.95.15.8602. [DOI] [PMC free article] [PubMed] [Google Scholar]
- 47.Wallace MI, Ying LM, Balasubramanian S, Klenerman D. Non-Arrhenius kinetics for the loop closure of a DNA hairpin. Proc Natl Acad Sci USA. 2001;98:5584–5589. doi: 10.1073/pnas.101523498. [DOI] [PMC free article] [PubMed] [Google Scholar]
- 48.Wang XJ, Nau WM. Kinetics of end-to-end collision in short single-stranded nucleic acids. J Am Chem Soc. 2004;126:808–813. doi: 10.1021/ja038263r. [DOI] [PubMed] [Google Scholar]
- 49.Onuchic JN, LutheySchulten Z, Wolynes PG. Theory of protein folding: The energy landscape perspective. Annu Rev Phys Chem. 1997;48:545–600. doi: 10.1146/annurev.physchem.48.1.545. [DOI] [PubMed] [Google Scholar]
- 50.Ansari A, Kuznetsov SV, Shen Y. Configurational diffusion down a folding funnel describes the dynamics of DNA hairpins. Proc Natl Acad Sci USA. 2001;98:7771–7776. doi: 10.1073/pnas.131477798. [DOI] [PMC free article] [PubMed] [Google Scholar]
- 51.Dube SK, Marcker KA, Clark BF, Cory S. Nucleotide sequence of N-formyl-methionyl-transfer RNA. Nature. 1968;218:232–233. doi: 10.1038/218232a0. [DOI] [PubMed] [Google Scholar]
- 52.Cole PE, Crothers DM. Conformational changes of transfer ribonucleic acid. Relaxation kinetics of the early melting transition of methionine transfer ribonucleic acid (Escherichia coli) Biochemistry. 1972;11:4368–4374. doi: 10.1021/bi00773a025. [DOI] [PubMed] [Google Scholar]
- 53.Chen JL, Blasco MA, Greider CW. Secondary structure of vertebrate telomerase RNA. Cell. 2000;100:503–514. doi: 10.1016/s0092-8674(00)80687-x. [DOI] [PubMed] [Google Scholar]
- 54.Yingling YG, Shapiro BA. The prediction of the wild-type telomerase RNA pseudoknot structure and the pivotal role of the bulge in its formation. J Mol Graph Model. 2006;25:261–274. doi: 10.1016/j.jmgm.2006.01.003. [DOI] [PubMed] [Google Scholar]
- 55.Zarrinkar PP, Williamson JR. Kinetic intermediates in RNA folding. Science. 1994;265:918–924. doi: 10.1126/science.8052848. [DOI] [PubMed] [Google Scholar]
- 56.Rangan P, Masquida B, Westhof E, Woodson SA. Assembly of core helices and rapid tertiary folding of a small bacterial group I ribozyme. Proc Natl Acad Sci USA. 2003;100:1574–1579. doi: 10.1073/pnas.0337743100. [DOI] [PMC free article] [PubMed] [Google Scholar]
- 57.Woodson SA. Structure and assembly of group I introns. Curr Opin Struct Biol. 2005;15:324–330. doi: 10.1016/j.sbi.2005.05.007. [DOI] [PubMed] [Google Scholar]
- 58.Kwok LW, Shcherbakova I, Lamb JS, Park HY, Andresen K, Smith H, Brenowitz M, Pollack L. Concordant exploration of the kinetics of RNA folding from global and local perspectives. J Mol Biol. 2006;355:282–393. doi: 10.1016/j.jmb.2005.10.070. [DOI] [PubMed] [Google Scholar]
- 59.Draper DE. A guide to ions and RNA structure. RNA. 2004;10:335–343. doi: 10.1261/rna.5205404. [DOI] [PMC free article] [PubMed] [Google Scholar]
- 60.Draper DE, Grilley D, Soto AM. Ions and RNA folding. Annu Rev Biophys Biomol Struct. 2005;34:221–243. doi: 10.1146/annurev.biophys.34.040204.144511. [DOI] [PubMed] [Google Scholar]
- 61.Grilley D, Soto AM, Draper DE. Mg2+-RNA interaction free energies and their relationship to the folding of RNA tertiary structures. Proc Natl Acad Sci USA. 2006;103:14003–14008. doi: 10.1073/pnas.0606409103. [DOI] [PMC free article] [PubMed] [Google Scholar]
- 62.Olson WK. Configurational statistics of polynucleotide chains: an updated virtual bond model to treat effects of base stacking. Macromolecules. 1980;13:721–728. doi: 10.1021/ma60045a006. [DOI] [PubMed] [Google Scholar]