Abstract
Nano-electrospray tandem mass spectrometry allows qualitative and quantitative analysis of complex membrane lipid mixtures at the subpicomole level. We have exploited this technique to selectively detect individual classes of phospholipids from unprocessed total cellular lipid extracts by either precursor ion or neutral loss scanning. This way phosphatidylcholine, sphingomyelin, phosphatidylinositol and -phosphates, phosphatidylethanolamine, phosphatidylserine, phosphatidylglycerol, phosphatidic acid, and their plasmalogen analogues can be detected. The optimized ionization and fragmentation conditions described together with the principle of internal standardization by nonnatural analogues allow the rapid and quantitative determination of membrane lipid compositions down to sample amounts of 1000 cells.
Keywords: phospholipid, electrospray, tandem mass spectrometry, quantification, membrane lipids, phospholipid mixture analysis
Molecular membrane biology has focused mainly on the dynamics of cellular proteins. More recently, lipid constituents are recognized as potentially important factors in processes of signal transduction and endomembrane transport, such as ceramide signaling or sphingomyelin (SM) rafting (1). These new insights have raised interest in the exact lipid compositions of distinct subcellular membrane systems. In particular, the biosynthetic transport and sorting of membrane lipids is in the focus of current biological research. Purified functional subcellular structures such as protein transport vesicles have been available for several years, but at very low quantity (2). This situation has called for highly sensitive methods to analyze their membrane constituents.
Conventional analytical methods for characterization of membrane phospholipids at the level of their individual molecular species are typically a multistep procedure (3, 4). Lipids are extracted by liquid–liquid extraction and chromatographically separated into phospholipid classes, often derivatized, and analyzed by thin-layer chromatography, high performance liquid chromatography or mass spectrometry (MS) methods. Because this conventional approach is time consuming and often lacks the sensitivity required for analysis of subcellular membranes, we developed a universally applicable analytical method for membrane lipids based on electrospray ionization (ESI) MS (5, 6). Progress in mass spectrometric ionization methods in the past showed that polar lipids in principle can be analyzed using soft ionization techniques such as field desorption (7), chemical ionization (8, 9), or fast atom bombardment (10, 11). However, widespread application was prevented mainly by experimental limitations, such as procedural complexity and poor reproducibility (field desorption), the requirement for particular derivatization procedures (chemical ionization), or the inherent presence of matrix background signals combined with moderate sensitivity (fast atom bombardment). Among the soft ionization methods developed for analysis of polar biomolecules, ESI-MS represents a major breakthrough for biological MS because the technique is directly applied to solutions, does not require derivatization reactions, is characterized by high sensitivity and moderate experimental complexity, and provides reproducible results (8). Using standard equipment, ESI-MS has already been used punctually for characterization (12–16) and quantification (17–19) of phospholipids and other polar lipids.
We have extended these investigations with the goal for a full characterization and quantification of membrane lipids in an unprocessed total lipid extract (20) from cells or subcellular structures by ESI-MS alone. We have approached this goal by combining the following essential features: (i) the use of a nano-ESI source (21, 22, 32) allowing the analysis of picomole or even subpicomole amounts of polar lipids, (ii) the use of tandem mass spectrometric techniques such as parent ion and neutral loss scanning (23, 24), (iii) the use of phospholipid class-specific fragmentations in these tandem MS (MS/MS) analyses at their optimized collision energies, and (iv) the use of synthetic analogues with non-natural fatty acid structures as internal standards for quantification of a particular class of polar lipid. This approach has allowed us to specifically detect phosphatidylcholine (PC), SM, phosphatidylinositol (PI) and -phosphates (InsP), phosphatidylethanolamine (PE), phosphatidylserine (PS), phosphatidylglycerol (PG), and phosphatidic acid (PA), including their plasmalogen analogues. All individual molecular species within these lipid classes can be detected in one analytical run using an unprocessed total lipid extract. Quantification was achieved with sample amounts as low as 1000 cells. The details of the analytical methodology developed are outlined in the following and demonstrated by analyzing the membrane lipids from Chinese hamster ovary (CHO) cells.
MATERIALS AND METHODS
Chemicals and Cells.
PC and SM standards were obtained from Sigma. All solvents used were of analytical grade and obtained from Merck. CHO cells were grown in culture under standard conditions. Generally, 106 cells or smaller aliquots were extracted according to Bligh and Dyher (20). The extracts were taken to dryness under a gentle stream of nitrogen and redissolved in a small volume (20–200 μl) of methanol/chloroform (2:1) containing either 1% acetic acid for positive ion analyses or no additive for negative ion measurements.
Chromatographic Determination of PC and SM.
For comparison, PC and SM were quantified after chromatographic separation and detection using the IATROSCAN TLC/FID Analyzer system (MK-5, Iatron Laboratories, Tokyo) (25).
MS.
Mass spectrometric analyses were performed with a triple quadrupole instrument [Finnigan–MAT (San Jose, CA) model TSQ 7000] equipped with a nanoelectrospray source operating at a typical flow rate of 20–50 nl/min. The electrospray capillary was positioned at a distance of 0.5–1 mm before the orifice of the heated transfer capillary which was maintained at 150°C. As indicated, the instrument was used either in the single-stage MS mode or in the tandem MS mode (product ion, precursor ion, or neutral loss scan).
Before analysis by MS, the lipid extracts were centrifuged in a benchtop centrifuge for 5 min and then a 1–5 μl aliquot was transferred into the electrospray capillary. The spray was started by applying ±400–700 V to the capillary for the detection of positive or negative ions, respectively. For each spectrum between 20 and 100 repetitive scans of 4-sec duration were averaged. All tandem MS experiments were performed with argon as collision gas at a nominal pressure of 2 mTorr. The instrument can be programmed to sequentially perform different scan modes with different parameter sets under computer control using ICL (instrument control language) procedures (26).
RESULTS AND DISCUSSION
ESI and Single-Stage MS.
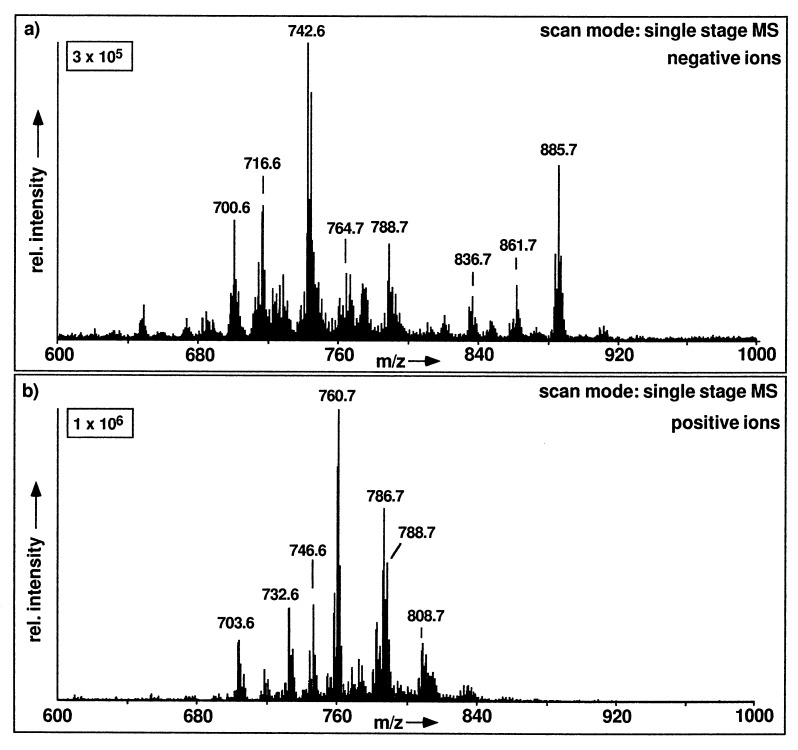
A triple stage quadrupole mass spectrometer is equipped with three quadrupoles designated Q1 to Q3. Q1 and Q3 are identical quadrupoles operated as mass analyzers, whereas Q2 operates as collision cell. When operated in the single-stage MS mode using either Q1 or Q3, ESI mass spectra of cellular lipid extracts show almost exclusively molecular ion species of polar lipids. This is demonstrated in the positive and negative ion mass spectra in Fig. 1, where a variety of molecular ion signals in the region between m/z 600 and m/z 1000 is detected in the analysis of a total lipid extract from CHO cells. The choice of ion polarity sets the first level of specificity in phospholipid analysis by ESI-MS, since the possible charge states of a phospholipid class in solution determine the optimal ion polarity. Thus, the negative ion spectrum in Fig. 1a shows intense ions of the [M-H]− ions of PI, PS, PE, and PG. Accordingly, the positive ion spectrum in Fig. 1b shows the [M+H]+ ions of PC, SM, PE, and PS. A single molecular ion is present with a set of isotopic signals, and m/z values given in this study refer to the monoisotopic molecular weight, since the MS analyses were recorded with about unit mass resolution over the complete mass range. On the basis of their monoisotopic m/z value the major ion signals in the spectra in Fig. 1 can be correctly assigned to individual phospholipid molecular species with a certain carbon number in their fatty acid part and a certain number of double bonds. These identifications are summarized in Table 1. Due to different ionization efficiencies, the relative signal intensities of the ions of different phospholipid classes do not directly represent their molar abundances. This will be described in detail under “Quantification.”
Figure 1.
ESI-MS from an unprocessed total lipid extract from CHO cells. (a) Negative ion mass spectrum. (b) Positive ion mass spectrum. The boxed numbers indicate full-scale intensity in arbitrary units.
Table 1.
Identification of the most abundant signals in the ESI mass spectra of a total lipid extract of CHO cells, as given in Fig. 1 a and b
| Class of phospholipid | Ion | Total fatty acid carbon no.:no. of double bonds
|
||||||||
|---|---|---|---|---|---|---|---|---|---|---|
| (32:1) | (34:2) | (36:2) | (38:4) | (16:0) | (18:0) | (22:0) | (24:1) | (26:0) | ||
| PA | [M-H]− | 645 | 671 | 699 | 723 | |||||
| PS | [M-H]− | 732 | 760 | 786 | 810 | |||||
| PE | [M-H]− | 688 | 716 | 742 | 766 | |||||
| Plasmenyl-PE | [M-H]− | 672 | 700 | 726 | 750 | |||||
| PI | [M-H]− | 807 | 833 | 861 | 885 | |||||
| PG | [M-H]− | 719 | 747 | 773 | 797 | |||||
| PC | [M+H]+ | 732 | 758 | 786 | 810 | |||||
| [M+Na]+ | 754 | 780 | 808 | 832 | ||||||
| Plasmenyl-PC | [M+H]+ | 716 | 742 | 770 | 794 | |||||
| [M+Na]+ | 738 | 764 | 792 | 816 | ||||||
| PE | [M+H]+ | 690 | 718 | 744 | 768 | |||||
| Plasmenyl-PE | [M+H]+ | 674 | 702 | 728 | 752 | |||||
| PS | [M+H]+ | 734 | 760 | 788 | 812 | |||||
| SM | [M+H]+ | 703 | 731 | 787 | 813 | 843 | ||||
| [M+Na]+ | 735 | 753 | 809 | 835 | 865 | |||||
In the negative ion mode, PS and PE (with two nitrogen atoms) show signals at even-numbered m/z values, whereas PI, PG, and PA show signals at odd-numbered values. In the positive ion mode, SM signals appear at odd m/z values (2 nitrogen atoms), whereas PC, PE, and PS-signals occur at even m/z values. The m/z values are nominal monoisotopic data.
The positive ion ESI spectrum in Fig. 1b shows intense [M+H]+ ions of PC and SM, which contain a fixed positive charge in form of a quaternary ammonium group and thus do not give negative ions under normal, nonfragmenting negative ion ESI conditions. In addition, signals due to the [M+H]+ ions of PE and PS are observed.
Negative Ion ESI-MS/MS.
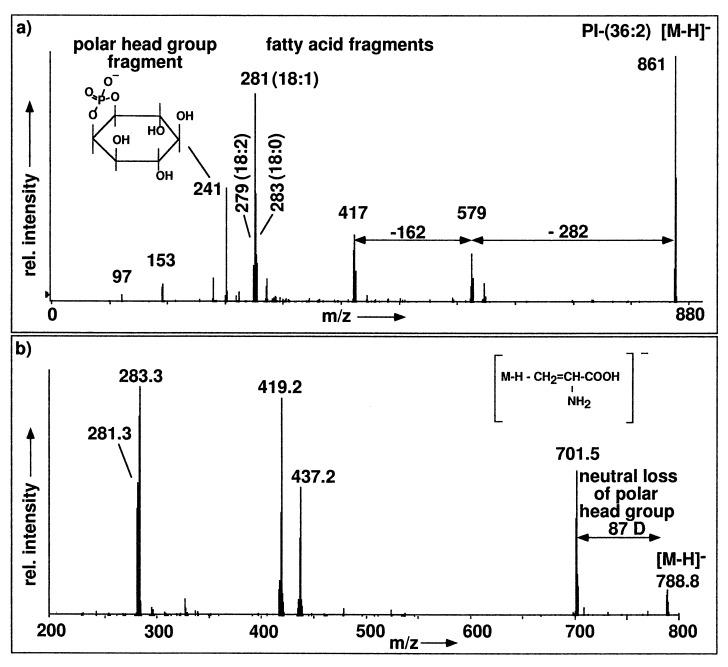
The assignments of the ion signals given in Table 1 can be tested by recording their product ion spectra. For this purpose, a molecular ion signal selected by Q1 is collisionally activated in the collision cell Q2 and the fragment ions formed are analyzed by Q3. As an example, Fig. 2a depicts the product ion spectrum of the signal at m/z 861 in the negative ion spectrum in Fig. 1a. The fragments at m/z 279, 281, and 283 represent the fatty acid anions of linoleic, oleic, and stearic acid, respectively. This indicates PI-(36:2), and the intensity distribution of these ions shows that PI-(36:2) is present as a mixture of PI-(18:1,18:1) as the main component accompanied by a minor amount of PI-(18:0,18:2). The fragment ion at 579 indicates the neutral loss of 282 (=oleic acid), and the fragment ion at 417 shows an additional neutral loss of 162 (=inositol unit -H2O) from the lyso-PI fragment ion at 579. Finally, there are also two fragments characterizing the polar head group of PI, m/z 241 identified as inositolphosphate minus water and m/z 97 as [H2PO4]− anion.
Figure 2.
Product ion spectra of negative ions of phospholipids. (a) Product ion spectrum of the [M-H]− ion of PI-(36:2) at 861.5 in Fig. 1a (collision offset, +40 V). (b) Product ion spectrum of the [M-H]− ion of PS-(36:1) at m/z 788.6 in Fig. 1a (collision offset, +25 V).
In this study we focus on fragmentation reactions of the polar head group of phospholipids. Using a triple quadrupole instrument, these fragmentations allow the specific detection of a phospholipid class by either precursor ion or neutral loss scanning. When the head group is lost as a charged fragment, precursor ion scanning is used, and when the head group is lost as a neutral fragment, neutral loss scanning provides the specific detection. In a precursor ion scan the second mass analyzer Q3 is set to transmit only ions of the m/z value of the selected fragment ion and the first mass analyzer performs scans over a preselected mass range. In a neutral loss scan, both mass analyzers scan simultaneously in a synchronized fashion but with an offset to lower m/z values applied to Q3, which is equivalent to the neutral loss to be detected.
As an example for loss of a polar head group as a neutral fragment, Fig. 2b shows the product ion spectrum of the ion at m/z 788 in Fig. 1a that represents PS-(36:1). The fatty acid anion fragments found at m/z 283 (18:0) and m/z 281 (18:1) characterize the fatty acid part. The polar head group is identified by the fragment ion m/z 701, generated by loss of a neutral fragment serine-H2O of 87 D.
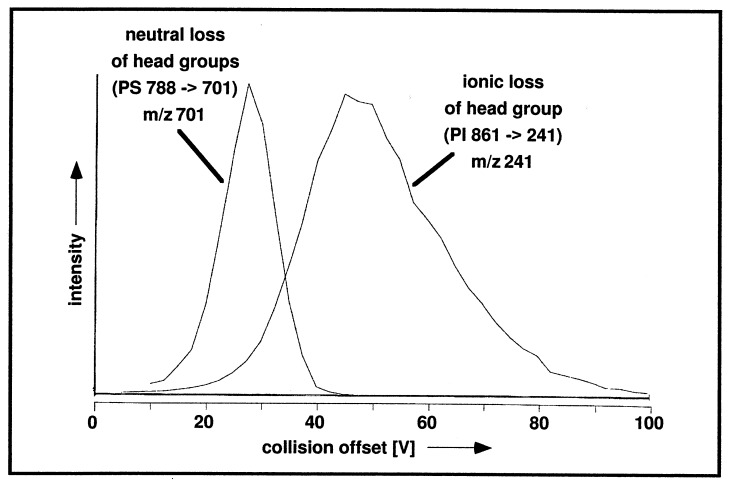
Since specific detection of mixture components by tandem MS involves collision-induced fragmentation, the fragmentation efficiency has to be optimized. We evaluated process-specific optimum collision offset potentials at a constant collision gas pressure by recording the ion signal of interest as a function of the offset potential. For head group-specific fragmentation processes of phospholipids, we observed that formation of a charged fragment generally requires higher offset values (35–50 V) than formation of a neutral fragment (20–28 V). This is exemplified in Fig. 3 for the collision-induced dissociation (CID) of PI and PS. The collision offsets used in this study represent optimal values determined as exemplified in Fig. 3 (see Fig. 6 for a summary).
Figure 3.
Collision offset plots for the loss of a phospholipid head group as ionic fragment [example: loss of inositolphosphate with m/z 241 from PI-(36:2)] and for the loss of a phospholipid head group as neutral fragment [example: loss of serine-H2O from PS-(36:1)].
Figure 6.
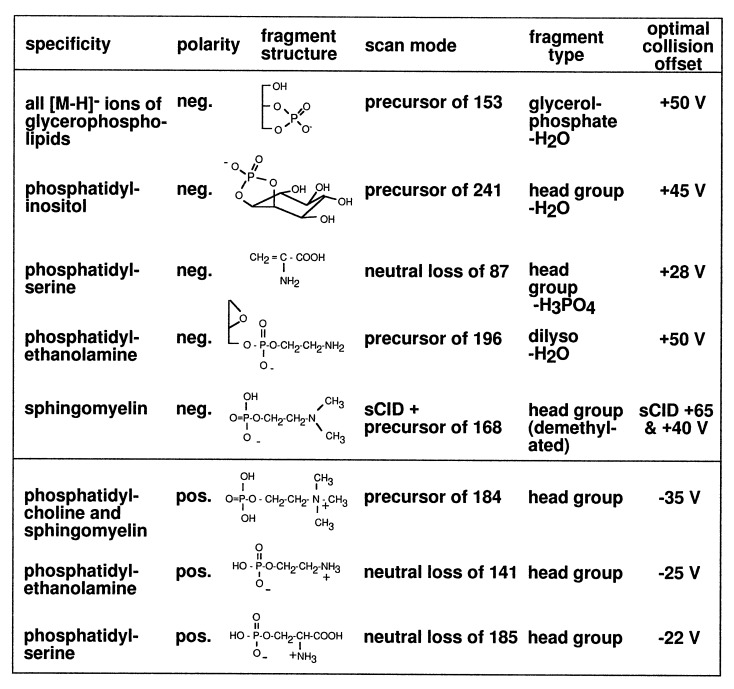
Summary of the phospholipid class-specific scan modes available in positive and negative ion ESI-MS.
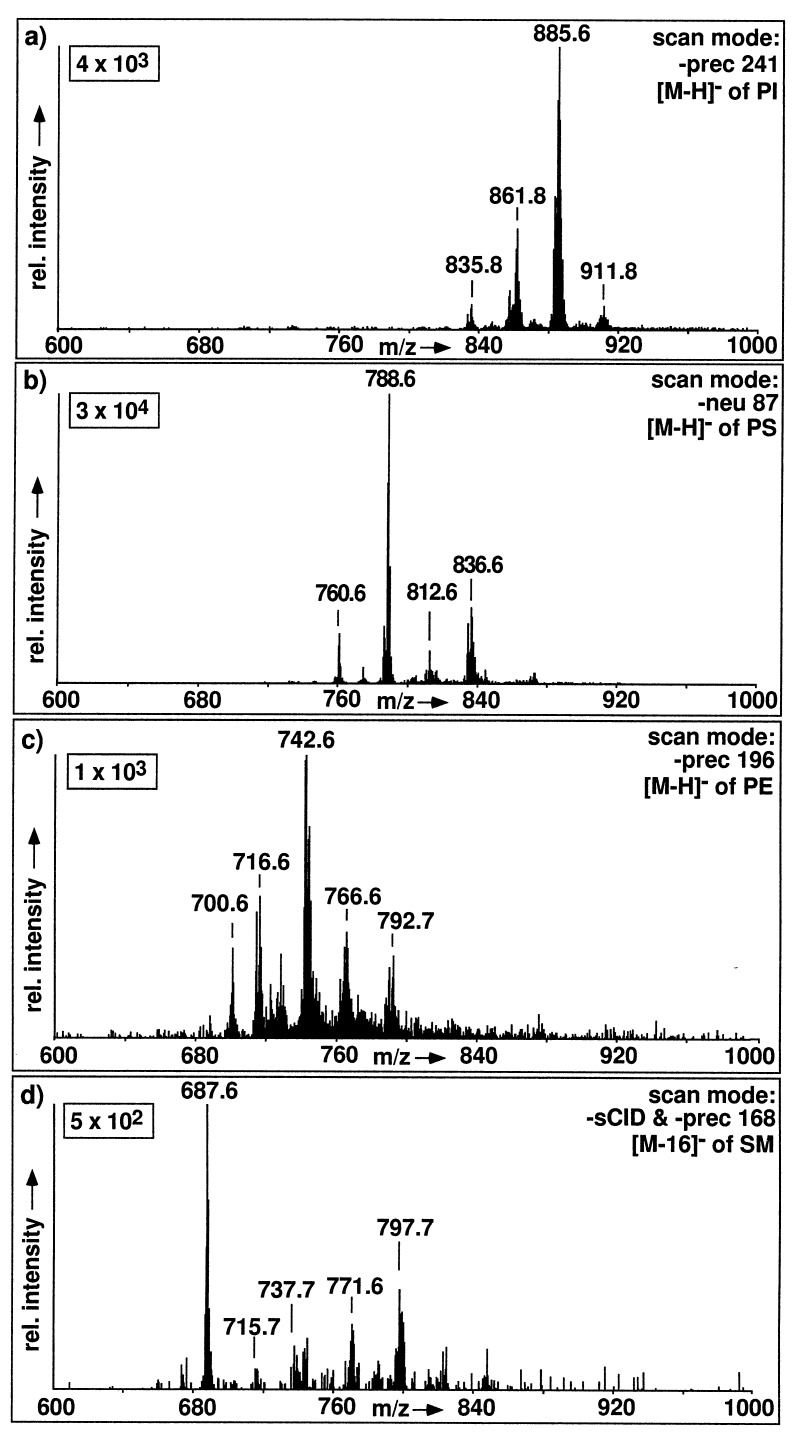
Fig. 4 presents the results of the specfic scan modes available in negative ion ESI-MS/MS for the detection of phospholipid classes: PI is detected by precursor ion scanning of m/z 241 (InsP–H2O), PS is detected by neutral loss scanning of 87 (Ser–H2O), PE is detected by precursor ion scanning for m/z 196 (dilyso-PE–H2O), and SM is detected by a combination of skimmer-CID (collision at the entrance of Q1) with precursor ion scanning for m/z 168 (dimethyl-ethanolaminephosphate).
Figure 4.
Specific detection of phospholipid classes in an unprocessed lipid extract from CHO cells by negative ion ESI tandem MS. (a) Detection of PI by precursor ion scanning for m/z 241 (offset, +45 V). (b) Detection of PS by scanning for neutral loss of 87 D (collision cell offset, +25 V). (c) Detection of PE by precursor ion scanning for m/z 196 (collision cell offset, +40 V). (d) Detection of SM by combined application of skimmer-CID and parent ion scanning for m/z 168 (sCID offset, +65 V; collision cell offset, +40 V).
[M+H]+ ions of both PC and SM show formation of the choline phosphate fragment ion at m/z 184 as the common abundant fragment ion. Negative ions of PC and SM are formed by chloride attachment. Total cellular lipid extracts contain sufficient amounts of chloride ions to effect this adduct ion formation. Upon CID, these adduct ions fragment into dimethylethanolamine [M-16]− homologues in analogy to negative ion fast atom bombardment MS (27). These [M-16]− ions of PC and SM show distinct fragmentation characteristics: [M-16]− ions of PC exhibit loss of acyl groups as fatty acid anions, the main fragmentation pathway in analogy to the [M-H]− ions of other phospholipids. SM molecules do not contain ester-bound fatty acids, and therefore SM-[M-16]− ions suffer a different fragmentation pathway in CID with a main fragment ion at m/z 168 (28), a dimethylaminophosphate anion. This fragment specific for the head group of SM can be used to detect SM as demonstrated in Fig. 4d. For PG and PA, no MS/MS scan mode based on a head group-specific fragmentation could be established. However, all diacylglycerophospholipids form a common fragment at m/z 153 [glycerophosphate–H2O]− and therefore precursor ion scanning for m/z 153 allows a detection of all glycerophospholipids that form negative ions. With this scan mode background signals from mixture constituents other than glycerophospholipids are strongly reduced. Thus, [M-H]− ions of PA from a total lipid extract can specifically be detected, since the molecular ions of PA have significantly lower m/z values than those of all other diacylphospholipids and their plasmalogen analogues.
Positive Ion ESI-MS/MS.
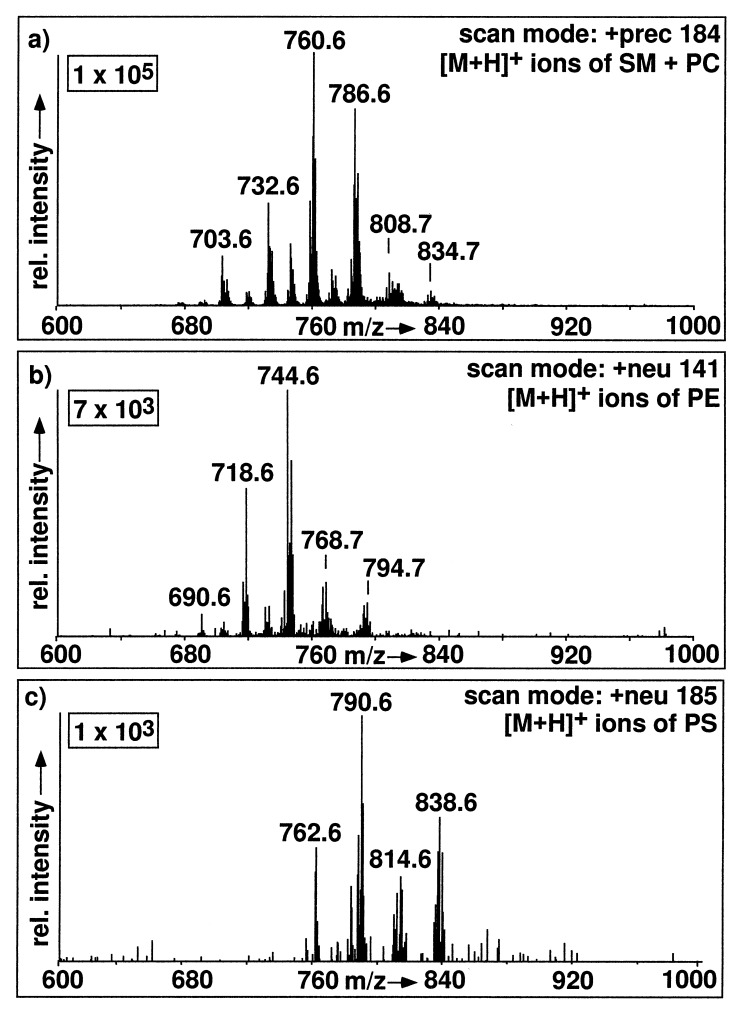
Positive ion ESI spectra of a CHO cell lipid extract exhibit abundant [M+H]+ ions of PC, SM, PE, and PS (Fig. 1b), whose abundances can be increased by acidifying with acetic acid. Due to their common choline head group, both PC and SM show an intense fragment at m/z 184 used for precursor ion scanning, whereby the [M+H]+ ions of PC and SM are specifically detected (Fig. 5a). In single-stage positive ion ESI-MS of total lipid extracts, PC and SM often give rise to three different ions, [M+H]+, [M+Na]+, and [M+K]+. Precursor ion scanning for m/z 184 selectively detects only [M+H]+ ions for choline-containing phospholipids, since PC and SM molecules cationized by sodium or potassium exclusively loose their polar choline phosphate head group as neutral fragment 183 D instead of forming the fragment at m/z 184. A positive ion precursor scan for m/z 184 (Fig. 5a) shows that PC and SM can be easily discriminated, since protonated PC molecules appear at even m/z values, whereas protonated molecules of SM exhibit odd m/z values. This is due to the presence of an additional nitrogen atom in SM. Upon CID, [M+H]+ ions of PE loose their ethanolaminephosphate head groups as a neutral fragment of 141 D. Such a neutral loss scan is given in Fig. 5b. The most intense signals observed at 718, 744, 768, and 794 are [M+H]+ ions of PE, and these signals correspond to the [M-H]− signals in Fig. 4c observed at m/z values minus 2D. For plasmalogen–PE, a negative ion precursor scan for m/z 196 gives a higher response than a neutral loss scan 141 in the positive ion mode. This is consistent with analyses performed on purified PE fractions (data not shown). In addition to PC, SM, PE, and PS can also be analyzed in the positive ion mode as shown in Fig. 5c. Scanning for neutral loss of 185 D provides its specific detection, since CID causes the loss of a neutral serinephosphate unit from [M+H]+ ions of PS. All head group fragmentation processes with their corresponding scan modes and optimal collision energies are summarized in Fig. 6.
Figure 5.
Specific detection of phospholipid classes in an unprocessed total lipid extract of CHO cells by positive ion ESI-MS/MS. (a) Detection of [M+H]+ ions of PC and SM by precursor scanning for m/z 184 (collision cell offset, −35 V). (b) Detection of [M+H]+ ions of PE by scanning for neutral loss of 141 D (collision cell offset, −25 V). (c) Detection of [M+H]+ ions of PS by scanning for neutral loss of 185 D (collision cell offset, −22 V).
Quantification.
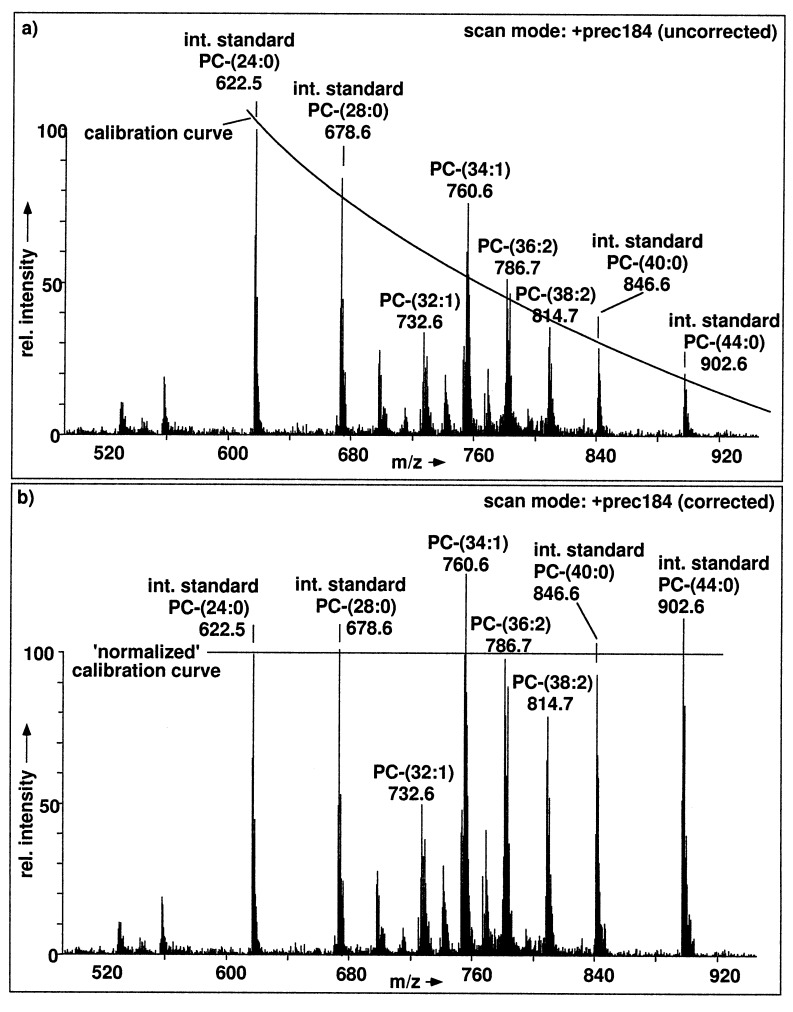
Quantitative determination of a phospholipid class requires the addition of an internal standard because the ionization efficiency between different phospholipid classes of ESI-MS may differ significantly with respect to experimental conditions. A variety of synthetic phospholipids with nonnatural fatty acid compositions are commercially available. We use internal standards that do not occur in a significant amount in the sample to be analyzed (18, 29). For instance, PC-(14:0,14:0) is suitable as internal standard in CHO cells, since PC-(28:0) is not found in these cells (Fig. 5a). The molecular weight distribution of naturally occurring phospholipids generally covers a range of about 100 D (see Figs. 4 and 5), and this range may be increased by the internal standards. Therefore, mass-dependent response of ESI-MS/MS needs to be assessed. The net effect of the molecular weight on signal intensity is the sum of the following physical phenomena: (i) variation of ionization efficiency, (ii) variation in fragmentation efficiency, (iii) variation in ion transmission, and (iv) variation in detector response. The experimental conditions can be adjusted to compensate for differences in fragmentation conditions. Therefore, we investigated the influence of the fatty acid chain length on the intensity and optimal collision offset for the generation of the m/z 184 fragment for a set of PCs: PC-(24:0), -(28:0), -(40:0), and -(44:0). As a result, the optimal collision offset increases with increasing chain length. A corresponding loss in fragmentation efficiency can be compensated by linking the collision offset to the precursor ion scan function so that it is continuously increased during each scan cycle. General loss in sensitivity is observed with increasing molecular weight and this can be compensated by an appropriate calibration function. To this end, the set of four PCs was added as internal standards to bracket the profile of the naturally occurring PCs. A calibration function is then calculated from the ESI-MS/MS mass spectrum and used to correct the experimental ion abundances to the true molar abundances as shown in Fig. 7. For the quantitative analysis of SM, synthetic SM species bracketing the profile of natural SM in CHO cells are not available. Instead we used a single internal standard, SM-(18:1), since this molecular species has a very low abundance in CHO cells. For correction of the measured to the molar abundances, we currently use a calibration curve with the slope determined for PC. Using the procedure described, we quantified PC and SM in small amounts of CHO cells. As a control, we quantified these lipids by a chromoatographic procedure (25), using higher amounts of CHO cells (see Table 2). These data range within those from the literature, with ratios of SM to total phospholipid of 0.11 (30) and 0.063 (31).
Figure 7.
An unprocessed total lipid extract of 5000 CHO cells containing equimolar amounts of PC-(24:0), -(28:0), -(40:0), and -(44:0) was analyzed by parent ion scanning for m/z 184. (a) Uncorrected ion intensities. The signal intensities of the internal standards were used for generation of the calibration plot insert. (b) Corrected ion intensities of the PC signals so that the monoisotopic signals represent the true molar abundances of the corresponding PC molecular species.
Table 2.
Quantification of PC and SM in CHO cells by nano-ESI tandem ms and by a chromtographic method
| No. of cells | Method | Total PC, pmol | Total SM, pmol | Ratio PC/total PL* | Ratio SM/total PL* |
|---|---|---|---|---|---|
| 2.4 × 10⁵ | IATROSCAN | 5058 | 1331 | 0.48 | 0.13 |
| 5 × 10³ | Nano-ESI-MS/MS | 123 | 14.3 | 0.56 | 0.065 |
| 1 × 10³ | Nano-ESI-MS/MS | 21 | 2.6 | 0.48 | 0.06 |
Total phospholipid was quantified by a colorimetric test.
In conclusion, the ESI-MS/MS method introduced provides a new, highly sensitive tool for quantitative determination of membrane phospholipids at the level of their individual molecular species. This was exemplified for PC and SM but also holds for members of the PI, PS, PE, PG, and PA families. Speed and sensitivity are the main advantages of the method presented, and we expect that a number of studies in the field of membrane biology will benefit from this phospholipid quantification method, which is easily applicable using an automated acquisition routine that will be made available via internet.
Acknowledgments
We thank the members of the Wieland laboratory for helpful discussions, in particular Drs. B. Helms and W. Nickel, and we are indebted to Dr. P. Jedrzejewski for his valuable assistance in establishing automated data acquisition protocols. This work was supported by grants from the Deutsche Forschungsgemeinschaft (SFB 352, C2, and C6) and by grants from the Human Frontiers Science Program Organization (to F.T.W.).
ABBREVIATIONS
- ESI
electrospray ionization
- PC
phosphatidylcholine
- SM
sphingomyelin
- PI
phosphatidylinositol
- InsP
phosphatidylinositol-phosphates
- PE
phosphatidylethanolamine
- PS
phosphatidylserine
- PG
phosphatidylglycerol
- PA
phosphatidic acid
- CID
collision-induced dissociation
References
- 1.Simons, K. & Ikonen, E. (1997) Nature (London), in press. [DOI] [PubMed]
- 2.Rothman J E, Wieland F T. Science. 1966;272:227–234. doi: 10.1126/science.272.5259.227. [DOI] [PubMed] [Google Scholar]
- 3.Blank M L, Cress E A, Lee T, Stephens N, Piantadosi C, Snyder F. Anal Biochem. 1983;133:430–436. doi: 10.1016/0003-2697(83)90105-7. [DOI] [PubMed] [Google Scholar]
- 4.Patton G M, Robins S J. Methods Enzymol. 1990;187:195–215. doi: 10.1016/0076-6879(90)87025-x. [DOI] [PubMed] [Google Scholar]
- 5.Yamashita M, Fenn J B. J Phys Chem. 1984;88:4451–4459. [Google Scholar]
- 6.Fenn J B, Mann M, Meng C J, Wong S F, Whitehouse C M. Science. 1989;246:64–71. doi: 10.1126/science.2675315. [DOI] [PubMed] [Google Scholar]
- 7.Lehmann W D, Kessler M. Biomed Mass Spectrom. 1983;10:220–226. doi: 10.1002/bms.1200100320. [DOI] [PubMed] [Google Scholar]
- 8.Haroldsen P E, Murphy R C. Biomed Environ Mass Spectrom. 1987;14:573–578. doi: 10.1002/bms.1200141007. [DOI] [PubMed] [Google Scholar]
- 9.Jungalwala F B, Evans J E, McCluer R H. J Lipid Res. 1984;25:738–749. [PubMed] [Google Scholar]
- 10.Lehmann W D, Kessler M. Chem Phys Lipids. 1983;32:123–135. doi: 10.1016/0009-3084(83)90047-6. [DOI] [PubMed] [Google Scholar]
- 11.Chilton F H, III, Murphy R C. Biomed Environ Mass Spectrom. 1986;13:71–76. doi: 10.1002/bms.1200130205. [DOI] [PubMed] [Google Scholar]
- 12.Han X, Gross R W. Proc Natl Acad Sci USA. 1994;91:10635–10639. doi: 10.1073/pnas.91.22.10635. [DOI] [PMC free article] [PubMed] [Google Scholar]
- 13.Kerwin J L, Tuininga A R, Ericsson L H. J Lipid Res. 1994;35:1102–1114. [PubMed] [Google Scholar]
- 14.Kim H-Y, Wang T-C L, Ma Y-C. Anal Chem. 1994;66:3977–3982. doi: 10.1021/ac00094a020. [DOI] [PubMed] [Google Scholar]
- 15.Han X, Gross R W. J Am Soc Mass Spectrom. 1995;6:1202–1210. doi: 10.1016/1044-0305(95)00568-4. [DOI] [PubMed] [Google Scholar]
- 16.Kwon G, Bohrer A, Han X, Corbett J A, Ma Z, Gross R W, McDaniel M L, Turk J. Biochim Biophys Acta. 1996;1300:63–72. doi: 10.1016/0005-2760(95)00223-5. [DOI] [PubMed] [Google Scholar]
- 17.Metzger K, Rehberger P, Erben G, Lehmann W D. Anal Chem. 1995;67:4178–4183. [Google Scholar]
- 18.Han X, Gubitosi-Klug R A, Collins B J, Gross R W. Biochemistry. 1996;35:5822–5832. doi: 10.1021/bi952927v. [DOI] [PubMed] [Google Scholar]
- 19.Ford D A, Han X, Horner C C, Gross R W. Biochemistry. 1996;35:7903–7909. doi: 10.1021/bi960552n. [DOI] [PubMed] [Google Scholar]
- 20.Bligh E G, Dyer W J. Can J Biochem Physiol. 1959;37:911–917. doi: 10.1139/o59-099. [DOI] [PubMed] [Google Scholar]
- 21.Wilm M, Mann M. Int J Mass Spectrom Ion Proc. 1994;136:167–180. [Google Scholar]
- 22.Wilm M, Mann M. Anal Chem. 1996;68:1–8. doi: 10.1021/ac9509519. [DOI] [PubMed] [Google Scholar]
- 23.Yost R A, Enke C G. Anal Chem. 1979;51:1251A–1264A. doi: 10.1021/ac50048a002. [DOI] [PubMed] [Google Scholar]
- 24.Hayes R N, Gross M L. Methods Enzymol. 1990;193:237–263. doi: 10.1016/0076-6879(90)93418-k. [DOI] [PubMed] [Google Scholar]
- 25.Kramer J K G, Farnworth E R, Thompson B K. Lipids. 1985;20:536–541. doi: 10.1007/BF02534895. [DOI] [PubMed] [Google Scholar]
- 26.Wheeler K. Instrument Control Language Manual. San Jose, CA: Finnigan–MAT; 1994. [Google Scholar]
- 27.Münster H, Stein J, Budzikiewicz H. Biomed Environ Mass Spectrom. 1986;13:423–427. [Google Scholar]
- 28.Ann Q, Adams J. Biol Mass Spectrom. 1993;22:285–294. [Google Scholar]
- 29.Lehmann, W. D., Koester, M., Erben, G. & Keppler, D. (1997) Anal. Biochem., in press. [DOI] [PubMed]
- 30.Cezanne L, Navarro L, Tocanne J F. Biochim Biophys Acta. 1992;1112:205–214. doi: 10.1016/0005-2736(92)90393-z. [DOI] [PubMed] [Google Scholar]
- 31.Warnock D E, Roberts C, Lutz M S, Blackburn W A, Young W W, Jr, Baenzinger J U J. J Biol Chem. 1993;268:10145–10153. [PubMed] [Google Scholar]
- 32.Wilm M, Shevchenko A, Houthaeve T, Breit S, Schweigerer L, Fotsis T, Mann M. Nature (London) 1996;379:466–469. doi: 10.1038/379466a0. [DOI] [PubMed] [Google Scholar]


