Abstract
The understanding of mechanisms controlling zinc absorption and metabolism at the molecular level has advanced recently. Kinetics of zinc transport have been investigated for many years, but only recently have genes coding for proteins thought to be involved in the transport process been cloned. Four putative zinc transporters, known as ZnT-1 through ZnT-4, have now been described. Among these transporters, only ZnT-1 is ubiquitously expressed. In this report, we examine the pattern of ZnT-1 expression in the intestine and analyze the regulation of ZnT-1 by dietary zinc in both the intestine and liver. Immunofluorescence demonstrated that intestinal ZnT-1 was most abundant at the basolateral surface of enterocytes lining the villi of the duodenum and jejunum. By Western blot analysis, intestinal and liver ZnT-1 protein migrated as a 42- and 36-kDa protein, respectively. Dietary zinc supplementation elevated the level of intestinal ZnT-1 mRNA and protein approximately 50% and 10%, respectively, but had no effect in the liver. In response to an acute oral zinc dose, the level of intestinal ZnT-1 mRNA was up-regulated 8-fold, without a corresponding increase in ZnT-1 protein. Conversely, the acute oral dose did not affect liver ZnT-1 mRNA, but resulted in a 5-fold increase in liver ZnT-1 protein. These results represent studies on the expression of intestinal and hepatic ZnT-1 in an intact animal model. The data suggest that ZnT-1 is at least part of the mechanism by which dietary zinc is absorbed and that, despite the zinc responsiveness of the ZnT-1 gene, additional factors may be regulating the steady-state level of ZnT-1 transporter protein.
Zinc plays essential roles in almost all aspects of metabolism, from catalysis to structural determinants to regulatory functions (1). As a highly charged, hydrophilic ion, Zn(II) cannot cross biological membranes by simple diffusion, and specialized mechanisms therefore must exist for its cellular uptake and release. Zinc absorption has been studied extensively in several model systems, particularly perfused intestinal segments (2, 3) and isolated intestinal cells (4). Zinc transport has been characterized in many cell types, including fibroblasts (5), hepatocytes (6, 7), placental trophoblasts (8), and endothelial cells (9). Several characteristics of zinc transport can be deduced from these studies. Zinc transport is a time-, concentration-, pH-, and temperature-dependent process, although there appear to be both saturable and nonsaturable components (reviewed in ref. 10). Additionally, zinc ligands, such as BSA, may play an important role either directly in transport or in delivering zinc to the cell surface (7, 9). Although the kinetic characteristics of mammalian zinc uptake and efflux have been studied extensively, only recently have the genes involved in zinc transport received attention.
Four putative mammalian zinc transporters, termed ZnT-1, -2, -3, and -4, have now been cloned (11–14). ZnT-1 exhibits a wide pattern of expression, in contrast to the highly tissue-specific expression of ZnT-2, -3, and -4. ZnT-1 is an integral membrane protein with a deduced length of 507 aa and is predicted to contain six transmembrane-spanning domains (11). It shares limited homology to the yeast cobalt transporter COT1 (15). The ZnT-1 sequence contains the motif (His-Gly)8 in the large intracellular loop between membrane-spanning regions 4 and 5. Although attractive as a zinc-binding domain, the presence of similar motifs in other metal transporters, such as the plant iron transporter IRT (16), makes this potential role less clear. ZnT-1 has been placed into a newly described family of proteins termed CDF (cation diffusion facilitator) proteins, which can be defined by a specific sequence motif (reviewed in ref. 17). Members of this protein family are found at all phylogenetic levels, suggesting that these proteins may be of ancient origin.
Previously, it was found that overexpression of ZnT-1 in baby hamster kidney cells (BHK) enabled resistance to high concentrations of extracellular zinc, by apparently conferring zinc export activity (11). In comparison to untransfected cells, ZnT-1-overexpressing cells exhibited lower intracellular zinc levels, as measured by a reporter construct containing several metal response elements. The localization of ZnT-1 was assessed by expression of a ZnT-1–green fluorescent protein (GFP) fusion protein. When ZnT-1-GFP was expressed in isolated cells, fluorescence was localized to the plasma membrane (11). Taken together, these data suggested that ZnT-1 was a zinc exporter localized at the plasma membrane and was important for eliminating excess, and therefore potentially toxic, levels of zinc.
Although the overexpression of ZnT-1 in unpolarized BHK cells has yielded a proposed function of this membrane transporter protein, that of a zinc exporter, its role in intact animal zinc homeostasis is entirely unknown. In this report we examine in which region of the intestine ZnT-1 is expressed and address the regulation of ZnT-1 in rat intestine and liver by dietary zinc.
MATERIALS AND METHODS
Animals and Dietary Treatments.
Male Sprague–Dawley strain rats (Harlan Breeders, Indianapolis), with a starting weight of 175–200 g, were housed and fed individually and handled as described previously (18). In some experiments, the rats were fed commercial rodent diet and municipal water. In other experiments, the rats were given free access to a purified diet (AIN76) containing either 5, 30, or 180 mg Zn/kg diet (19) and deionized water for 1 week. For oral dosing experiments, they were fasted 12 h before the start of the experiment but had free access to water. After fasting, the rats were administered saline containing zinc (as zinc sulfate) to a final dose of 35 mg Zn/kg body weight by feeding tube. The serum zinc concentration was measured by atomic absorption spectrophotometry (19). All procedures were approved by the University of Florida Institutional Animal Care and Use Committee.
Isolation of ZnT-1 Sequence.
Mucosa from the first 30 cm of intestine from a zinc-adequate rat was homogenized in TRIzol reagent (Life Technologies) to isolate total RNA. Poly(A)+ RNA was selected by using an oligo(dT) column (5 Prime → 3 Prime) and reverse-transcribed by using oligo(dT) and Superscript II reverse transcriptase (Life Technologies). Primers were designed to correspond to nucleotides 214–235 (gctgctgctgaccttcatgttc) and 1618–1639 (gggacactgccttcagctttag) of the previously published kidney ZnT-1 sequence (11). PCR was performed by using Amplitaq polymerase (Perkin–Elmer) in 30 amplification cycles and an annealing temperature of 57°C. The PCR product was ligated into the pCRII vector, and InVαF′ bacteria (Invitrogen) were transformed with the plasmid before selection on Luria–Bertani (LB)-ampicillin plates. A transformant was chosen and grown in LB-ampicillin medium for plasmid preparation. The plasmid containing the PCR product was purified (Promega) and restricted with EcoRI. The insert was sequenced to confirm its identity as ZnT-1. A fragment of 737 bp, which is identical to and contiguous with the kidney ZnT-1 sequence, was generated by an internal EcoRI/BstXI restriction and used as a probe. This cDNA exhibits very low homology to other members of the ZnT family.
Northern Blotting.
Equal amounts of RNA (20 μg) were denatured in formaldehyde and formamide and electrophoresed through a 1% agarose gel containing 2.2 M formaldehyde and Mops buffer (0.1 M Mops/40 mM sodium acetate/5 mM EDTA, pH 7). The RNA was transferred to nylon membranes, cross-linked by ultraviolet exposure, and probed with a [32P]dCTP-labeled ZnT-1 cDNA as described previously (18). All gels were examined for confirmation of complete RNA transfer to the membrane. Relative amounts of mRNA were quantified by densitometry using the nih image 1.6 software, with normalization to the 28S and 18S ethidium bromide-stained RNA bands. β-Actin also was used as a normalization control (data not shown). For visualization of pooled samples, equal amounts of RNA from each individual sample were combined before electrophoresis. The statistics were obtained by Northern blotting and scanning densitometry of the individual samples.
Antibody Production.
The peptide GTRPQVSHGKE was synthesized with an additional cysteine at the carboxyl-terminal end and verified by amino acid analysis and mass spectroscopy (Research Genetics, Huntsville, AL). This peptide was conjugated by virtue of its cysteine residue to maleimide-activated keyhole limpet hemocyanin (KLH) as directed by the manufacturer (Pierce). KLH-conjugated peptide was then injected into New Zealand White Rabbits (Cocalico Biologicals, Reamstown, PA) for production of polyclonal antiserum. A total IgG fraction was prepared from whole serum (20). Peptide-specific antibody was isolated from this total IgG fraction by affinity chromatography over a column (Sulfo-link, Pierce) of immobilized ZnT-1 peptide.
Preparation of Cryptoids and Villus from Intestinal Mucosa.
A fractionation procedure has been described previously for this purpose (21). Fractions that were primarily either crypts or villi were pooled and membrane protein was obtained as described in the next section. Alkaline phosphatase activity was measured in these fractions (21).
Membrane Protein Preparation.
Approximately 300–500 mg of either liver or intestinal mucosa was homogenized in 10 ml HES buffer [20 mM Hepes, pH 7.4/1 mM EDTA/250 mM sucrose/protease inhibitor mixture containing 4-(2-aminoethyl)benzenesulfonyl fluoride, trans-epoxysuccinyl-l-leucylamido(4-guanidino)butane, bestatin, leupeptin, aprotonin, and sodium EDTA (Sigma)] using a Potter–Elvehjem homogenizer. The homogenate was centrifuged at 100,000 × g for 30 min at 4°C. The crude membrane fraction (pellet) was resuspended in HES buffer and stored at –20°C. Protein concentrations were determined by modified Lowry assay (22).
Western Blotting.
Equal amounts of membrane protein (100 μg) were resolved on a 10% SDS/PAGE gel and transferred to nitrocellulose in transfer buffer (192 mM glycine/10 mM Tris/0.05% SDS/20% methanol) for 1 h at 18 V. Blots were stained with Amido black and destained. For western detection, blots were blocked in Tris-buffered saline (TBS-T) (10 mM Tris, pH 7.2/500 mM NaCl/0.1% Tween-20) containing 5% nonfat dry milk for 1 h. Affinity-purified antibody then was applied at 2.5 μg/ml, and, after washing in TBS-T, secondary antibody (anti-rabbit IgG horseradish peroxidase conjugate; Sigma) was applied. The blot was visualized with enhanced chemiluminescence.
Immunofluorescence.
Intestinal cross-sections (5 μm) in paraffin were mounted on slides. These were dewaxed in xylene and then rehydrated with ethanol washes, boiled in 0.1 M sodium citrate, pH 6.0, for 15 min, and incubated in affinity-purified ZnT-1 antibody (10 μg/ml). The slides were washed and incubated in PBS/3% BSA containing goat anti-rabbit IgG-Alexa 594 conjugate (Molecular Probes) at 0.02 mg/ml for 1 h at room temperature. Microscopy was performed with an epifluorescence microscope.
Statistical Analyses.
Data from diet studies were analyzed by using ANOVA followed by the Student–Newman–Keuls multiple comparison test. Oral zinc gavage studies were analyzed by using a one-tailed Student’s t test. Some data initially were log-transformed to achieve homogeneity of variances.
RESULTS
Expression of Intestinal and Liver ZnT-1.
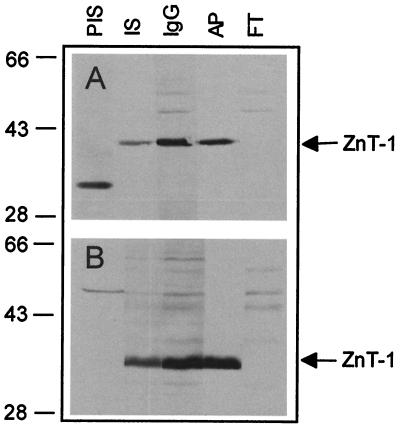
A region predicted to correspond to the carboxyl-terminal end of ZnT-1 was selected for use as an antigen for antibody production. This peptide sequence is not present in the other known members of the ZnT-1 family and shows no significant homology to any other protein in either the GenBank or SwissProt databases. A polyclonal antibody against this ZnT-1 peptide was generated and purified by affinity chromatography. Specificity was confirmed by Western blotting either intestinal mucosa or liver membrane protein with preimmune serum, whole serum, a total IgG fraction, affinity-purified antibody, or the unbound antibody fraction from affinity purification (Fig. 1). In the intestine, whole serum and the total antibody fraction recognized a 42-kDa band with two other minor bands. After affinity purification, the peptide-specific antibody recognized only the 42-kDa band. The unbound IgG fraction from the affinity purification did not recognize the 42-kDa band but recognized the two minor cross-reacting proteins. In the liver, the whole serum, total IgG fraction, and the affinity-purified fraction recognized a 36-kDa band, but no bands were detected by the unbound IgG fraction.
Figure 1.
Specificity of rabbit ZnT-1 antibody. Membrane proteins (100 μg) from either rat intestinal mucosa (A) or liver (B) were resolved on a 10% SDS/PAGE gel and transferred to nitrocellulose. Blots were then probed with the indicated reagent. PIS, preimmune rabbit serum, 1:500 dilution; IS, whole immune serum, 1:500 dilution; and, prepared as described in Materials and Methods, IgG, total IgG fraction, 50 μg/ml; AP, affinity-purified antibody, 2.5 μg/ml; and FT, unbound antibody fraction from affinity purification, 50 μg/ml. Blots were incubated with 2° Ab-horseradish peroxidase conjugate and then visualized with enhanced chemiluminescence. The migration of prestained molecular mass markers is given on the left. Location of ZnT-1 is shown by an arrow.
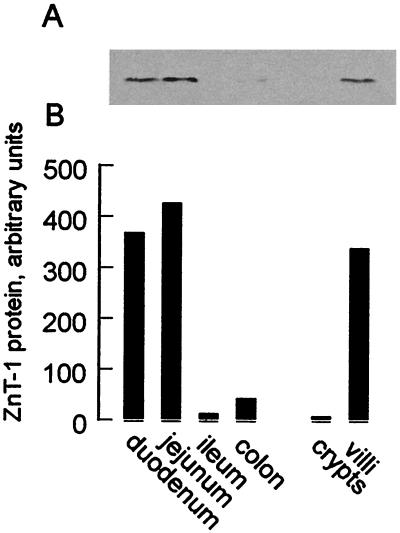
To determine the expression pattern of ZnT-1 in the intestine, sections corresponding to the duodenum, jejunum, ileum, and colon were isolated (first 3 cm, middle 3 cm, and last 3 cm immediately before the cecum and the entire colon, respectively) and membrane protein from mucosal scrapings was obtained. Western blotting indicated that the ZnT-1 transporter protein was present in both the duodenum and jejunum but absent in the ileum and colon (Fig. 2). Furthermore, villi and crypts from the intestine were purified to determine whether ZnT-1 is differentially expressed during intestinal cell maturation. The villus fraction was free of cryptoids, and the cryptoid fraction exhibited alkaline phosphatase activity (a measure of villus contamination) that was 30% of the villus fraction (data not shown). When the relative level of ZnT-1 in the crypts and villi fractions was measured by Western blotting, ZnT-1 expression was found to be restricted to the villi (Fig. 2).
Figure 2.
Expression of ZnT-1 protein in intestinal regions. Mucosal scrapings were isolated from the intestine (duodenum, jejunum, ileum) and the colon. Crypt and villus cells were isolated as described in Materials and Methods. Membrane proteins (100 μg) were isolated, resolved on a 10% SDS/PAGE gel, and transferred to nitrocellulose. (A) ZnT-1 protein in each of these regions and cells examined by Western blot using affinity-purified anti-rat ZnT-1 antibody (Fig. 1) and visualized by chemiluminescence. (B) Densitometry of ZnT-1 protein levels.
Subcellular Immunolocalization of Intestinal ZnT-1.
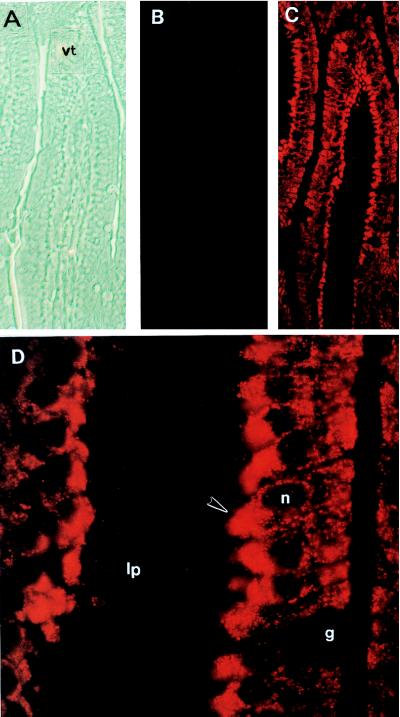
The phase-contrast micrograph in Fig. 3A shows an intestinal villus. Immunofluorescent localization of ZnT-1 in the intestinal villus, using the unbound antibody fraction from affinity purification of anti-ZnT-1 peptide antibody, yielded a low and even background staining (Fig. 3B). In contrast, an equal concentration of the affinity-purified antibody resulted in intense staining of the interior portion of the intestinal enterocytes of the villus that face the lamina propria (Fig. 3C). The cells in the crypts, lamina propria, muscularis, and the goblet cells were not stained. Upon higher magnification, the brightest staining was clearly in the basolateral surface of the enterocytes (Fig. 3D).
Figure 3.
Immunolocalization of intestinal ZnT-1 protein. Cross-sections from the rat intestine were processed for immunofluorescence as described in Materials and Methods. Micrographs are oriented with the villus tip at the top. (A) Phase-contrast image of intestinal villus, ×200 magnification. (B) Immunofluorescence of intestinal villus with the unbound antibody fraction from affinity purification of ZnT-1 antibody, ×200 magnification. (C) Immunofluorescence of ZnT-1 antibody of field of view shown in A, ×200 magnification. (D) Immunofluorescence of ZnT-1 antibody of intestinal villi, ×1,000 magnification of a section shown in C. lp, lamina propria; vt, villus tip; g, goblet cell; n, nucleus of the enterocyte. Arrowhead designates basolateral surface.
Regulation of ZnT-1 by Dietary Zinc.
Expression of the ZnT-1 gene should be regulated by dietary zinc, if this protein plays a role in zinc homeostasis. To test this hypothesis, rats were fed partially purified diets containing either 5 mg Zn/kg (restricted), 30 mg Zn/kg (adequate), or 180 mg Zn/kg (supplemented) for 1 week. As expected, the three diets significantly altered the serum zinc concentrations (Table 1), demonstrating the differing zinc status of the rats. This difference is further demonstrated by Northern blot analysis of metallothionein-1 mRNA, a highly zinc-regulated gene. The level of hepatic and intestinal MT-1 mRNA was markedly elevated by the zinc supplemented diet, and depressed by the zinc restricted diet (Fig. 4A).
Table 1.
Response of serum zinc concentration to experimental conditions
| Treatment | Duration of dose, h | Serum zinc concentration, μg/ml |
|---|---|---|
| Dietary zinc content, mg Zn/kg diet | ||
| 5 | 0.5 ± 0.1a | |
| 30 | 1.4 ± 0.2b | |
| 180 | 2.0 ± 0.2c | |
| Oral zinc dose, mg Zn/kg body weight | ||
| 0 | 2 | 1.4 ± 0.3a |
| 35 | 3.1 ± 1.4b | |
| 0 | 6 | 1.4 ± 0.1a |
| 35 | 1.6 ± 0.2b |
Concentrations were determined by atomic absorption spectrophotometry and are expressed as the mean ± SD (n = 4–6). Within each experiment, a statistically significant difference (P < 0.05) is indicated by a different letter.
Figure 4.
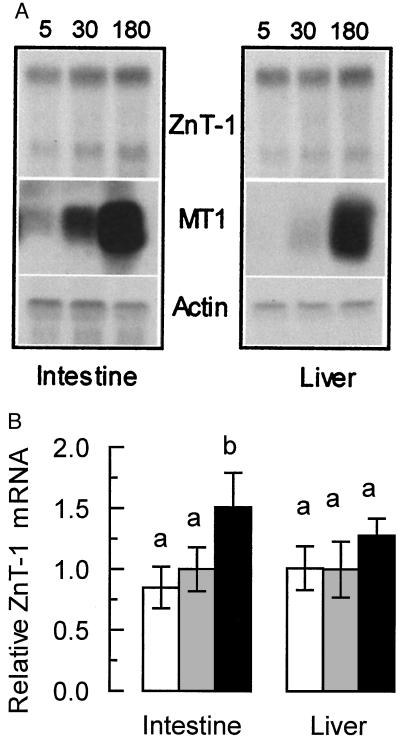
Expression of ZnT-1 mRNA in moderately zinc-restricted and moderately zinc-supplemented rats. Animals were fed purified diets containing 5, 30, or 180 mg Zn/kg for 1 week (n = 4 for each dietary level). Total RNA was then isolated from the intestine and liver of each animal. (A) Equal amounts of total RNA from each animal in a group were pooled and blotted for Northern analysis. The blot was probed for MT, ZnT-1, and β-actin mRNA as described in Materials and Methods. (B) Densitometric measurement of ZnT-1 levels. The relative values reported (mean ± SD) are derived from Northern blotting of RNA from each individual animal from each group followed by densitometry performed as described in Materials and Methods. Dietary zinc concentration was 5 (open bars), 30 (shaded bars), and 180 (solid bars) mg/kg. A statistically significant difference (P < 0.05) is indicated by a different letter above the bar. These results are representative of at least three individual diet studies.
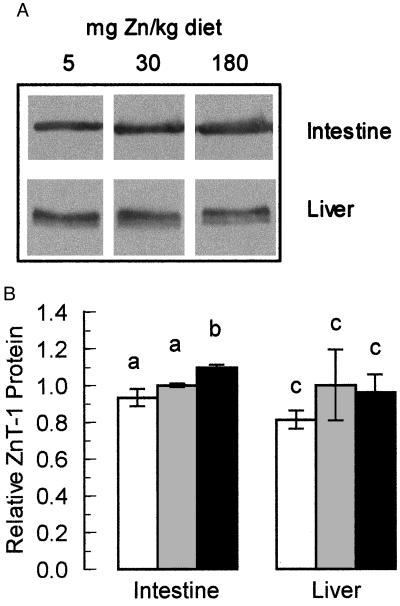
Northern blot analysis showed that the level of ZnT-1 mRNA in the intestine of the zinc-restricted animals was not altered significantly relative to animals fed the zinc-adequate diet (Fig. 4). In those fed the zinc-supplemented diet, however, the level of intestinal ZnT-1 mRNA was elevated significantly by approximately 50%. Comparable data were obtained with normalization with β-actin instead of 28S and 18S RNA. The level of liver ZnT-1 mRNA was not altered by any of the dietary manipulations. These blots show evidence of two transcript sizes for ZnT-1 mRNA, possibly because of mRNA processing. The ratio between the two transcripts was always constant, so the larger transcript was used for quantitation. Membrane protein from each of these animals was obtained and the level of ZnT-1 protein was measured by Western blot. In the intestine, we were able to detect a small but significant (P < 0.01) elevation of ZnT-1 protein in zinc-supplemented animals (Fig. 5). Taken together, these data demonstrate that the intestinal ZnT-1 gene is moderately regulated by elevated levels of dietary zinc.
Figure 5.
Expression of ZnT-1 protein in moderately zinc-restricted and moderately zinc-supplemented rats. Animals were fed purified diets containing 5, 30, or 180 mg Zn/kg for 1 week. (A) Membrane proteins from the intestine and liver of each animal were isolated and probed for ZnT-1 protein by Western blot using affinity-purified anti-rat ZnT-1 antibody (Fig. 1). One representative of each group is shown. (B) Densitometry of ZnT-1 protein levels. The densitometric data, derived by blotting all protein samples individually, are plotted as mean ± SD (n = 4) relative to animals fed the adequate (30 mg Zn/kg) diet. Dietary zinc intake was 5 (open bars), 30 (shaded bars), and 180 (solid bars) mg/kg. A statistically significant difference (P < 0.05) is indicated by a different letter above the bar. These results are representative of at least two individual diet studies.
Regulation of ZnT-1 by an Oral Zinc Dose.
One role for ZnT-1 is as an exporter that may function as a protective mechanism by which cells can eliminate excess zinc. To determine whether ZnT-1 is expressed in a mode compatible with this type of function, we administered what would be equivalent to 1 day’s dietary zinc intake in one bolus and assessed ZnT-1 expression 2 h later. This time point was chosen (i) to test the rapidity of the ZnT-1 response, (ii) because serum zinc levels and intestinal and liver metallothionein mRNA levels are highly up-regulated by this time point (23, 24), and (iii) to minimize any secondary effects that might have an effect on the ZnT-1 expression.
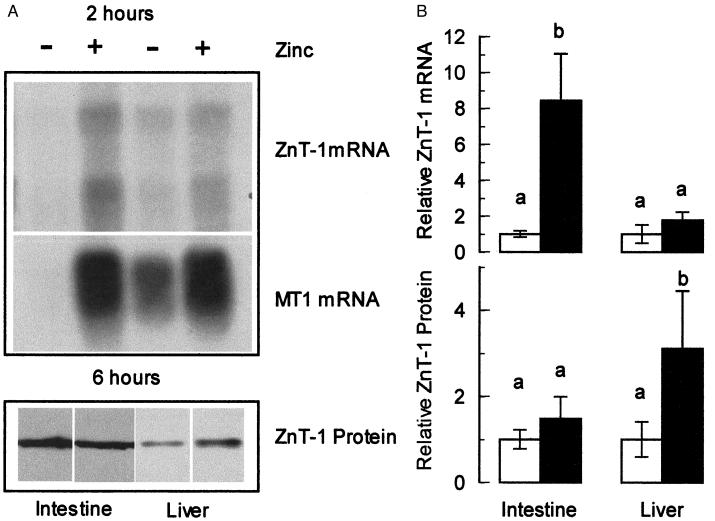
Animals given the high oral zinc dose showed a markedly increased serum zinc level compared with the controls (Table 1). The Northern blot shown in Fig. 6A demonstrates that the level of MT and ZnT-1 mRNA in the intestine is up-regulated approximately 6-fold by 2 h after the zinc dose. In the liver, the level of ZnT-1 mRNA expression was greater in response to zinc, but not significantly. Normalization with either 28S and 18S or β-actin gave comparable results (data not shown). Western blots showed no detectable difference in ZnT-1 protein level in either the intestine or the liver (data not shown). Surmising that the 2-h time point might not be sufficient for the ZnT-1 protein level to be adjusted after the increase in ZnT-1 mRNA, we repeated this experiment by using a 6-h recovery period. At this time point, a small but significant increase in the level of liver ZnT-1 protein was detected in response to the zinc dose (Fig. 6B). These results suggest that a high oral dose of zinc rapidly up-regulates intestinal ZnT-1 mRNA expression in a manner similar to metallothionein. However, as was observed in response to dietary zinc, these treatments result in only modest increases in ZnT-1 protein.
Figure 6.
Expression of ZnT-1 in rats administered an oral zinc dose. Fasted animals were given an oral dose of either saline (−) or zinc sulfate (+) in saline (35 mg Zn/kg body weight). Samples for total RNA (after 2 h) or membrane protein (after 6 h) were obtained from the intestine and liver. (A) Northern blots of ZnT-1 mRNA (Top) or MT-1 mRNA (Middle) from saline- and zinc-treated animals were prepared as described in Fig. 4. Western blots of ZnT-1 protein (Bottom) from saline- and zinc-treated animals using affinity-purified anti-rat ZnT-1 antibody as described in Fig. 5. (B) Densitometry of ZnT-1 mRNA and protein in saline-gavaged (open bars) or zinc-gavaged (solid bars) animals. The densitometric data from Northern (Upper) or Western (Lower) blot were derived from individual samples (n = 4) and plotted as the mean ± SD relative to the saline-gavaged value. A statistically significant difference (P < 0.05) is indicated by a different letter above the bar. These results are representative of at least two individual oral dose studies.
DISCUSSION
In this report we present studies on the localization and regulation of ZnT-1 in intact animals under varying dietary zinc conditions. The results are important in light of previous ZnT-1 studies that were performed in a cell culture model under overexpressing conditions (11) and the paucity of data concerning integrative aspects of ZnT-1 expression.
By generating a highly specific affinity-purified antibody, we have determined that the apparent molecular mass of ZnT-1 in rat intestine is 42 kDa and in the liver is approximately 38 kDa. Although calculation of the molecular mass based on the amino acid composition yields an expected mass of approximately 55 kDa, several other transporter proteins are known to migrate aberrantly by SDS/PAGE analysis. For example, the calculated molecular mass of the glucose transporter GLUT1 based on amino acid composition is predicted to be approximately 55 kDa. The apparent migration, however, as measured by SDS/PAGE, in the absence of its N-linked oligosaccharide, is only 35 kDa (25). The reason, however, for the discrepancy in the apparent migration of ZnT-1 in the intestine and liver is unclear at the present time. ZnT-1 has one consensus sequence for N-linked glycosylation that would be predicted to face extracytoplasmically (N298), but the homogeneous nature of the band observed by Western blot does not support posttranslational modification of this kind. There also could be a difference in phosphorylation state, but the large difference in molecular mass would not be characteristic of this modification. The migration of ZnT-1 in these two tissues was the same in frozen samples and samples prepared the same day (data not shown). Coupled with the wide spectrum of protease inhibitors used in extraction, this leads us to believe that this difference in migration is not because of nonspecific degradation. We believe, based on the control experiments for the antibody, that the recognition of the two proteins is specific; however, we cannot exclude some posttranslational modification such as cleavage. Clearly, this may present some interesting possibilities with regard to the turnover of this protein in different tissues.
Intestinal ZnT-1 was localized at the basolateral surface of the enterocyte in the upper portion of the villus in the duodenum and jejunum. This places the zinc exporter at an anatomical site and cellular orientation compatible with delivery of dietary zinc to the circulation. Intestinal ZnT-1 is fulfilling a function related to zinc acquisition and/or processing. In this way, ZnT-1 could contribute to overall zinc homeostasis (reviewed in refs. 1 and 26). The basolateral orientation of ZnT-1 was a somewhat unexpected finding, because we hypothesized that a zinc exporter with a possible role in eliminating zinc would be targeted to the apical surface so as to be positioned to export excess zinc back into the intestinal lumen.
When the rats were fed diets of various zinc levels, supplementation, but not depletion, could moderately elevate the level of ZnT-1 mRNA in the intestine but not the liver. Correspondingly, we could detect only a small change in the level of ZnT-1 protein in the intestine. The rather modest regulation of ZnT-1, compared with metallothionein, could be explained either because (i) the ZnT-1 gene does not contain as many metal response elements as the metallothionein gene or (ii) other compensatory factors are limiting the up-regulation of ZnT-1. However, these data do agree with our previous work, which reported that zinc transport by basolateral vesicles isolated from the intestine of zinc-adequate and zinc-deficient rats are similar (27). Our data demonstrating ZnT-1 is targeted to the basolateral surface also strongly support the experiments of Palmiter and Findley (11), which proposed the exporter role for this transporter protein.
In summary, the data presented here demonstrate the relevant physiological regulation of ZnT-1 expression by dietary zinc. Although the ZnT-1 gene is zinc-responsive, there are probably compensatory cellular factors that mitigate the magnitude of protein up-regulation. When faced with a large excess of intestinal zinc, ZnT-1 is up-regulated. Alternative posttranslational processes, such as differences in targeting and protein turnover, may also play a role in modulating the amount of transporter that is functionally able to contribute to zinc export. Taken together, the data are consistent with the notion that the role of ZnT-1 is to act as a mechanism for zinc acquisition and elimination, and thus functions as a component of the zinc homeostatic mechanism.
Acknowledgments
The authors acknowledge the assistance of the Biological Computing Core, Histology Core, and DNA Synthesis Core of the University of Florida. The authors thank Steven R. Davis for his help with the oral zinc studies, Raymond K. Blanchard for advice on cloning the rat ZnT-1 cDNA and dietary studies, and Warren R. Clark for advice on fluorescence staining. This investigation was supported by National Institutes of Health Individual National Research Service Award DK 09628 (R.J.M.) and Grant DK 31127 (R.J.C.), and Boston Family Endowment Funds of the University of Florida.
ABBREVIATIONS
- ZnT-1
zinc transporter 1
- MT
metallothionein
References
- 1.Cousins R J. In: Present Knowledge in Nutrition. 7th Ed. Filer L J, Ziegler E E, editors. Washington, DC: Int. Life Sci. Inst. Nutr. Foundation; 1996. pp. 293–306. [Google Scholar]
- 2.Steel L, Cousins R J. Am J Physiol. 1985;248:G46–G53. doi: 10.1152/ajpgi.1985.248.1.G46. [DOI] [PubMed] [Google Scholar]
- 3.Hoadley J E, Leinart A S, Cousins R J. Am J Physiol. 1987;252:G825–G831. doi: 10.1152/ajpgi.1987.252.6.G825. [DOI] [PubMed] [Google Scholar]
- 4.Raffaniello R D, Lee S Y, Teichberg S, Wapnir R A. J Cell Physiol. 1992;152:356–361. doi: 10.1002/jcp.1041520217. [DOI] [PubMed] [Google Scholar]
- 5.Ackland M L, Danks D M, McArdle H J. J Cell Physiol. 1988;135:521–526. doi: 10.1002/jcp.1041350322. [DOI] [PubMed] [Google Scholar]
- 6.Failla M L, Cousins R J. Biochim Biophys Acta. 1978;543:293–304. doi: 10.1016/0304-4165(78)90047-8. [DOI] [PubMed] [Google Scholar]
- 7.Pattison S E, Cousins R J. Am J Physiol. 1986;250:E677–E685. doi: 10.1152/ajpendo.1986.250.6.E677. [DOI] [PubMed] [Google Scholar]
- 8.Mas A, Sarkar B. Biochim Biophys Acta. 1991;1092:35–38. doi: 10.1016/0167-4889(91)90175-w. [DOI] [PubMed] [Google Scholar]
- 9.Bobilya D J, Briske-Anderson M, Reeves P G. J Cell Physiol. 1992;151:1–7. doi: 10.1002/jcp.1041510102. [DOI] [PubMed] [Google Scholar]
- 10.Reyes J G. Am J Physiol. 1996;39:C401–C410. doi: 10.1152/ajpcell.1996.270.2.C401. [DOI] [PubMed] [Google Scholar]
- 11.Palmiter R D, Findley S D. EMBO J. 1995;14:639–649. doi: 10.1002/j.1460-2075.1995.tb07042.x. [DOI] [PMC free article] [PubMed] [Google Scholar]
- 12.Palmiter R D, Cole T B, Findley S D. EMBO J. 1996;15:1784–1791. [PMC free article] [PubMed] [Google Scholar]
- 13.Palmiter R D, Cole T B, Quaife C J, Findley S D. Proc Natl Acad Sci USA. 1996;93:14934–14939. doi: 10.1073/pnas.93.25.14934. [DOI] [PMC free article] [PubMed] [Google Scholar]
- 14.Huang L, Gitschier J. Nat Genet. 1997;17:292–295. doi: 10.1038/ng1197-292. [DOI] [PubMed] [Google Scholar]
- 15.Conklin D S, McMaster J A, Culbertson M R, Kung C. Mol Genet. 1992;244:303–311. doi: 10.1007/BF00285458. [DOI] [PubMed] [Google Scholar]
- 16.Eide D, Broderius M, Fett J, Guerinot M J. Proc Natl Acad Sci USA. 1996;93:5624–5628. doi: 10.1073/pnas.93.11.5624. [DOI] [PMC free article] [PubMed] [Google Scholar]
- 17.Paulsen I T, Saier M H., Jr J Membr Biol. 1997;156:99–103. doi: 10.1007/s002329900192. [DOI] [PubMed] [Google Scholar]
- 18.Blanchard R K, Cousins R J. Proc Natl Acad Sci USA. 1996;93:6863–6868. doi: 10.1073/pnas.93.14.6863. [DOI] [PMC free article] [PubMed] [Google Scholar]
- 19.Blalock T L, Dunn M A, Cousins R J. J Nutr. 1988;118:222–228. doi: 10.1093/jn/118.2.222. [DOI] [PubMed] [Google Scholar]
- 20.Dankert J R, Shiver J W, Esser A F. Biochemistry. 1985;24:2754–2758. doi: 10.1021/bi00332a024. [DOI] [PubMed] [Google Scholar]
- 21.Flint N, Cove F I, Evans G S. Biochem J. 1991;280:331–334. doi: 10.1042/bj2800331. [DOI] [PMC free article] [PubMed] [Google Scholar]
- 22.Markwell M A K, Haas S M, Beiber L L, Tolbert N E. Anal Biochem. 1978;87:206–210. doi: 10.1016/0003-2697(78)90586-9. [DOI] [PubMed] [Google Scholar]
- 23.McCormick C C, Menard M P, Cousins R J. Am J Physiol. 1981;240:E414–E421. doi: 10.1152/ajpendo.1981.240.4.E414. [DOI] [PubMed] [Google Scholar]
- 24.Menard M P, McCormick C C, Cousins R J. J Nutr. 1981;111:1353–1361. doi: 10.1093/jn/111.8.1353. [DOI] [PubMed] [Google Scholar]
- 25.McMahon R J, Frost S C. J Biol Chem. 1995;270:12094–12099. doi: 10.1074/jbc.270.20.12094. [DOI] [PubMed] [Google Scholar]
- 26.King J C, Keen C L. In: Modern Nutrition in Health and Disease. Shils M E, Olson J A, Shike M, editors. Philadelphia: Lea & Febiger; 1994. pp. 214–230. [Google Scholar]
- 27.Oestreicher P, Cousins R J. J Nutr. 1989;119:639–646. doi: 10.1093/jn/119.4.639. [DOI] [PubMed] [Google Scholar]


