Abstract
Endothelial cells are simultaneously exposed to the mechanical forces of fluid wall shear stress (WSS) imposed by blood flow and solid circumferential stress (CS) induced by the blood vessel's elastic response to the pressure pulse. Experiments have demonstrated that these combined forces induce unique endothelial biomolecular responses that are not characteristic of either driving force alone and that the temporal phase angle between WSS and CS, referred to as the stress phase angle, modulates endothelial responses. In this article, we provide the first theoretical model to examine the combined forces of WSS and CS on a model of the endothelial cell plasma membrane. We focus on the strain energy density of the membrane that modulates the opening of ion channels that can mediate signal transduction. The model shows a significant influence of the stress phase angle on the strain energy density at the upstream and downstream ends of the cell where mechanotransduction is most likely to occur.
INTRODUCTION
The wall shear stress (WSS) of flowing blood and the circumferential strain (CS) induced by hoop stresses that balance blood pressure are imposed on endothelial cells (EC) that line arterial walls. These mechanical forces are known to influence gene expression and protein and metabolite secretion of EC and are believed to play a role in the localization of atherosclerosis in regions of curvature and branching in arteries (1). In previous studies we have provided evidence that the temporal phase angle between WSS and CS, a quantity that we have referred to as the stress phase angle (SPA), is most negative (mechanical forces are most out-of-phase) in precisely those regions where atherosclerotic plaques are localized (2–4). In vitro studies demonstrated that for identical WSS and CS waveforms, EC production of the vasoactive agents NO, PGI2, and ET-1 were dramatically affected by the SPA. More negative SPA (−100° compared to −15°) suppressed NO and PGI2 and induced ET-1 production (5). This work was reinforced by a study that showed eNOS, COX-2, and ET-1 gene expression are similarly affected by changes in SPA between 0° and −180° (6). These studies suggested that SPA can influence EC phenotype and this could predispose regions of the circulation to atherosclerotic susceptibility. In support of this, we recently compared gene expression patterns in the left coronary arteries and the aorta of rabbits and observed that eNOS mRNA levels were significantly lower and ET-1 mRNA levels were significantly higher in the coronaries than the aorta (7). Recent observations such as Joshi et al. (8) who found that intimal thickness was not associated with wall shear stress patterns in the right coronary artery, and Steinman et al. (9) who also found no association between wall shear patterns and intimal thickness in the carotid bifurcation, suggest the importance of other factors besides shear stress. It should be noted that these are both regions where WSS and CS are expected to be highly out-of-phase (3,4).
While the above observations are intriguing and point to the importance of interaction between the mechanical forces associated with solid strain (CS) and fluid shear (WSS), there has been no theoretical assessment of the manner by which these forces might interact or the suggestion of a mechanism whereby the phase angle between them (SPA) could be influential. This leads to a consideration of mechanotransduction mechanisms for CS and WSS on endothelial cells. As several review articles have emphasized, the plasma membrane and its associated glycocalyx, the intercellular junctions (adherens junctions), the basal adhesion plaques, and the cytoskeleton are structures that can mediate mechanotransduction (10–13). In this article, we provide an initial attempt to model interaction between CS and WSS by focusing on the plasma membrane only. We build upon an earlier theoretical analysis by Fung and Liu (14), extended by Wiesner et al. (15), that considered how WSS on the plasma membrane could alter the strain energy density (SED) of the membrane and in turn the opening of ion channels mediating signal transduction. These previous studies were based on steady-state (time-averaged) equations for the membrane and assumed that the circumferential tension was zero everywhere. Here we allow for non-zero circumferential tension (CS) and consider the time-dependent equations for the membrane so that the SPA can be introduced and analyzed.
The cyclic circumferential strain on endothelial cells that we model derives from numerous measurements of the diameter variation (outside diameter, D) of arteries over the cardiac pulse showing ΔD/D of 5–10% (16). Because the wall is approximately incompressible, and there is little variation in vessel length over a cardiac pulse due to vessel tethering, the variation in the inside diameter is nearly the same as the outside diameter when the wall thickness is much less than the diameter, as it is in arteries. Since endothelial cells line the inner surface, their circumferential strain is nearly the same as the measured ΔD/D. However, part of this apparent strain could be taken up by separation of endothelial cells at their intercellular junctions. To estimate this effect, we consider that adjacent cells could unfold at most down to their tight junctions. Since the distance from the endothelial cell surface to the tight junction has been estimated to be on the order of 25 nm (17), the maximum apparent strain would be twice this distance (50 nm) divided by the width of a cell (order 10 μm). Thus the maximum apparent strain is ∼0.50%, which is much less than the observed circumferential strains. This implies that most of the strain is taken up by the cell membrane.
MODEL DEVELOPMENT
Following Fung and Liu (14), the endothelial cell is modeled as a body that consists of a thin elastic membrane filled with a solidlike interior. Both the WSS and CS cyclically load the endothelial cell layer, and as we show later, the membrane SED can be described as a function of the CS and WSS and the phase angle between them (SPA).
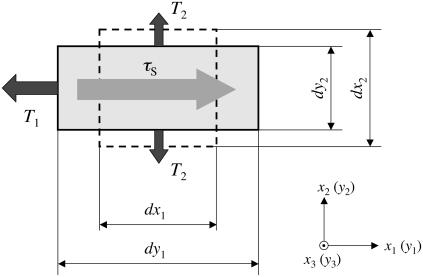
Consider an element of the plane thin membrane of the cell surface with initial lengths dx1 and dx2 parallel to the x1 and x2 axes (dashed lines in Fig.1). The element is small enough to ignore the effect of the curvature of the vessel wall but large enough to assume the material is homogeneous. The unstrained membrane element is expected to be in mechanical equilibrium. When the tensions T1 and T2 are applied in the x1 and x2 directions, respectively, the membrane deforms to new lengths dy1 and dy2 in the x1 and x2 directions (Fig. 1). Further assumptions that simplify the mathematical formulation are the following:
The form of the SED function for a red blood cell membrane (18,19) is applied because the mechanical characteristics of the endothelial cell membrane are similar to those of the red blood cell (15).
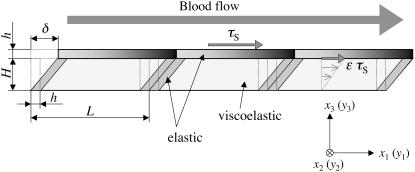
The endothelial cell layer is modeled as a thin elastic membrane with a thick viscoelastic cell body (Fig. 2). The presence of a membrane on the basal side of the cell in Fig. 2 is ignored because its contribution to the variation of the SED is expected to be minor.
The cell membrane is assumed to be an elastic material that can expand/compress when WSS and CS are applied, and the up- and downstream ends are fixed to the cell body. The cell body is assumed to be viscoelastic, allowed to deform when subjected to WSS, but not expandable (length L = const.) (Fig. 2).
The strain in the x2 direction associated with vessel expansion/contraction (circumferential strain) is assumed to be uniform, but the width of the cell can change.
FIGURE 1.
Schematic illustration of membrane deformation (top view).
FIGURE 2.
Endothelial cell layer model (side view).
Governing equations for the membrane tension
To begin the analysis, relationships for elastic deformation based on large deformation theory are introduced. The stretch ratios, λ1 and λ2, are defined as ratios of final to initial lengths:
 |
(1) |
The Green's strain tensor for large deformations is defined by (19,20)
 |
(2) |
A form of the SED per unit of initial volume (area), W, is
 |
(3) |
where A and B are material constants (18) and I1 and I2 are the strain invariants. In particular,
 |
(4) |
where G1 is the shear modulus of the membrane, one-third the Young's modulus when the material is incompressible (Poisson's ratio = 0.5), and h is the thickness of the membrane of ∼10 nm for endothelial cells (14). The lipid bilayer thickness is only 3–5 nm, but h accounts for other structures in the membrane including transmembrane proteins that integrate the membrane with its underlying cortex. Furthermore, h is assumed constant since the strain levels in the membrane are expected to induce very small changes in thickness.
The strain invariants are defined by
 |
(5) |
The tension in the membrane referred to the initial coordinates, Sij (Piola-Kirchoff tension), which has the following relationship with the SED:
 |
(6) |
Here, the tension Sij is related to the stress σij as
 |
(7) |
Expressions for S11 and S22 are derived by substituting Eqs. 3 and 5 into Eq. 6 to find
 |
(8) |
 |
(9) |
Alternative forms can be expressed in terms of the stretch ratios with the help of Eq. 2,
 |
(10) |
 |
(11) |
In the tension field theory, tensions per unit length in the final position, T1 (= T11), T2 (= T22) are related to the Piola-Kirchoff tensions S11, and S22 (20) by
 |
(12) |
where yi is the final coordinate, xk is the initial coordinate, and J = λ1 × λ2. However, for small tensions, T1 and T2 are equal to S11 and S22, respectively. Therefore, the final forms of the tensions are
 |
(13) |
Governing equations for the membrane stretch
The steady-state displacement of the endothelial cell (δ in Fig. 2) obtained from the equation of mechanical equilibrium is
 |
(14) |
where G2 is the shear modulus of the cell content, H (H ≫ h) is the height of the endothelial cell, and following Fung and Liu (14), ɛτS is the fraction of the fluid wall shear stress, τS, that is imposed on the surface of the endothelial cell content.
The equations of mechanical equilibrium for the cell membrane are
 |
(15) |
Integrating Eq. 15 for index i = 1 with respect to x3 over the membrane thickness, we obtain
 |
(16) |
where tensions T1 and (1−ɛ)τS are defined as
 |
(17) |
On the other hand, integrating Eq. 15 for index i = 2 with respect to x3 over the membrane thickness, we obtain
 |
(18) |
The cell and membrane deformation
In this section, the relationship between the cell membrane stretch ratio in the flow direction and the WSS induced on the surface of the cell is developed. We start with Eqs. 8 and 16. Equation 8 can be rewritten as
 |
(19) |
where u is the component of displacement referred to axis x1 in the undeformed body, v is the component of displacement referred to axis x2 in the undeformed body. In this analysis, we assume u is unknown but v is assumed to be a known function of time (t) only (circumferential strain) that is spatially uniform (Eq. 18).
Differentiating both sides of Eq. 19 with respect to x1 and incorporating Eq. 16 yields a second order differential equation for u,
 |
(20) |
The boundary conditions for the above equation are
 |
(21) |
 |
(22) |
Solving Eq. 20 subject to Eqs. 21 and 22 we find
 |
(23) |
The strain component (dv/dx2) in Eq. 23 is calculated using Eq. 2,
 |
(24) |
and the stretch ratio in the flow direction is given by Eq. 2 as well:
 |
(25) |
The cell body has a viscoelastic characteristic that can be described by a Voigt model,
 |
(26) |
where α is the viscoelastic time constant. When the wall shear stress (WSS), τS, varies with time in a sinusoidal fashion as in the experiments (3,6),
 |
(27) |
and where ϕ is the stress phase angle (SPA) between WSS and CS (defined in Eq. 30), the solution is of the form
 |
(28) |
The alternative form of the SED function expressed in terms of the stretch ratios is
 |
(29) |
The transverse stretch ratio (λ2; x2-direction) corresponding to the circumferential strain, CS, is defined as
 |
(30) |
This particular case (that will be considered exclusively in the numerical examples) specifies that the diameter of the artery varies sinusoidally by 5%—from the no-stress state to the 5% dilated state.
The cell sidewall is assumed to be stretched without bending. The sidewall of height H is elongated at the stretch ratio (Fig. 2)
 |
(31) |
The SED of the sidewall is readily obtained as
 |
(32) |
Taken together, the total SED of the cell membrane per unit volume is described as
 |
(33) |
However, because H ≪ L, Eq. 33 becomes
 |
(34) |
The exact value of ɛ (the fraction of the WSS that is imposed on the top of the cell content) in Eq. 14 is not known; therefore a value of ɛ = 0.90 was chosen (14). The value of the stiffness of the membrane (B) was assumed to have the same order of magnitude as the shear modulus of the membrane (A). The other physiological parameters used in the calculations are listed in Table 1.
TABLE 1.
Physiological parameters
| Parameter | Value | Refs. |
|---|---|---|
| Shear modulus of the membrane (G1) | 1.0 × 10⁴ dyne/cm2 | (21) |
| Shear modulus of the cell body (G2) | 1.0 × 10² dyne/cm2 | (26) |
| Membrane thickness (h) | 10 nm | (14) |
| Endothelial cell thickness (H) | 5 μm | (24) |
| Cardiac cycle frequency | 1 Hz | |
| Cell length (L) | 50 μm | (15) |
| Time constant (α) | 60 s | (25) |
| Circumferential stretch ratio (λ2) | 1.025 ± 0.025 | (3) |
| Mean shear stress (τm) | 10 dyne/cm2 | (3) |
| Shear stress amplitude (τt) | 0–40 dyne/cm2 |
RESULTS AND DISCUSSION
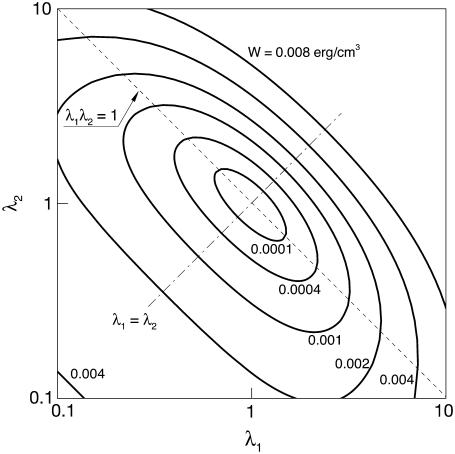
The contours of the SED function (Eq. 29) in the λ1-λ2 plane are shown in Fig. 3. The line labeled λ1λ2 = 1 represents states of constant area. The line λ1 = λ2 represents states of isotropic tension. The strain energy changes gradually along the line of constant area, implying small stresses are induced. However, any departure from the constant area line induces a sharp increase in the value of SED, therefore large stresses. These are typical characteristics of a cell membrane (18).
FIGURE 3.
Contours plot of the SED function in the λ1-λ2 plane.
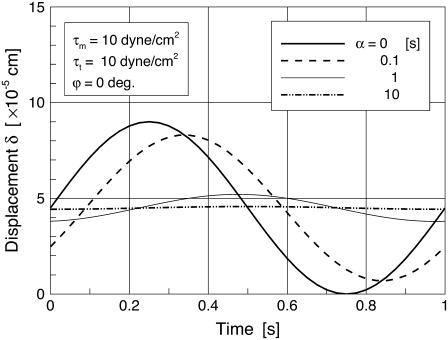
Fig. 4 shows the time variation of the cell deformation (δ) responding to sinusoidal shear stress (in Eq. 28; τm = τt = 10 dyne/cm2) for various values of the time constant α. In the figure, α = 0 corresponds to a purely elastic cell; there is no delay in the cell deformation response relative to the time-varying shear stress. A delayed and attenuated response of δ relative to shear stress becomes obvious as the value of the time constant increases. For α = 10, the cell shows a strong viscoelastic attenuation of the response. The previously observed value of α varies widely (22,23). In this analysis, α = 60 [s] was taken as the characteristic time constant (24,25). Helmke and co-worker (26) investigated the displacement of endothelial cells exposed to a unidirectional shear stress of 12 dyne/cm2 and found that the order of magnitude of the steady-state cell deformation was 1 μm. The time-averaged value of δ in response to τm =10dyne/cm2 in this study is ∼0.5 μm (Fig. 4) based on an endothelial thickness of 5 μm as observed (24,27). Using a viscoelastic time constant of α = 60 [s], we observed the amplitude of the cyclic displacement of the cell body to be of ∼100 nm, which is consistent with experiments of cyclic stretch of cells performed by Peeters et al. (22).
FIGURE 4.
Time variation of the δ responding to pulsatile WSS for various values of the viscoelastic time constant α.
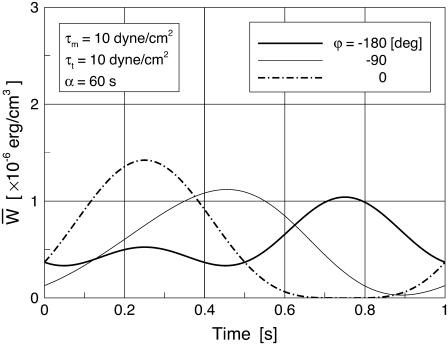
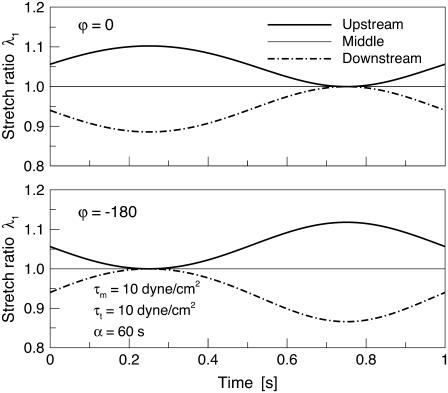
Time variations of the mean (averaged over the membrane surface area) SED,  for three different values of the SPA are displayed in Fig. 5. The waveform of
  varies significantly with the SPA. The peak value of
  gradually decreases as the SPA takes a larger negative value, whereas the minimum value of the
  gradually increases as the SPA takes a larger negative value. Consequently, the time-average value of
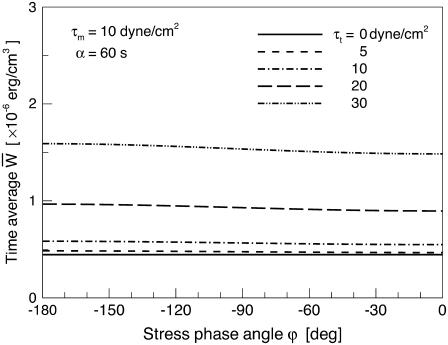
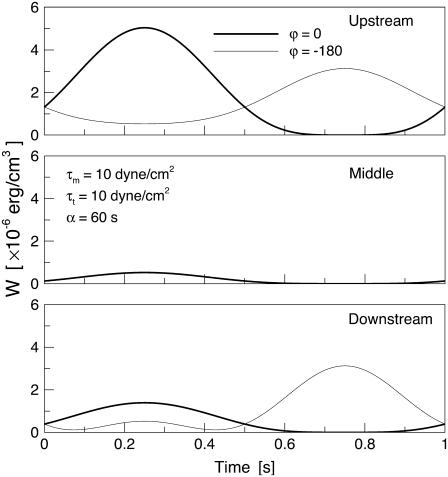
  depends only weakly on the SPA (see Fig. 7). Time variations of the local SED, W, at three representative sites are shown in Fig. 6. In the figure, Upstream, Middle, and Downstream correspond to the upstream end, midpoint, and downstream end of the membrane, respectively. As can be seen by comparing Figs. 5 and 6, the value of W at the upstream end dominates the waveform of
  when WSS and CS are in-phase (ϕ = 0°), while contributions to
  from W at the downstream end become major as the SPA takes a larger negative value. The waveform of
  for ϕ = −180° has two peaks within a single cycle since the WSS and CS take on maximum values alternately.
FIGURE 5.
Time variations of the mean (averaged over the cell area) SED (per unit cell area) for three different values of the SPA, ϕ.
FIGURE 7.
Relationship between the time-average of the mean (averaged over the cell area) SED and the SPA, ϕ, for five different values of the oscillatory shear amplitude, τt.
FIGURE 6.
Time variations of the local SED at three representative sites of the membrane for ϕ = 0, −180°.
Fig. 7 shows the relationship between the time average of  and the SPA for five different values of the oscillatory shear amplitude, τt. The time average of
  is maximum at ϕ = −180°, and the difference between the maximum and the minimum (appears at ϕ = 0) increases with the value of the shear amplitude, but is not great. The shear amplitude effect is much greater than the SPA effect on the time-averaged
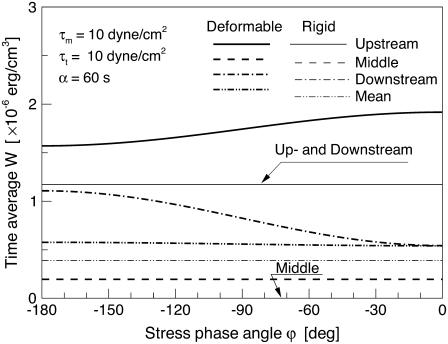
Fig. 8 shows the relationship between the time average of W and the SPA for two different models. In the rigid model, the circumferential stretch ratio, λ2, was set to a fixed value λ2 = 1.0; corresponding to the situation where the vessel diameter is held constant throughout the cardiac cycle. Note that plots of Upstream and Downstream for the rigid model are identical, and the plot of Middle for the rigid model takes on W = 0 for all values of ϕ, because λ1(= λ2) = 1.0 in the middle of the cell membrane. It is very interesting to note that the time-average value of W at both the up- and downstream ends of the membrane for the deformable model approaches the value for the rigid model as the SPA takes on highly negative values. Related to this observation, it is important to realize that Qiu and Tarbell (5) investigated the interaction of sinusoidal WSS (τm = τt = 10 dyne/cm2) and CS on endothelial production of PGI2, NO, and ET-1 using rigid (CS = 0%) and compliant (CS = ±4%) straight tubes. Bovine aortic endothelial cell production of PGI2, NO, and ET-1 for the compliant tube with a highly negative SPA (−110°) showed very similar trends to those of a rigid tube—reduced PGI2 and NO and elevated ET-1, atherogenic characteristics. This suggests that the variations of the SED of the cell membrane near the up and downstream ends of the cell play a role in mechanochemical signal transduction. Related to this, a recent study comparing pulsatile flow effects on BAECs plated on rigid or compliant tubes showed that rigid tubes suppressed Akt-dependent anti-apoptosis signaling (proatherogenic) compared with compliant tubes where stretch and shear were approximately in phase (29). Another study reported that membrane fluidity of sheared endothelial cells that is known to influence signal transduction, varied substantially between the upstream and downstream ends of the cell (30).
FIGURE 8.
Relationship between the value of the time-average of the local SED and SPA for two different models. In the rigid model, circumferential stretch ratio, λ2, was set to a constant value λ2 = 1.0.
A quantitative relationship between SED and membrane ion channel activation was discussed by Sachs (28) and employed by Wiesner et al. (15) to model shear effects on endothelial mechanotransduction. According to this model, the fraction of open channels in the membrane (f0) has a Boltzmann dependence upon the level of strain energy (W) in the membrane expressed as
 |
(35) |
where a and b are constants, k is the Boltzmann constant, T is the absolute temperature, and N is the area channel density. We evaluated the range of f0 predicted by this model for the range of W predicted by our deformable model (0.2–1.8 × 10⁻⁶ erg/cm3 in Fig. 8), initially using the constants employed by Wiesner et al. (15) (a = 3.0, T = 310 K, and b/N = 0.01). The result was f0 in the narrow range 0.97–1.0. However, by reducing b/N to 0.001, which is equivalent to increasing the channel density or reducing the fraction of strain energy that is available to gate channels, the range of f0 widened to 0.35–0.95. This is clearly a range that could affect signal transduction. Based on the distribution of W shown in Fig. 8, it is apparent that f0 could depend on the cell location (upstream or downstream) as well as the SPA.
Additional experimental comparisons can be made with the work of Helmke and co-workers (24), who investigated the magnitude of the principal stretch ratio λ1 of a single cell during a 3-min interval immediately after the onset of 12 dyne/cm2 steady shear stress. In their observations, estimated values of the principal stretch ratio λ1 at the up and downstream ends of the cell were 1.0–1.05—very close to values predicted by this model: 0.95–1.05 (Fig. 9).
FIGURE 9.
Time variation of the local stretch ratio at three representative sites of the membrane for ϕ = 0, −180°.
CONCLUDING REMARKS
In this article, we presented the first model, to our knowledge, that incorporates the influences of both solid circumferential strain (CS) and fluid wall shear stress (WSS) on the mechanics of endothelial cells, including the dynamic relationship between CS and WSS as characterized by the stress phase angle (SPA) that has been shown to be so influential on EC biomolecular behavior (3,6,7). The simplified model only accounts for the plasma membrane as a mechanotransduction element, but does show how the CS and WSS can interact to influence the strain energy density (SED) of the plasma membrane that affects ion channel fluxes and other properties relevant to signal transduction (e.g., membrane fluidity). Comparisons of the trends predicted by the model with experimental results on biomolecular response suggest that the upstream and downstream ends of the cell are the regions where mechanotransduction is most likely to occur. Further elaborations of this model incorporating additional cellular structures (cytoplasm, basal adhesion plaques, and intercellular junctions) should prove useful in understanding mechanotransduction driven by CS and WSS over a physiological range of SPA.
Editor: Kevin D. Costa.
References
- 1.Tada, S., and J. M. Tarbell. 2006. Oxygen mass transport in a compliant carotid bifurcation. Ann. Biomed. Eng. 34:1389–1399. [DOI] [PubMed] [Google Scholar]
- 2.Lee, C. S., and J. M. Tarbell. 1997. Wall shear rate distribution in an abdominal aortic bifurcation model: effects of vessel compliance and phase angle between pressure and flow waveforms. J. Biomech. Eng. 119:333–342. [DOI] [PubMed] [Google Scholar]
- 3.Qiu, Y., and J. M. Tarbell. 2000. Numerical simulation of pulsatile flow in a compliant curved tube model of a coronary artery. J. Biomech. Eng. 122:77–85. [DOI] [PubMed] [Google Scholar]
- 4.Tada, S., and J. M. Tarbell. 2005. A computational study of flow in a compliant carotid bifurcation—stress phase angle correlation with shear stress. Ann. Biomed. Eng. 33:1219–1229. [DOI] [PubMed] [Google Scholar]
- 5.Qiu, Y., and J. M. Tarbell. 2000. Interaction between wall shear stress and circumferential strain affects endothelial cell biochemical production. J. Vasc. Res. 37:147–157. [DOI] [PubMed] [Google Scholar]
- 6.Dancu, M. B., D. E. Berardi, J. P. Vanden Heuvel, and J. M. Tarbell. 2004. Asynchronous shear stress and circumferential strain reduces endothelial NO synthase and cyclooxygenase-2 but induces endothelin-1 gene expression in endothelial cells. Arterioscler. Thromb. Vasc. Biol. 24:2088–2094. [DOI] [PubMed] [Google Scholar]
- 7.Dancu, M. B., and J. M. Tarbell. 2007. Coronary endothelium expresses a pathologic gene pattern compared to aortic endothelium: correlation of asynchronous hemodynamics and pathology in vivo. Atherosclerosis. 192:9–14. [DOI] [PubMed] [Google Scholar]
- 8.Joshi, A. K., R. L. Leask, J. G. Myers, M. Ojha, J. Butany, and C. R. Ethier. 2004. Intimal thickness is not associated with wall shear stress patterns in the human right coronary artery. Arterioscler. Thromb. Vasc. Biol. 24:2408–2413. [DOI] [PubMed] [Google Scholar]
- 9.Steinman, D. A., J. B. Thomas, H. M. Ladak, J. S. Milner, B. K. Rutt, and J. D. Spence. 2002. Reconstruction of carotid bifurcation hemodynamics and wall thickness using computational fluid dynamics and MRI. Magn. Reson. Med. 47:149–159. [DOI] [PubMed] [Google Scholar]
- 10.Tarbell, J. M., and M. Y. Pahakis. 2006. Mechanotransduction and the glycocalyx. J. Intern. Med. 259:339–350. [DOI] [PubMed] [Google Scholar]
- 11.Tarbell, J. M., S. Weinbaum, and R. D. Kamm. 2005. Cellular fluid mechanics and mechanotransduction. Ann. Biomed. Eng. 33:1719–1723. [DOI] [PubMed] [Google Scholar]
- 12.Davies, P. F. 1995. Flow-mediated endothelial mechanotransduction. Physiol. Rev. 75:519–560. [DOI] [PMC free article] [PubMed] [Google Scholar]
- 13.Ingber, D. E. 1998. Cellular basis of mechanotransduction. Biol. Bull. 194:323–325. [DOI] [PubMed] [Google Scholar]
- 14.Fung, Y. C., and S. Q. Liu. 1993. Elementary mechanics of the endothelium of blood vessels. Trans. ASME J. Biomech. Eng. 115:1–12. [DOI] [PubMed] [Google Scholar]
- 15.Wiesner, T. F., B. C. Berk, and R. M. Nerem. 1997. A mathematical model of the cytosolic-free calcium response in endothelial cells to fluid shear stress. Proc. Natl. Acad. Sci. USA. 94:3726–3731. [DOI] [PMC free article] [PubMed] [Google Scholar]
- 16.Milnor, W. R. 1989. Hemodynamics. Williams and Wilkins, Baltimore, MD.
- 17.Fu, B., F. E. Curry, R. H. Adamson, and S. Weinbaum. 1997. A model for interpreting the tracer labeling of interendothelial clefts. Ann. Biomed. Eng. 25:375–397. [DOI] [PubMed] [Google Scholar]
- 18.Skalak, R., A. Tozeren, R. P. Zarda, and S. Chien. 1973. Strain energy function of red blood cell membranes. Biophys. J. 13:245–264. [DOI] [PMC free article] [PubMed] [Google Scholar]
- 19.Evans, E. A. 1973. A new material concept for the red cell membrane. Biophys. J. 13:926–940. [DOI] [PMC free article] [PubMed] [Google Scholar]
- 20.Green, A. E., and J. E. Adkins. 1970. Large Elastic Deformations. Oxford University Press, Oxford, UK.
- 21.Sato, M., N. Ohshima, and R. M. Nerem. 1996. Viscoelastic properties of cultured porcine aortic endothelial cells exposed to shear stress. J. Biomech. 29:461–467. [DOI] [PubMed] [Google Scholar]
- 22.Peeters, E. A. G., C. W. J. Oomens, C. V. C. Bouten, D. L. Bader, and F. P. T. Baaijens. 2005. Viscoelastic properties of single attached cells under compression. Trans. ASME J. Biomech. Eng. 127:237–243. [DOI] [PubMed] [Google Scholar]
- 23.Feneberg, W., M. Aepfelbacher, and E. Sackmann. 2004. Microviscoelasticity of the apical cell surface of human umbilical vein endothelial cells (HUVEC) within confluent monolayers. Biophys. J. 87:1338–1350. [DOI] [PMC free article] [PubMed] [Google Scholar]
- 24.Helmke, B. P., A. B. Rosen, and P. F. Davies. 2003. Mapping mechanical strain of an endogenous cytoskeletal network in living endothelial cells. Biophys. J. 84:2691–2699. [DOI] [PMC free article] [PubMed] [Google Scholar]
- 25.Helmke, B. P., D. R. Goldman, and P. F. Davies. 2000. Rapid displacement of vimentin interface filaments in living endothelial cells exposed to flow. Circ. Res. 86:745–752. [DOI] [PubMed] [Google Scholar]
- 26.Helmke, B. P., D. B. Thakker, R. D. Goldman, and P. F. Davies. 2001. Spatiotemporal analysis of flow-induced intermediate filament displacement in living endothelial cells. Biophys. J. 80:184–194. [DOI] [PMC free article] [PubMed] [Google Scholar]
- 27.Hélène, K., J. Lammerding, H. Huang, R. D. Kamm, and M. R. Kaazempur-Mofrad. 2003. A three-dimensional viscoelastic model for cell deformation with experimental verification. Biophys. J. 85:3336–3349. [DOI] [PMC free article] [PubMed] [Google Scholar]
- 28.Sachs, F. 1986. Biophysics of mechanoreception. Membr. Biochem. 6:173–195. [DOI] [PubMed] [Google Scholar]
- 29.Li, M., K.-R. Chiou, A. Bugayenko, K. Irani, and D. A. Kass. 2005. Reduced wall compliance suppresses Akt-dependent apoptosis protection stimulated by pulse perfusion. Circ. Res. 97:587–595. [DOI] [PubMed] [Google Scholar]
- 30.Butler, P. J., G. Norwich, S. Weinbaum, and S. Chien. 2001. Shear stress induces a time- and position-dependent increase in endothelial cell membrane fluidity. Am. J. Physiol. Cell Physiol. 280:C962–C969. [DOI] [PubMed] [Google Scholar]


