Abstract
Thermodynamics and kinetics of the interaction between T cell receptor specific for cytomegalovirus peptide (TCRCMV) and its specific ligand, pp65–HLA-A*0201 complex, were studied by surface plasmon resonance and stopped-flow methods. In the latter measurements, fluorescence resonance energy transfer (FRET) between fluorescently labeled reactants was used. Thermodynamic data derived from surface plasmon resonance measurements suggest that the complex formation is driven by both favorable enthalpy and entropy. Two reaction phases were resolved by the stopped-flow measurements. The rate constant of the first step was calculated to be close to the diffusion-controlled limit rate (3·105 to 106 M−1·s−1), whereas the second step's reaction rate was found to be concentration independent and relatively slow (2–4 s−1 at 25°C). These findings strongly suggest that the interactions between the TCR and its ligand, the peptide–MHC complex, proceed by a two-step mechanism, in which the second step is an induced-fit process, rate determining for antigen recognition by TCR.
Keywords: conformational changes, T cell receptor–ligand interactions, FRET, stopped flow, induced fit
T cell receptor (TCR) association with its ligand, a peptide bound to molecules encoded by class I or II of the major histocompatibility complexes (pMHC), is the initial process in T cell activation (1–3). This process can induce different types of immune responses depending on the nature of the pMHC and the involved T cell (4–6). It is well established that despite the prevalent micromolar affinity, this interaction is characterized by such an exquisite sensitivity that even just a few antigenic pMHC molecules can be recognized on an antigen-presenting cell (APC) (7). At the same time, a TCR was shown to cross-react with different antigenic pMHC ligands (8–10). Three-dimensional structures determined for more than two dozen different TCR–pMHC complexes revealed similar diagonal orientations of TCR molecules with respect to their pMHC ligands (11, 12). It was also found that two of the complementarity-determining regions (CDRs) of the TCR, CDR1 and CDR2, interact predominantly with the MHC molecules, whereas the CDR3 interacts with exposed peptide residues. Importantly, significant conformational changes in the TCR, mainly in its CDR3, have been observed in crystallographic studies (10, 13, 14). These structural studies provide a static picture and require time-resolved analysis of the process to deepen the understanding of the molecular mechanism of antigen recognition by the TCR.
Kinetic studies carried out to date have used the surface plasmon resonance (SPR) method, which has several deficiencies. First and foremost, its time resolution is limited. Essentially, results of all such studies were interpreted as bimolecular processes with a relatively slow rate constant of complex formation and a fast rate of its dissociation (3). This slow association rate was assigned to a conformational transition in the TCR binding site (15). This notion provided the basis for proposing a two-step mechanism for the TCR–pMHC interaction (16). One detailed model suggested that interactions between the CDR1 and -2 domains with the MHC take place during the first step, which is followed by CDR3 association with exposed peptide residues during the second step that involves conformational changes (17). However, practically all reports suggesting the operation of a two-step mechanism lack experimental evidence because the elementary steps of the TCR–ligand interactions were not resolved. This lack of information has therefore been, and remains, a significant experimental challenge (18). Here we report resolution of a two-phase interaction time course of the TCR and pMHC association monitored by stopped-flow measurements using FRET between a donor labeled specific ligand and its acceptor labeled TCR.
Results
TCR Specific for Cytomegalovirus Peptide (TCRCMV)–pp65–HLA-A*0201 Interaction Measurements by SPR.
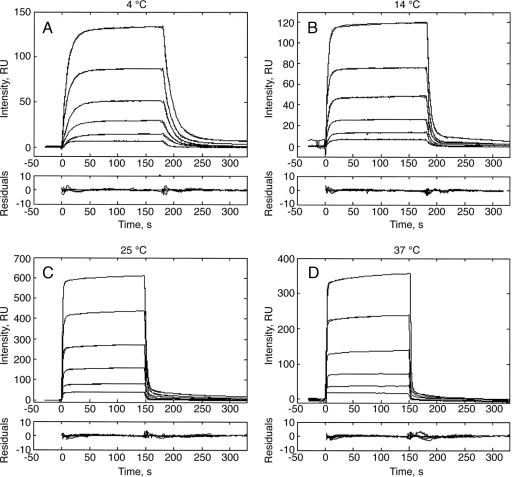
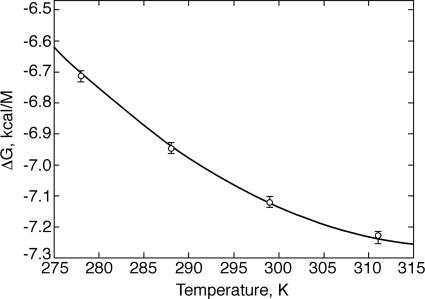
Interactions between the TCRCMV and its specific ligand, pp65–HLA-A*0201, were studied by the SPR method over the 4–37°C temperature range (Fig. 1). The rate constants were calculated by using a two-species model accounting for known slight analyte heterogeneity (18). The association and dissociation rate constants of the major fraction (kon1 and koff2) as well as the equilibrium dissociation constants (Kd) are listed in Table 1. Both rate constants increase with the rise in temperature. Hence, the equilibrium dissociation constants exhibited only very modest temperature dependence (1.6-fold over the above range). Temperature dependence of the reaction free energy [ΔG = RTln(Kd)] is shown in Fig. 2. A nonlinear fit to these data by the van't Hoff equation yielded the following parameters: ΔH = −(2.97 ± 0.5) kcal·mol−1, TΔS = (4.14 ± 0.7) kcal·mol−1, and ΔCp = −(0.19 ± 0.3) kcal·mol−1·K−1. Thus, this TCR–ligand complex formation is favored by both enthalpy and entropy. A similarly driven TCR–ligand complex formation has recently been reported for the LC13–FLR-HLA-B8 couple (19). These results contrast with the unfavorable entropic contribution reported for the formation of several other TCR–pMHC pairs (15, 20, 21) and suggest that the favorable entropy of the TCRCMV–pp65-HLA-A*0201 binding may reflect coordinated conformational changes in the course of the complex formation that, e.g., induce release of bound water molecules to bulk solvent. These results illustrate that the thermodynamic basis of these interactions varies considerably for different TCR-ligand couples. Furthermore, the negative value of the heat capacity could reflect the reduction in the reactants' exposed surface area upon complex formation.
Fig. 1.
Association and dissociation time courses of the TCRCMV–pp65–HLA-A0201 interactions measured by SPR at 4°C (A), 14°C (B), 25°C (C), and 37°C (D). Biotinylated pp65–HLA-A0201 molecules were immobilized on the surface of a streptavidin-coupled CM5 sensor chip, and increasing concentrations (0.17, 0.33, 0.67, 1.3, 2.5, and 5 μM) of TCRCMV were injected at a 20 μl/min flow rate. RU, resonance units.
Table 1.
Rate constants of the TCRCMV and pp65–HLA-A*0201 binding reaction evaluated from results of the SPR measurements
| Temp, °C | kon1, M−1·s−1 | koff2, s−1 | Kd, μM | Fraction, % |
|---|---|---|---|---|
| 4 | (1.28 ± 1.0)·104 | 0.068 ± 0.007 | 5.3 ± 1 | 96 ± 1 |
| 14 | (3.20 ± 0.4)·104 | 0.17 ± 0.02 | 5.3 ± 1 | 98 ± 1 |
| 25 | (7.00 ± 1.0)·104 | 0.44 ± 0.04 | 6.3 ± 1 | 98 ± 1 |
| 37 | (9.60 ± 1.0)·104 | 0.80 ± 0.1 | 8.3 ± 1 | 95 ± 2 |
The equilibrium dissociation constants Kd were calculated as koff2/kon1.
Fig. 2.
Thermodynamic analysis of the TCRCMV–pp65–HLA-A*0201 interactions derived by SPR measurements. Values of ΔH, TΔS, and ΔCp were calculated by nonlinear fitting of the Gibbs free-energy temperature dependence, ΔG(T) = RTln[Kd(T)], by using the nonlinear form of the van't Hoff equation (Eq. 8). Kd values were calculated as the ratio of the dissociation (koff1) and association (kon1) constants determined by analysis of the SPR data (Table 1).
Equilibrium and Stopped-Flow Measurements Using FRET.
To resolve reaction steps faster than those accessible to the SPR method (limited to longer-than-seconds time domain), we used the stopped-flow method. Further, the TCR–pMHC association was monitored by FRET. To this end, TCRCMV was derivatized at its C188 with tetramethylrhodamine (TMR) (acceptor), and its specific ligand, pp65-HLA-A*0201, was conjugated with fluorescein (donor) at C88 of the β2-microglobulin (β2m). To ascertain that the donor's emission is dynamically quenched upon TCR–ligand association by the FRET process, the lifetime of a 0.1 μM solution of the labeled ligand emission was measured in the presence or absence of the TMR–TCR (16 μM final concentration). A decrease in the donor's lifetime from 4.1 ns (τD) to 3.6 ns (τDA) in the presence of the acceptor established the operation of the FRET quenching mechanism. FRET efficiency was calculated by using the above lifetimes: E = 1 − τDA/τD = 0.12, taking a Förster radius R0 = 55 Å for the fluorescein–TMR pair (22), the donor–acceptor separation distance r = R0(1/E − 1)1/6 can be calculated to be 77 Å. This value agrees with the 75–80 Å estimated distance between β2m C88 and TCR C188 (Jean-Baptiste Reiser, personal communication).
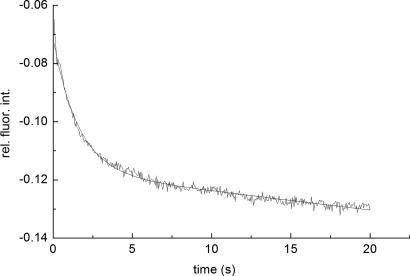
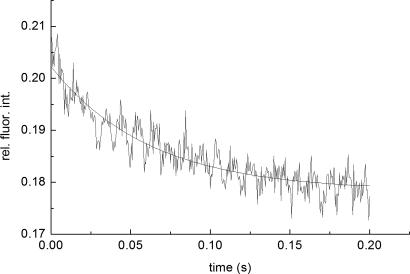
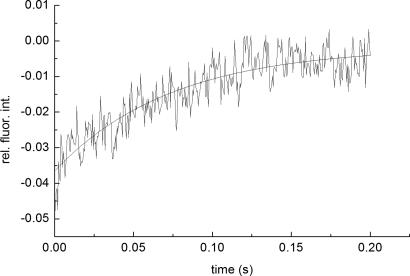
Kinetic measurements were carried under pseudo-first-order conditions, i.e., with an excess of TMR–TCR concentration, by the stopped-flow technique with fluorescence detection. Fluorescein steady-state emission was excited at 465 nm and monitored at 495 nm, where intensity changes caused by FRET were detected. Typical stopped-flow time courses, recorded with low and high temporal resolution, are shown in Figs. 3 and 4, respectively. A full time course of the reaction is seen in the former, whereas the fast phase is better resolved in the latter trace (Fig. 4).
Fig. 3.
A typical stopped-flow time course of the TMR–TCRCMV association with fluorescein pp65–HLA-A0201. The process was monitored at λex/em = 465/>495 nm, in PBS (pH 7.5) at 25°C. Final concentrations (after mixing) of fluorescein–pp65–HLA-A0201 and TMR–TCRCMV were 0.2 and 5.6 μM, respectively. The second step apparent rate constant, k2obs = 0.65 s−1, was calculated by fitting the time course to a biexponential model. The biexponential model was used to account for fluorescein photobleaching, characterized by a rate constant k3obs = 0.038 s−1used throughout the fitting.
Fig. 4.
Typical stopped-flow association time course of the fast reaction phase. Concentrations were 0.2 μM (after mixing) fluorescein–pp65–HLA-A0201 and 1.4 μM TMR–TCRCMV, with an observed rate constant of ≈15 s−1, λex/em = 465/>495 nm.
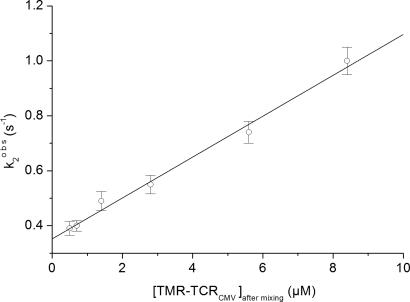
Amplitudes of the stopped-flow time courses were relatively small, even at high TMR–TCR concentrations (≈1%). This finding could be due to the presence of a background fluorescence overlapping with the fluorescein emission. The relatively low FRET efficiency and lower photomultiplier sensitivity in the red spectral region cause this sensitized signal to be considerably smaller than that of the fluorescein emission. The traces shown in Figs. 3, 4, and 5 were taken under different experimental conditions because the measurements of TMR-sensitized emission (Fig. 5) required both higher intensity of the excitation and sensitivity of the detection system. Hence, the impact of the TMR fluorescence on that of the fluorescein illustrated in Figs. 3 and 4 was negligible. The time courses monitored with lower temporal resolution (Fig. 3) clearly resolve two distinct processes characterized by the rate constants τ1 = 1/k1obs and τ2 = 1/k2obs. In addition, we found that the slow phase was affected by photobleaching of the fluorescein, caused by relatively long exposures of the experimental samples to the excitation light. Hence, a three-exponential model (Eq. 9) was used to analyze the data. To increase the accuracy in the second step rate constant evaluation, the initial phase rate constant was predetermined by evaluation of the higher resolution traces. k1obs was found to be 15–20 s−1 for all of the used TCR concentrations, i.e., concentration independent (Fig. 4). The rate constant of the third exponential component was determined in independent experiments by monitoring decay in fluorescein emission intensity at the same level of the excitation light without the presence of the TMR–TCR ligand (k3 = 0.038 s−1). Then, the second phase observable rate constants were determined by evaluating the time courses according to the three-exponential model with fixed k1obs and k3obs rate constants. The second phase rate constant, k2obs, was found to exhibit a linear dependence on TCR concentration (Fig. 6).
Fig. 5.
Typical stopped-flow association time course of the fast phase. Concentrations were 0.2 μM (after mixing) fluorescein–pp65–HLA-A0201 and 8.4 μM TMR–TCRCMV, with an observed rate constant of ≈13 s−1, λex/em = 490/>570 nm (predominantly TMR fluorescence).
Fig. 6.
Concentration dependence of the observed rate constant (k2obs) for the fluorescence signal from 0.2 μM (after mixing) fluorescein–pp65–HLA-A0201 and 1–8.4 μM TMR–TCRCMV under pseudo first-order conditions for the slow binding step. Experimental conditions are specified in the legend of Fig. 3. The value of k32 is obtained from the intercept, and the value of k23 is obtained from the slope of the linear concentration dependence.
The multiple phases of the observed stopped-flow time courses led us to consider operation of a mechanism more complex than the previously reported bimolecular association process. Having in mind the conformational change in the TCR-binding site reported by the structural studies, we analyzed our data assuming a minimal two-step mechanism. This analysis involves the initial formation of a transient complex (tr) followed by a structural adjustment, i.e., an induced fit that yields the final, usually more stable complex (st):
 |
We assign the rate constants evaluated from analysis of the stopped-flow time courses 1/τ1 = k1obs and 1/τ2 = k2obs to the first and second steps, respectively. Because the measurements were carried out under pseudo-first-order conditions ([TCR] ≫ [pMHC]), the following equations can be written:
where:
Eqs. 2 and 3 show that under certain experimental conditions, both k1obs and k2obs may exhibit linear concentration dependencies. However, concentration dependence was observed only for k2obs (Fig. 6) and not for k1obs. Because k1obs is equal to k12·[TCR] + k21, we conclude that k12·[TCR] is significantly smaller than k21 at the employed TCR concentrations.
The following kinetic parameters were calculated from the slope and intercept of the k2obs concentration dependence (Eq. 3), respectively: K12k23 = 7.5 × 10⁴ M−1·s−1 and k32 = 0.35 s−1.
It is noteworthy that the second step dissociation rate constant, k32, derived from the stopped-flow data is close to that derived from the SPR measurements (k2off = 0.44 s−1) (Table 1). Similarly, the overall equilibrium dissociation constant of this second reaction step, Kd = k32/(K12k23) = 5 μM, is close to that calculated from the SPR data (6.3 μM).
Because no saturation was observed in the concentration dependence of k2obs (Fig. 6), we assume that k23 ≥ 2 s−1. Accordingly, K12 would then be 3.75·104 M. Using this value and being able to neglect the concentration of unbound fluorescein-pMHC, we obtain for k1obs = k12([TCR] + 1/K12) = 20 s−1. This yields k12 ≈ 106 M−1·s−1 and k21 ≈ 18 s−1. Comparing the values of k12 [TCR] and k21, we can see that under these experimental conditions, k1obs is indeed concentration independent, because this step is dominated by the relatively fast dissociation rate constant of the transient complex k21 and not by k12[TCR].
Having calculated all rate constants of this two-step reaction mechanism, we can relate to the significance of the second step. Thus, the gain in the overall equilibrium association constant due to operation of the second step is determined by K23 = k23/k32 = 5.7. Hence, the final complex attains approximately a 6-fold stabilization. Alternatively, the rate constants of this two-step mechanism can be calculated by fitting the stopped-flow time courses by using the following kinetic equations:
and
where y1 is concentration of free pMHC molecules, and y2 and y3 are concentrations of the transient (TCR···pMHC)tr and the stabilized (TCR·pMHC)st complexes, respectively. An ≈9-fold stabilization was evaluated by numerically solving of the model's kinetic equations [supporting information (SI)].
Discussion
The paradox characterizing the TCR's interaction with its ligands has been recognized for a long time: Exquisite specificity is accompanied by marked cross-reactivity and relatively limited affinity. This paradox called for a detailed resolution of its reaction mechanism. So far, structural studies have consistently resolved conformational changes induced in the TCR binding site upon interaction with its ligand. This, however, was the only direct evidence for the operation of such an “induced-fit” mechanism. The purpose of this study was to kinetically resolve elementary steps of this reaction.
Results of the current SPR measurements and of our earlier studies (18) show that, as in all other investigations of TCR–pMHC interactions by this method, the TCRCMV–pp65-HLA-A*0201 association rate constants are slower than those expected for diffusion-controlled reactions in solution, i.e., these do not reflect the actual elementary steps of the process. This finding is not surprising in view of the limited time resolution of the method. Indeed, the now observed biphasic association time courses resolved in the millisecond time domain provide kinetic evidence for the operation of a more complex mechanism. The above analysis of the kinetic data implies that the rate constant of the initial step (k12 ≈ 3·105 to 106 M−1·s−1) is close to the diffusion-controlled limit for the association of two macromolecules in solution. The rate constants k12 and k21 of the intermediate complex formation are likely to be similar for interactions of different TCR–pMHC partners. Stability of this initial transient complex is relatively limited, because it dissociates at a rate of ≈18–30 s−1. The rate constant of the next reaction step (Eq. 1), which we assign to an induced conformational transition in the initial TCR–ligand complex, is relatively slow (k23 = 2–4 s−1). The second step rate constants (k23 and k32) determine the final complex stability and, hence, its yield. Furthermore, because of the fast off-rate constant of the first step (k21) and the relatively slow on-rate constant of the second step (k23), the reaction yield of the final complex at low reactant concentrations is limited. In addition, a marked increase in the final yield of the complex may be obtained when the process takes place on the respective cells' surfaces because of the involvement of the CD8 coreceptor: The CD8–pMHC complex has been reported to be formed at a diffusion-controlled rate yet also dissociates at a fast rate (23). Proximal CD8 and TCR can both interact with their shared pMHC ligand (24, 25). The CD8 binding, operating in the two dimensions of the cells' surfaces, may significantly stabilize the TCR·pMHC transient complex, thereby increasing the overall complex formation yield. Thus, the slower k23 is, the higher will be the impact of the CD8 cooperation.
For a considerable number of TCR–ligand couples, the lifetime of the TCR–ligand complex, as determined by solution measurements using BIAcore chips (BIAcore, St. Albans, U.K.), has been found to correlate with both specificity and the functional responses. Still, results of this study are of considerable importance because they clearly show the difficulty in using data obtained by Biacore measurements for deducing values of kinetic parameters.
In conclusion, the kinetic evidence presented here for a structural transition induced upon TCR–pMHC interaction reflects the operation of an induced-fit mechanism. One can therefore suggest that the rate constants of the second step determine the final result of antigen recognition. Thus, it would be very interesting to investigate the kinetics of TCR interaction with different agonistic and antagonistic ligands and determine their elementary steps' rate constants. These may provide a more quantitative understanding of the mechanism of initial T cells' activation steps.
Materials and Methods
All chemicals were purchased from Sigma (Rehovot, Israel) unless otherwise stated. Fluorescein-5-maleimide and tetramethylrhodamine-5-maleimide (TMR-5-maleimide) were purchased from Molecular Probes (Eugene, OR). Research-grade CM-5 chips were purchased from Daniel Biotech (Rehovot, Israel).
Protein Preparation, Refolding, and Purification.
Production of the soluble recombinant β2m S88C mutant was described elsewhere (26). Soluble HLA-A*0201 biotinylated at the COOH terminal in complex with pp65, a peptide derived from human CMV (residues 495–503, sequence NLVPMVATV) and H-2Kb bound with peptide derived from ovalbumin (residues 257–264, sequence SIINFEKL) were refolded and purified by Beckman Coulter (Marseille, France). TCRCMV α- (AV18S1) and β- (BV13S1) chain-encoding sequences were derived from a public clonotype that predominates within NLVPMVATV-specific T cells (27). These TCR sequences were inserted in pLM1 and pET22b plasmids, respectively. The plasmids were transformed separately into Escherichia coli strain BL21pLysS, and single colonies were grown at 37°C in medium (ampicillin 100 mg/ml) to an OD600 of 0.5 before protein expression was induced with 0.5 mM isopropyl β-d-thiogalactoside (IPTG). Cells were harvested 3 h after induction by centrifugation for 30 min at 2,500 × g. Cell pellets were resuspended in a buffer containing 50 mM Tris·HCl, 25% (wt/vol) sucrose, 1 mM EDTA, 0.1% (wt/vol) sodium azide, and 10 mM DTT (pH 8.0). After an overnight freeze–thaw step, resuspended cells were sonicated in 1-min bursts for a total of ≈10 min in a Milsonix XL2020 sonicator (Farmingdale, NY) by using a standard 12-mm diameter probe. Inclusion body pellets were recovered by centrifugation for 30 min at ≈30,000 × g. Three detergent washes were then carried out to remove cell debris and membrane components. Each time, the inclusion body pellet was homogenized in a Triton buffer [≈50 mM Tris·HCl/0.5% Triton X-100/200 mM NaCl/10 mM EDTA/0.1% (wt/vol) sodium azide/2 mM DTT, pH 8.0] before being sedimented by centrifugation for 15 min at ≈30,000 × g. Detergent and salt were then removed by a similar wash in the following buffer: 50 mM Tris·HCl/1 mM EDTA/0.1% (wt/vol) sodium azide/2 mM DTT (pH 8.0). Finally, the inclusion bodies were solubilized in denaturant for 3–4 h at 4°C. The α-chain pellet was dissolved in 50 mM Mes/8 M urea/10 mM EDTA/2 mM DTT (pH 6.5). The β-chain pellet was dissolved in guanidine solution containing 50 mM Mes, 6 M guanidine, 10 mM EDTA, and 2 mM DTT (pH 6.5). Insoluble material was then pelleted by centrifugation for 30 min at ≈20,000 × g, and the supernatant was divided into 1-ml aliquots and frozen at −90°C.
Approximately 30 mg of each solubilized inclusion body chain was thawed from frozen stocks and ≈4 mM DTT was added to ensure complete reduction of cysteine residues. Samples were then mixed, and the mixture was diluted into 15 ml of a guanidine solution (6 M guanidine hydrochloride/10 mM sodium acetate/10 mM EDTA, pH 5.5) to ensure complete chain denaturation. The guanidine solution containing fully reduced and denatured TCR α- and β-chains was then injected into 1 liter of the following refolding buffer: 100 mM Tris (pH 8.5)/400 mM l-arginine/2 mM EDTA/5 mM reduced glutathione/0.5 mM oxidized glutathione/5 M urea/0.2 mM PMSF. The solution was left for 72 h at 4°C. The refolded protein was then dialyzed first against 10 liters of 100 mM urea, then against 10 liters of 10 mM Tris (pH 8.0). The refolding solution was concentrated to 10 ml by Amicon concentrator (Amicon, Beverly, MA). The refolded protein was purified by a Superdex 200 gel filtration column (Amersham Pharmacia, Uppsala, Sweden). The heterodimer was eluted as a single peak, and peak fractions were pooled and concentrated to 3 mg/ml. The yield of the receptor was ≈15%.
Labeling of Proteins by Fluorescence Probes.
The ligand, pp65–HLA-A*0201 complex and TCRCMV were labeled by a fluorescence donor (fluorescein) and acceptor (TMR), respectively. For that purpose, a mutant S88C of human β2m was incubated with 20 mM DTT for 20 min at 25°C to ensure complete reduction of the C88 thiolate. Before the reaction with the fluorophore, S88C β2m was separated from DTT by gel filtration on a DG10 column in PBS (Bio-Rad, Hercules, CA). Fluorescin-5-maleimide was dissolved in DMSO at a concentration of 200 mM. Twenty-five-fold excess of fluorescin-5-maleimide (5.5 mg) was incubated with 6 mg of the protein (2 mg/ml) for 2 h at room temperature under gentle stirring in the dark. After completion of the reaction, the unbound dye was removed by gel filtration on a DG10 column in PBS and then by gel filtration on a Superdex 75 column in PBS. The β2m chain of pp65–HLA-A*0201 complex was exchanged with fluorescein-β2m by overnight incubation with a 20-fold excess of the labeled β2m at 37°C. A similar protocol was used for specific labeling of the C188 of TCRCMV with TMR-5-maleimide. The labeled TCRCMV was separated from the free dye by gel filtration on a Superdex 75 column in PBS. The dye-to-probe molar ratio was calculated as 0.92 for β2m-fluorescein and 0.97 for TCRCMV-TMR.
SPR Measurements.
All protein samples were centrifuged at 20,000 × g for 30 min before the SPR measurements, which were performed by using a BIAcore 2000 (BIAcore). CM-5 chips were coated with streptavidin via primary amines by using the standard amino-coupling kit (BIAcore). For coupling, 1 mg/ml streptavidin (Sigma) solution in 10 mM sodium acetate (pH 5.5) was injected at a flow rate of 0.1 μl/min for 30 min. Streptavidin coupling levels ranged from 7,000 to 10,000 resonance units (RU). The cognate pMHC complexes (pp65–HLA-A*0201) and the negative control, noncognate (negative control; ovalbumin-H-2Kb) ones were purified by size-exclusion on a Superdex 75 column and immobilized on the streptavidin-derivatized chip at 300–1,200 RU or 600 RU levels, respectively. The time courses recorded for the negative controls were subtracted from those recorded for the cognate interaction with the receptor. TCR concentrations of 0.17, 0.33, 0.67, 1.3, 2.5, and 5 μM were injected at a flow rate of 20 μl/min over surfaces on which pMHC complexes were immobilized. No mass transfer was observed under these experimental conditions. To fit the binding and dissociation time courses observed in the SPR experiments, we used a two-species model accounting for known slight analyte heterogeneity [major fraction TCR1 and minor (2–5%) of a high-affinity fraction TCR2] (18). Fitting of the data was carried out by using the nonlinear least-squares optimization program GLSA (Alango, Haifa, Israel).
Thermodynamic Analysis of the Equilibrium Binding Data.
The thermodynamic parameters were calculated from the temperature dependence (4–37°C) of the reaction free energy ΔG = RTln(Kd) (Fig. 2). The equilibrium binding constant was calculated as Kd = koff/kon. The association and dissociation rate constants were calculated by global fitting of the SPR binding and dissociation time courses. ΔH, ΔS, and ΔCp parameters were calculated from nonlinear fitting of ΔG(T) function by the nonlinear form of the van't Hoff equation:
 |
where ΔG is the Gibbs free energy expressed as a function of the enthalpy ΔH, entropy ΔS, and heat capacity ΔCp parameters, R is the gas constant 1.987 cal·mol−1 K−1 and T is temperature in K. T0 was taken as 298 K.
Stopped-Flow Measurements.
Time course measurements of fluorescein-labeled pp65–HLA-A*0201 (fluorescein–pMHC) association with the TMR-labeled TCRCMV (TMR–TCRCMV) were carried out under pseudo-first-order conditions by using a computer-controlled SMX-18 stopped-flow instrument (Applied Photophysics, Leatherhead, U.K.). As a light source, a 200-W mercury/xenon lamp (Hamamatsu, Herrsching, Germany) connected to a Kratos GM 252 monochromator (Polytec, Waldbronn, Germany) was used. Fluorescence was detected by a red-sensitive photomultiplier (R1104; Hamamatsu).
Typical concentrations after mixing were 0.2 μM fluorescein–pp65–HLA-A*0201 and 1–8.4 μM TMR–TCRCMV in PBS (pH 7.5) at 25°C. Quenching of the donor fluorescence was monitored with 465 nm excitation by using a >495-nm cut-off filter in the emission path. The sensitized TMR emission was monitored at 490 nm excitation and a >570-nm emission cut-off filter.
The kinetic data were evaluated by using the software supplied by Applied Photophysics (Levenberg–Marquart algorithm). Stopped-flow time courses were fitted by one- (m = 1) or three-exponential models (m = 3):
 |
where ai are preexponential coefficients and kiobs are corresponding observable rate constants.
Supplementary Material
Acknowledgments
These studies were supported by grants from the European Community (Project EPI-PEP-VAC QLK2-2002-00620).
Abbreviations
- SPR
surface plasmon resonance
- pMHC
peptide–MHC complex
- TCR
T cell receptor
- CDR
complementarity determining region
- TMR
tetramethylrhodamine
- β2m
β2-microglobulin
- TCRCMV
TCR specific for cytomegalovirus peptide.
Footnotes
The authors declare no conflict of interest.
See Commentary on page 16398.
This article contains supporting information online at www.pnas.org/cgi/content/full/0707061104/DC1.
References
- 1.Davis MM, Boniface JJ, Reich Z, Lyons D, Hampl J, Arden B, Chien Y. Annu Rev Immunol. 1998;16:523–544. doi: 10.1146/annurev.immunol.16.1.523. [DOI] [PubMed] [Google Scholar]
- 2.Germain RN, Stefanova I. Annu Rev Immunol. 1999;17:467–522. doi: 10.1146/annurev.immunol.17.1.467. [DOI] [PubMed] [Google Scholar]
- 3.van der Merwe PA, Davis SJ. Annu Rev Immunol. 2003;21:659–684. doi: 10.1146/annurev.immunol.21.120601.141036. [DOI] [PubMed] [Google Scholar]
- 4.Alam SM, Davies GM, Lin CM, Zal T, Nasholds W, Jameson SC, Hogquist KA, Gascoigne NR, Travers PJ. Immunity. 1999;10:227–237. doi: 10.1016/s1074-7613(00)80023-0. [DOI] [PubMed] [Google Scholar]
- 5.Baker BM, Gagnon SJ, Biddison WE, Wiley DC. Immunity. 2000;13:475–484. doi: 10.1016/s1074-7613(00)00047-9. [DOI] [PubMed] [Google Scholar]
- 6.Rudolph MG, Wilson IA. Curr Opin Immunol. 2002;14:52–65. doi: 10.1016/s0952-7915(01)00298-9. [DOI] [PubMed] [Google Scholar]
- 7.Kageyama S, Tsomides TJ, Sykulev Y, Eisen HN. J Immunol. 1995;154:567–576. [PubMed] [Google Scholar]
- 8.Lee JK, Stewart-Jones G, Dong T, Harlos K, Di Gleria K, Dorrell L, Douek DC, van der Merwe PA, Jones EY, McMichael AJ. J Exp Med. 2004;200:1455–1466. doi: 10.1084/jem.20041251. [DOI] [PMC free article] [PubMed] [Google Scholar]
- 9.Martinez-Hackert E, Anikeeva N, Kalams SA, Walker BD, Hendrickson WA, Sykulev Y. J Biol Chem. 2006;281:20205–20212. doi: 10.1074/jbc.M601934200. [DOI] [PubMed] [Google Scholar]
- 10.Reiser JB, Darnault C, Gregoire C, Mosser T, Mazza G, Kearney A, van der Merwe PA, Fontecilla-Camps JC, Housset D, Malissen B. Nat Immunol. 2003;4:241–247. doi: 10.1038/ni891. [DOI] [PubMed] [Google Scholar]
- 11.Rudolph MG, Stanfield RL, Wilson IA. Annu Rev Immunol. 2006;24:419–466. doi: 10.1146/annurev.immunol.23.021704.115658. [DOI] [PubMed] [Google Scholar]
- 12.Garcia KC, Teyton L, Wilson IA. Annu Rev Immunol. 1999;17:369–397. doi: 10.1146/annurev.immunol.17.1.369. [DOI] [PubMed] [Google Scholar]
- 13.Reiser JB, Gregoire C, Darnault C, Mosser T, Guimezanes A, Schmitt-Verhulst AM, Fontecilla-Camps JC, Mazza G, Malissen B, Housset D. Immunity. 2002;16:345–354. doi: 10.1016/s1074-7613(02)00288-1. [DOI] [PubMed] [Google Scholar]
- 14.Garcia KC, Degano M, Pease LR, Huang M, Peterson PA, Teyton L, Wilson IA. Science. 1998;279:1166–1172. doi: 10.1126/science.279.5354.1166. [DOI] [PubMed] [Google Scholar]
- 15.Willcox BE, Gao GF, Wyer JR, Ladbury JE, Bell JI, Jakobsen BK, van der Merwe PA. Immunity. 1999;10:357–365. doi: 10.1016/s1074-7613(00)80035-7. [DOI] [PubMed] [Google Scholar]
- 16.Wu LC, Tuot DS, Lyons DS, Garcia KC, Davis MM. Nature. 2002;418:552–556. doi: 10.1038/nature00920. [DOI] [PubMed] [Google Scholar]
- 17.Borg NA, Ely LK, Beddoe T, Macdonald WA, Reid HH, Clements CS, Purcell AW, Kjer-Nielsen L, Miles JJ, Burrows SR, et al. Nat Immunol. 2005;6:171–180. doi: 10.1038/ni1155. [DOI] [PubMed] [Google Scholar]
- 18.Gakamsky DM, Luescher IF, Pecht I. Proc Natl Acad Sci USA. 2004;101:9063–9066. doi: 10.1073/pnas.0402840101. [DOI] [PMC free article] [PubMed] [Google Scholar]
- 19.Ely LK, Beddoe T, Clements CS, Matthews JM, Purcell AW, Kjer-Nielsen L, McCluskey J, Rossjohn J. Proc Natl Acad Sci USA. 2006;103:6641–6646. doi: 10.1073/pnas.0600743103. [DOI] [PMC free article] [PubMed] [Google Scholar]
- 20.Boniface JJ, Reich Z, Lyons DS, Davis MM. Proc Natl Acad Sci USA. 1999;96:11446–11451. doi: 10.1073/pnas.96.20.11446. [DOI] [PMC free article] [PubMed] [Google Scholar]
- 21.Krogsgaard M, Prado N, Adams EJ, He XL, Chow DC, Wilson DB, Garcia KC, Davis MM. Mol Cell. 2003;12:1367–1378. doi: 10.1016/s1097-2765(03)00474-x. [DOI] [PubMed] [Google Scholar]
- 22.Haugland RP. The Handbook: A Guide to Fluorescent Probes and Labeling Technologies. 9th Ed. Carlsbad, CA: Invitrogen/Molecular Probes; 2002. pp. 48–58. [Google Scholar]
- 23.Gao GF, Rao Z, Bell JI. Trends Immunol. 2002;23:408–413. doi: 10.1016/s1471-4906(02)02282-2. [DOI] [PubMed] [Google Scholar]
- 24.Gakamsky DM, Luescher IF, Pramanik A, Kopito RB, Lemonnier F, Vogel H, Rigler R, Pecht I. Biophys J. 2005;89:2121–2133. doi: 10.1529/biophysj.105.061671. [DOI] [PMC free article] [PubMed] [Google Scholar]
- 25.Pecht I, Gakamsky DM. FEBS Lett. 2005;579:3336–3341. doi: 10.1016/j.febslet.2005.04.025. [DOI] [PubMed] [Google Scholar]
- 26.Davis DM, Reyburn HT, Pazmany L, Chiu I, Mandelboim O, Strominger JL. Eur J Immunol. 1997;27:2714–2719. doi: 10.1002/eji.1830271035. [DOI] [PubMed] [Google Scholar]
- 27.Trautmann L, Rimbert M, Echasserieau K, Saulquin X, Neveu B, Dechanet J, Cerundolo V, Bonneville M. J Immunol. 2005;175:6123–6132. doi: 10.4049/jimmunol.175.9.6123. [DOI] [PubMed] [Google Scholar]
Associated Data
This section collects any data citations, data availability statements, or supplementary materials included in this article.


