

Abstract
The past 15 years have witnessed a number of molecular studies that aimed to resolve issues of species delineation and phylogeny of mites in the family Tetranychidae. The central part of the mitochondrial COI region has frequently been used for investigating intra- and interspecific variation. All these studies combined yield an extensive database of sequence information of the family Tetranychidae. We assembled this information in a single alignment and performed an overall phylogenetic analysis. The resulting phylogeny shows that important patterns have been overlooked in previous studies, whereas others disappear. It also reveals that mistakes were made in submitting the data to GenBank, which further disturbed interpretation of the data. Our total analysis clearly shows three clades that most likely correspond to the species T. urticae, T. kanzawai and T. truncatus. Intraspecific variation is very high, possibly due to selective sweeps caused by reproductive parasites. We found no evidence for host plant associations and phylogeographic patterns in T. urticae are absent. Finally we evaluate the application of DNA barcoding.
Keywords: Tetranychidae, Tetranychus urticae, COI, Barcoding, Reproductive parasites, Spider mites
Introduction
Species identification is the basis for understanding species diversity, phylogenetic patterns, and evolutionary processes. Only correct identifications allow for comparisons between studies and the repetition or expansion of earlier experiments. In pest species, species identification is also important in the development of (biological) pest control strategies.
Identification and delineation of species within the Tetranychidae has been an issue of debate for the past few decades. Within the family about 1200 different species are described, many of which are of agronomical importance (Bolland et al. 1998). The genus Tetranychus is well studied and includes two common major agricultural pest species with a worldwide distribution: Tetranychus urticae Koch, 1836 and Tetranychus kanzawai Kishida, 1927. Morphological identification of tetranychid species is difficult. The number of potential diagnostic characters is limited (partly due to the small size of the mites) and key traits often exhibit large phenotypic plasticity. As a result, many species cannot be distinguished on the basis of external morphology. For example, in Japan 10 Tetranychus species are recognized (Ehara 1999). However, morphological identification using adult females is possible for only two of the species. The remaining eight species can only be identified by microscopic examination of the shape of the aedeagus (part of the male genitalia). Another example that shows our inability to identify species on the basis of morphology is the well-studied two-spotted spider mite species T. urticae. This species is considered a species complex (Navajas et al. 1998) and as many as 44 synonymous names are known (Bolland et al. 1998). The question whether red T. urticae mites should be considered a separate species (T. cinnabarinus) has occupied taxonomists for many years (Dupont 1979; Gotoh and Tokioka 1996; Zhang and Jacobson 2000). The fact that there are only few taxonomists specialized in morphological identification of mites and that their number is decreasing adds to the problem of spider mite identification.
DNA sequences are currently an indispensable tool for delineating and identifying species. In this context it is important to distinguish between DNA taxonomy and DNA barcoding. DNA taxonomy concerns the circumscription and delineation of species using evolutionary species concepts (Vogler and Monaghan 2007). DNA barcoding aims at the identification of pre-defined species and does not address the issue of species delineation per se (Monaghan et al. 2005). In DNA barcoding a short standardized DNA sequence, usually the 5′ end part of the mitochondrial cytochrome c oxidase subunit I (COI) gene, is used to identify species. DNA barcoding can be used to (i) identify and assign unknown specimens to species that have been previously described and (ii) enhance the discovery of new species using a threshold of sequence divergence (Hebert et al. 2003; Moritz and Cicero 2004). DNA taxonomy may be based on one or several mitochondrial as well as nuclear DNA regions and can serve as a database for DNA barcoding. DNA taxonomy is an offshoot of phylogenetics, in which the evolutionary relationships between taxa (e.g., species) are investigated. Throughout this paper we use the term ‘species delineation’ when it concerns DNA taxonomy and ‘species identification’ when it concerns DNA barcoding.
The usefulness of the COI region for delineating tetranychid species has been investigated in several studies (Hinomoto et al. 2001; Hinomoto and Takafuji 2001; Lee et al. 1999; Navajas et al. 1994, 1996a, 1996b, 1998; Toda et al. 2000; Xie et al. 2006a). Recently, a DNA barcoding approach was used to identify tetranychid species (Hinomoto et al. 2007). Each of these studies used a different or sometimes partially overlapping subset of tetranychid sequences. Many studies extended their dataset with one or several tetranychid sequences from the GenBank database, serving as a reference for phylogeny reconstruction or species identification. However, sequence diversity within T. urticae is substantial (e.g., Navajas et al. 1998) so that different T. urticae sequences are available from GenBank, some of which bear an incorrect species name (due to misidentification). As a consequence, different T. urticae reference sequences were used in above-mentioned studies, leading to the emergence of variable taxonomic groupings and phylogenetic patterns. This, combined with the analyses of restricted subsets in each study, gives an incomplete and fragmented view of species delineations and phylogenetic relationships within the family Tetranychidae.
In this study we create an extensive COI dataset of the family Tetranychidae, with a wide coverage of the species T. kanzawai and T. urticae (including T. cinnabarinus, which is currently considered synonymous to T. urticae). We have collected all currently available mitochondrial COI sequences from GenBank and added data on mites collected from Europe and North America. We critically evaluate the assembled data and perform an overall phylogenetic analysis. This approach reveals novel patterns on species delineation and phylogenetic relationships. We discuss the use of COI for DNA barcoding purposes by considering the intra- and interspecific variation. In addition, we discuss the observed variation in COI in relation to associated host plant, phylogeographic patterns and the presence of endosymbionts (e.g., Wolbachia, Cardinium). Finally, we provide guidelines for future phylogenetic studies on (tetranychid) mites.
Material and methods
Additional tetranychid samples
Tetranychid mites were collected in Europe (six locations), in North America (one location), and from two cultures maintained in our lab for 10 years (Table 1). Mites were not identified morphologically to the species level. DNA was extracted from single individuals using a modified CTAB extraction method (Doyle 1991). A single adult female was ground in 5 μl of proteinase K (20 mg/ml) and 100 μl CTAB (2% CTAB w/v in 100 mM Tris-HCl [pH8], 20 mM EDTA, and 1.42 M NaCl) buffer was added. After vortexing, samples were incubated at 55°C for 1 h. Next, 100 μl chloroform: isoamylalcohol (24:1) was added and contents were gently mixed for 2 min. Tubes were centrifuged for 10 min. at 15,800 g. After centrifugation, 80 μl of the supernatant was transferred to a clean tube and DNA was precipitated by adding 200 μl ice-cold 96% ethanol. Tubes were incubated at −20°C for at least 1 h prior to centrifugation at 15,800 g for 15 min at 4°C. The supernatant was removed and the DNA pellet was washed with 70% ethanol. Next, the DNA was air dried for at least 15 min, eluted in 30 μl sterile water, and stored at −20°C.
Table 1.
Overview of samples sequenced in this study and the primer sequences used for COI amplification
| Strain | Country | Locality | Host plant | Collection date | Primerb | ||
|---|---|---|---|---|---|---|---|
| Common name | Scientific name | F | R | ||||
| NL1 | Netherlands | Castricum | European Spindle | Euonymus europaeus | Sep-06 | 1 | 2 |
| NL2 | Netherlands | Castricum | European Honeysuckle | Lonicera periclymenum | Sep-06 | 1 | 2 |
| F1 | France | Vireux | Blackthorn | Prunus spinosa | Jul-06 | 1 | 2 |
| T1 | Unknown | Unknown | Cucumbera | Cucumis sativus | a | 1 | 2 |
| T2 | Netherlands | Aalsmeer (greenhouse) | Rosea | Rosa spec. | a | 1 | 2 |
| US1 | United States | Tucson (AZ) | Unknown | Unknown | May-05 | 3 | 4 |
| P1 | Portugal | Caldas de Monchique | Citrus | Citrus spec. | Feb-05 | 3 | 4 |
| S1 | Spain | Mont-roig del camp | Orange | Citrus spec. | Apr-04 | 3 | 4 |
| PL1 | Poland | Rabkowa | Plumb | Prunus spec. | Aug-05 | 3 | 4 |
aMaintained in the lab on bean (Phaseolus vulgaris) for over 10 years
b1 = GGAGGATTTGGAAATTGATTAGTTCC (Navajas and Boursot 2003); 2 = AAWCCTCTAAAAATRGCRAATACRGC (modified from Hinomoto and Takafuji (2001); 3 = TGATTTTTTGGTCACCCAGAAG (Navajas et al. 1994); 4 = TACAGCTCCTATAGATAAAAC (Navajas et al. 1994)
Part of the mitochondrial COI gene was amplified using various primer combinations (Table 1). Depending on the primer combination, this yielded a fragment size of 410–863 basepairs (bp), excluding the primer annealing sites (Fig. 1). PCR was performed in a 25 μl reaction mix containing 2.5 μl 10X Super Taq buffer (HT BioTechnology, Cambridge, U.K.), 1.25 μl bovine serum albumin (10 mg/ml), 1.25 μl MgCl2 (25 mM), 5 μl dNTP mix (1 mM of each nucleotide), 0.2 μl of each primer (20 μM each), 0.2 μl of super Taq (5 u/ μl) (HT BioTechnology), 11.9 μl water and 2.5 μl of DNA extract. PCR cycling conditions were 4 min. at 94°C, followed by 35 cycles of 1 min at 94°C, 1 min at 48°C and 1 min at 72°C, and a final extension at 72°C for 4 min. Products (2 μl) were visualized on a 1% agarose gel stained with ethidium bromide in 0.5X TBE buffer (45 mM Tris base, 45 mM boric acid, and 1 mM EDTA, pH 8.0).
Fig. 1.
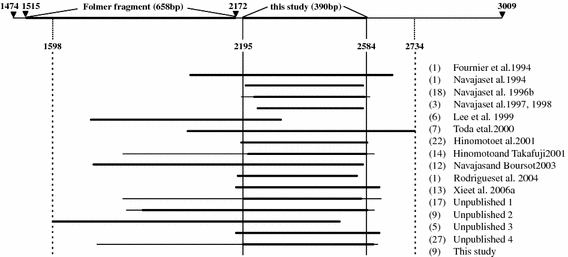
Overview of the COI fragments sequenced in different studies and their relative position after alignment. The position of the fragment analyzed in this study and of the standard DNA barcoding fragment (Folmer fragment) on the total mitochondrial COI gene (position 1474–3009) are indicated on top. Base pair numbers correspond to the Drosophila melanogaster mitochondrial DNA sequence (GenBank accession nr. U37541). For each study, thick horizontal lines represent the fragment sequenced in all specimens and thin lines indicate the maximum sequence length. Number of sequences (between parentheses) and references are listed at the right. For references of unpublished studies, see Appendix
PCR products were purified using a DNA extraction kit (Fermentas, St. Leon-Rot, Germany). The purified products were directly sequenced using the ABI PRISM BigDye Terminator Sequence Kit (Applied Biosystems, Nieuwerkerk a/d IJssel, The Netherlands) according to the manufacturer’s instructions but diluted 16 times. Both strands of the products were sequenced using the same primers as used in the PCR amplification. Sequences were run on an ABI 3700 automated DNA sequencer. Obtained sequences were aligned using ClustalX v 1.8.0 (Thompson et al. 1997) and compared to the sequences obtained from GenBank (see below).
Database compilation
Sequence collection
A single database was constructed comprising all available tetranychid COI sequences from GenBank and the sequences obtained in this study. Sequences were collected from GenBank on September 8th, 2006 (keywords for search were ‘cytochrome oxidase subunit I AND Tetranychidae’). This yielded a total of 165 sequences (156 from GenBank, 9 from this study), of which 79 (48%) were published in peer reviewed journals. An overview of all sequences, their GenBank accession numbers, assigned species names, references, sample locations, and associated host plants (if known) is given in the Appendix. Sequences were aligned using ClustalX. Due to the use of different primer combinations in the various studies, the sequences differed in length and in position on the COI region (Fig. 1). A central part of 390 bp was chosen for subsequent analysis (highlighted region in Fig. 1). Considering this central part, 25 sequences were found more than once (see Appendix). Prior to phylogenetic analysis, identical sequences (except one) were removed from the dataset, resulting in 96 unique sequences. In addition, six sequences with accession numbers AF131105–AF131110 (Lee et al. 1999) were excluded from analysis because of too many missing data in the region of overlap (272 bp of the 390 bp part are missing; Fig. 1). The dataset was further adjusted for wrongly submitted sequences (see next paragraph) leading to the addition of one corrected sequence, yielding a final number of 91 aligned COI sequences. Of these, 71 were published in peer reviewed journals and 68 belong to the genus Tetranychus according to the GenBank submission info. A Clustal alignment of the 91 unique sequences can be obtained from the corresponding author upon request.
Data validation: Incongruencies in the database
When compiling the dataset, two discrepancies were encountered between sequence information submitted to GenBank and the description in the associated articles. The first one concerns accession X80860. Its sequence was wrongly submitted to GenBank. In GenBank, accessions X80859 and X80860 are listed as T. neocaledonicus and T. gloveri respectively. According to the associated article, these sequences should differ 10% (Navajas et al. 1996b). However, accessions X80859 and X80860 show identical sequences, both concurring with the sequence T. neocaledonicus from the article. The correct sequence of T. gloveri was obtained from the original article and added to the dataset. The second discrepancy concerns accessions X99873, X99874 and X99875. According to the description in GenBank, accession X99873 was obtained from the Amphitetranychus quercivorus strain Sapporo and accession X99874 from the A. quercivorus strain Tsukuba. Comparing this to sequences in Navajas et al. (1997), the X99873 GenBank sequence concurs with A. quercivorus strain Tsukuba in the article. GenBank sequence X99874 concurs with the sequence of A. viennensis in the article (and therefore is identical to the GenBank sequence of X99875, previously named T. viennensis). This means that the sequences of accessions X99873 and X99874 are different from the article sequences. We included accessions X99873 as A. quercivorus and X99875 as A. viennensis in the dataset. Accession X99874 was excluded from the dataset.
Phylogenetic analysis
PAUP* version 4.0b10 (Swofford 2002) and DAMBE version 4.1.15 (Xia and Xie 2001) were used to calculate numbers of variable sites, uncorrected pairwise divergences, nucleotide composition, and transition and transversion ratios. PAUP was used to perform a chi-square test of base frequency homogeneity across all taxa.
Phylogenetic analyses were conducted in PAUP using Neighbour-Joining (NJ) algorithms (p-distance) and Maximum Likelihood (ML) algorithms (TBR heuristics, random addition sequence with five replicates, reconnection limit of 10). Both PAUP and Modeltest 3.6 (Posada and Crandall 1998) were used to select the optimal evolution model for the ML analysis. The selected model was further optimized by critically evaluating the selected parameters (Swofford and Sullivan 2003) using the Akaike Information Criterion (AIC; Akaike 1974). Because COI is a protein coding gene, we tested if the likelihood of models with the lowest likelihood score could be further improved by incorporating specific rates for each codon position (Shapiro et al. 2006). Under the selected model, parameters and tree topology were optimized using the successive approximations approach (Sullivan et al. 2005). For the NJ analyses robustness of nodes was assessed with 1,000 NJ-bootstrap replicates. For the ML analyses bootstrap support was assessed by performing a NJ bootstrap (1,000 replicates) with distances calculated according to the selected ML model (because of computational constraints).
Phylogenetic analyses were performed for i) the family Tetranychidae and ii) the genus Tetranychus separately. The analysis of the family Tetranychidae included all species. As the species T. kanzawai, T. urticae and T. truncatus are over-represented, eight strains were selected representing these three species (Fig. 4). The dataset for this analysis included 37 sequences. The final tree was rooted using the species Petrobia harti and Bryobia kissophila. These two species belong to a separate subfamily (Bryobiinae) from all other species (subfamily Tetranychinae). The analysis of the genus Tetranychus included 68 sequences. For this analysis, two Panonychus sequences and one Petrobia and one Bryobia sequence were used as an outgroup.
Fig. 4.
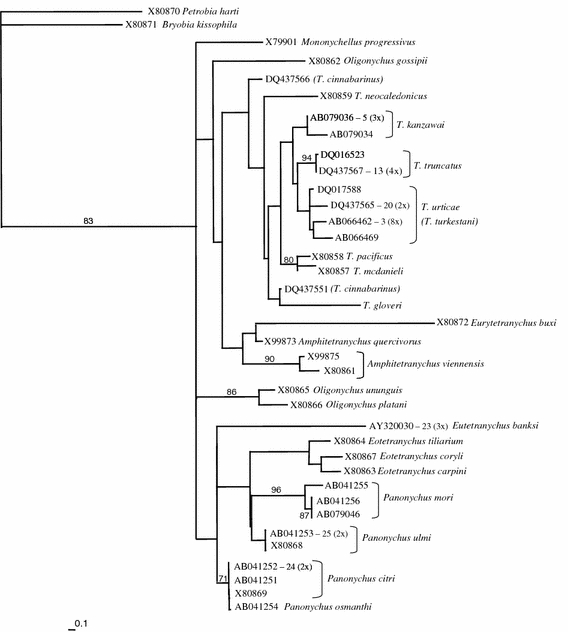
Maximum likelihood tree of the tetranychid dataset based upon COI sequences. GenBank accession numbers and associated species names are given. If a haplotype is found more than once, the accession number is followed by the haplotype number (see Appendix) and the number of times the haplotype is found between parentheses. Numbers on the branches indicate the percentage bootstrap values (>50) based on NJ bootstrapping with ML settings (1,000 replicates). Bar at the lower left corner depicts the branch length corresponding to 10% maximum likelihood distance
Because saturation of the third codon position is frequently observed for COI (Gleeson et al. 1998; Söller et al. 2001), an analysis excluding this position was performed to see if this improved the resolution of the phylogeny.
Results
Data acquisition: New sequencing
Each COI sequence that we obtained in this study was identical to several sequences already present in the GenBank dataset. Two samples, from the USA (Arizona) and Portugal, were identical to Eutetranychus banksi. The sample from citrus in Spain was identical to Panonychus citri from Japan and the sample from Poland (from Prunus spec.) to P. ulmi from Japan. The remaining samples (the two lab strains and a sample from France) were identical to an Asian T. urticae strain (sampled from Japan, Thailand, and Taiwan) (see Appendix).
Alignment and analysis of patterns of molecular evolution
All sequences could be unambiguously aligned; no insertions or deletions were found. Translation of all sequences into amino acids revealed no stop codons. The total alignment of the 91 tetranychid sequences was 390 bp (minimum sequence length was 304 bp; Fig. 1); 146 sites were phylogenetically informative, 31 sites were variable but uninformative, and 213 sites were constant. On average across all taxa, the AT content was 75% (32%A, 43%T, 11%C, and 14%G). This high AT content is a general feature of the COI region in arthropods, and is comparable to other studies on insect and mite taxa (Lunt et al. 1996; Navajas et al. 1996b). However, the distribution of bias in base composition was not uniform with respect to the three codon positions (Fig. 2). First, second, and third codon positions showed AT biases of 69, 64, and 94% respectively. In some haplotypes, no C or G base was found at the third codon position. Nevertheless, a chi-square test of base frequency homogeneity revealed no significant differences across taxa for the overall data set or for the three base positions separately (Fig. 2). Note that this test ignores correlation due to phylogeny and therefore tends to reject the null hypothesis too easily, so that failure to reject can safely be taken as evidence of homogeneity (Frati et al. 1997).
Fig. 2.
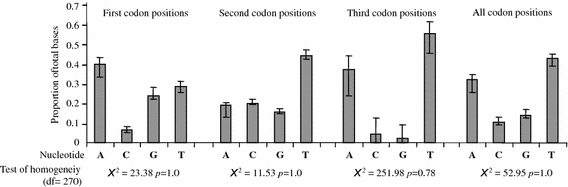
Base compositions for each codon position of the 390-bp aligned COI region, averaged over all tetranychid samples. Error bars depict minimum to maximum range. Results of the homogeneity test are given for each codon position
The extent of saturation was assessed by plotting the transition and transversion rates against uncorrected p-distance divergences (Fig. 3). At the third codon position, transversions outnumber transitions and the number of transversions begins to plateau (Fig. 3), indicating saturation and making this position unsuitable for resolving more basal branching patterns. However, removing the third codon position from the analysis did not result in a more resolved phylogeny (results not shown). This is probably due to a conserved amino acid sequence (limiting the amount of variation in first and second base pair positions as changes in these positions in most cases change the amino acid sequence).
Fig. 3.
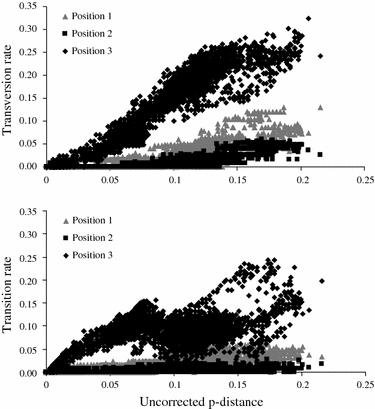
Saturation plots of transversion and transition rates against uncorrected p-distance at each codon position
The model selected by Modeltest for the tetranychid dataset was the General Time Reversible Model with invariable sites and a gamma distribution of rate heterogeneity (GTR+I+G). However, implementing the rate class ‘a b a b e f’ significantly improved the likelihood (AIC) and was therefore used for parameter and tree topology estimation. For the Tetranychus dataset the General Time Reversible Model (GTR) with site-specific rates for the three coding positions was further optimized by incorporating the following rate class: a b c d e a. This slightly simpler model significantly improved the likelihood (AIC) and was used for parameter and tree topology estimation.
Phylogenetic relationships between tetranychid genera
The ML tree of the overall analysis is shown in Fig. 4. The phylogenetic relationship among the taxa is not well resolved. This is probably due to the strongly biased nucleotide composition and the saturation at the third codon position. It shows that this portion of the COI gene is not suitable for resolving the branching order of the genera and the more distantly related species. P. harti and B. kissophila, both belonging to the subfamily Bryobiinae cluster together, and group outside the subfamily Tetranychinae. There is however no high support for monophyly of any of the genera. The NJ tree shows a similar non-resolved phylogeny (not shown) with the only difference that the genus Eotetranychus appears as a monophyletic group with high bootstrap support (78%). Differences between genera range from 8 to 22% and between species within genera from 1 to 13%.
The genus Tetranychus
Just over 50% of the sequences in GenBank are unpublished. Hong, Xie and colleagues have submitted 27 sequences (accessions DQ437542 through DQ437568, submitted March 7, 2006) as T. cinnabarinus. It is unclear why all these accessions were named T. cinnabarinus. The fact that these T. cinnabarinus accessions are scattered all over the phylogeny shows that these sequences do not concern a single species. Besides, the species name T. cinnabarinus is not generally accepted (Dupont 1979; Gotoh and Tokioka 1996), and is also not mentioned in the World Catalogue of the spider mite family (only as synonym of T. urticae) (Bolland et al. 1998). In the remainder of this paper we will not use the name T. cinnabarinus.
For the genus Tetranychus, the ML tree is shown in Fig. 5. The NJ tree shows a similar topology as the ML tree, bootstrap support values are slightly lower in the ML tree (NJ tree not shown). Several clades emerge, although the exact branching order remains unresolved (Fig. 5). The species T. kanzawai, T. urticae and presumably T. truncatus (see below) have been widely sampled and intraspecific variation is substantial. These species form a monophyletic group (bootstrap support 65%). The relationship between all other Tetranychus species remains unresolved, except that T. pacificus and T. mcdanieli cluster together (bootstrap support 83%). Two potentially new species are found (DQ437551 and DQ437566). Sequence divergence between these two accessions is 9.2%, which is of the same order as found between other species. Although these accessions are described in GenBank as T. cinnabarinus, this seems incorrect (see above).
Fig. 5.
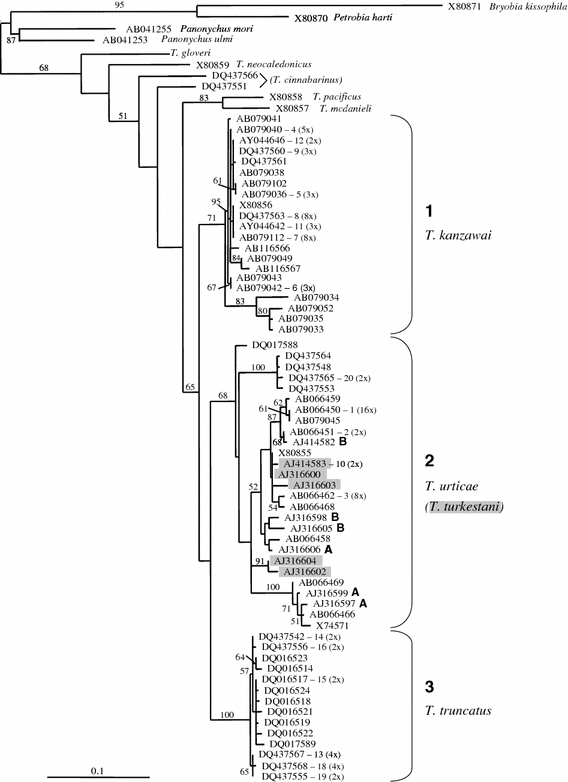
Maximum likelihood tree of the genus Tetranychus based upon COI sequences. GenBank accession numbers and associated species name are given (except for T. cinnabarinus, see text). If a haplotype is found more than once, the accession number is followed by the haplotype number (see Appendix) and the number of times the haplotype is found between parentheses. Accessions deposited on GenBank as T. turkestani are marked in grey. Accessions followed by the letter A or B indicate samples belonging to clade A and B respectively, deduced from Navajas (1998) and Navajas et al. (1998). Numbers on the branches indicate the percentage bootstrap values (>50) based on NJ bootstrapping with ML settings (1,000 replicates). Bar at the lower left corner depicts the branch length corresponding to 10% maximum likelihood distance
Tetranychus urticae, Tetranychus kanzawai and Tetranychus truncatus
The species T. urticae and T. kanzawai have been investigated in several different studies and were sampled from all over the world (see Appendix). The analysis of COI variation reveals the existence of very divergent lineages (Fig. 5). Clade 1 contains all T. kanzawai specimens (bootstrap value = 71%). This clade contains two subclades that were previously described by Hinomoto and Takafuji (2001). On the other hand, T. urticae specimens form a highly diverse group in which several well-supported clades are recognized. One clade (clade 3 in Fig. 5) comprises T. urticae specimens all originating from China (bootstrap value = 100%). Hinomoto et al. (2007) renamed this clade T. truncatus. All other T. urticae specimens form a group of highly divergent lineages (clade 2), which fall into several more or less supported subclades. Moreover, within this group several specimens have been identified as T. turkestani, but these do not form a monophyletic group.
Discussion
The phylogenetic analysis of all COI sequences available in GenBank revealed novel patterns, which alter current views on species delineation and phylogeographic patterns in spider mites. In addition, we found that a number of accessions are probably registered under a wrong species name. This may in the past have led to erroneous interpretations of phylogenetic patterns that included these GenBank accessions.
One application of phylogenetic analysis is the identification of natural groupings in phylogenetic trees that represent biological species (DNA taxonomy). Our most inclusive assemblage of data shows new, and previously unnoticed, groups that most likely concern different species (Fig. 5). In particular, the phylogenetic patterns within T. urticae differ from these of previous studies and provide new insights in the evolutionary history of this group. Up to now, two clades within T. urticae were recognized, named clade A and B by Navajas et al. (1998) and Hinomoto et al. (2001) and lineage I and II by Xie et al. (2006a). The latter concluded that lineage I and II were consistent with the two clades A and B. However, this conclusion is not supported by our analysis. Our clade 2 (Fig. 5) contains specimens of lineage II (Xie et al. 2006a) and clade A and B (Navajas et al. 1998). Moreover, clade A and B disappear in our total analysis and new groupings emerge. Clade 3 contains specimens of lineage I. In fact, clade 3 is a well supported clade restricted to China that clusters outside the other T. urticae samples. It is unclear from the study of Xie et al. (2006a) whether mites from clade 3 were morphologically different from other T. urticae samples. Clade 3 presumably represents T. truncatus, as suggested by Hinomoto et al. (2007), based on morphological identification of newly sampled Japanese mites with highly similar COI sequences.
Tetranychus urticae and Tetranychus turkestani
GenBank specimens listed as T. urticae and T. turkestani do not form separate monophyletic clades (Fig. 5). This is in agreement with a study by Navajas and Boursot (2003) that was based on a smaller dataset. Although Navajas and Boursot (2003) were able to separate the two species based on ITS2 sequence, this distinction was based on three diagnostic sites only. Moreover, intraspecific and intra-individual variation within ITS2 was found, which further questions the recognition of two different species. In addition, there are no discrete morphological differences between the two species. Taxonomic identification is based on continuous traits (e.g., the shape of the aedeagus of males) and there is no thorough study describing variation of these traits within and between these species. The current data do not support the maintenance of T. turkestani as a separate species.
Host plant relationships
Host race formation is another evolutionary process studied in spider mites that may explain the diversity in this group of mites. Phylogenetics is one approach to assess spider mite––host plant associations. Most Tetranychus species are reported from many different host plant species. For example, Bolland et al. (1998) described 911 different host plant species for T. urticae, belonging to 121 plant families. We found no correlation between COI divergence and associated host plant species (Fig. 5 and Appendix), similar to what was found by Navajas (1998). Even strains with identical COI haplotypes can be found on very different host plant species. Also the other two relatively well sampled species T. kanzawai and T. truncatus do not show host plant associations.
Phylogeographic patterns
Phylogenetic analysis is also used for determining phylogeographic distribution patterns (Avise 2000). Phylogeographic information is important for assessing historic migration and colonization routes and can also be used for tracing the origin of accidental introductions. For T. kanzawai, two main clades are distinguished originating from eastern Asia (Japan, Taiwan and China), except one sample that originates from Congo. This suggests that T. kanzawai has a mainly eastern Asian distribution. However, Bolland et al. (1998) reported T. kanzawai from all over the world, but it is not known if these samples fall within the clades found so far. Clade 3 (T. truncatus) appears restricted to China (Fig. 5).
Within T. urticae no phylogeographic pattern is apparent with respect to COI variation. Samples form Europe, Asia, and North and South America are scattered over the tree. The phylogeographic patterns previously described by Navajas et al. (1998) completely disappeared. They found an entirely Mediterranean clade (clade A) and a clade of mixed origin (clade B). Because the Mediterranean clade had the highest diversity, they argued that this region served as a source from which other non-Mediterranean regions of the northern hemisphere were recently colonized by a subset of the Mediterranean clades (Navajas et al. 1998; Hinomoto et al. 2001). However, inclusion of all currently available sequences does not support their conclusion. Clade A and B fall apart and moreover, many more clades are found. There are several possible explanations for the absence of clear phylogeographic patterns. First, such patterns may simply not exist. Second, T. urticae is a pest species on many crops and ornamentals and it is likely that the international trade in crops has influenced the distribution of the mites around the world. This will obscure any correlation between geographical location and phylogeny. Finally, selective sweeps can greatly influence phylogenetic patterns (Ballard and Rand 2005). Evidence is accumulating that selective sweeps are often associated with the presence of reproductive parasites such as Wolbachia and Cardinium (Hurst and Jiggins 2005).
Phylogenetic inferences and DNA barcoding
The analyzed COI region shows considerable variation among the tetranychids examined. The diversity within species is especially high with a maximum of 7.2%. This is a mixed blessing: it makes COI suitable for investigating intraspecific variation, but its usefulness for resolving phylogenetic species relationships remains limited. The latter is due to a strongly biased nucleotide composition at the third codon position and consequently saturation at this position. Variation at first and second codon positions is very low. As a result, relationships between taxa are difficult to resolve, especially at the deeper nodes. An extremely high AT content and saturation at the third codon position was also encountered in other studies, for the same COI fragment as used in this study in parasitengona mites and for the adjacent COI region in velvet worms (Onychophora) (Gleeson et al. 1998; Söller et al. 2001).
The COI fragment analyzed in this study is different from the usual DNA barcoding fragment, which is located at the 5′ end side of our fragment (Fig. 1). Because this barcoding fragment is amplified by primers developed by Folmer et al. (1994) it is referred to as the Folmer fragment (Erpenbeck et al. 2006). Substitution patterns may differ between gene partitions and may result in different phylogenetic signals for these partitions (Erpenbeck et al. 2006). To determine whether our fragment had the same phylogenetic signal as the commonly used Folmer fragment we compared the substitution patterns of both fragments. We did not find different substitution patterns when investigating 294–448 bp of the Folmer fragment for samples for which this fragment was available (results not shown). A dataset of 27 unique sequences (representing 46 samples) revealed a highly similar substitution pattern with transversions outnumbering transitions resembling the patterns in Fig. 3. We therefore assume that analyzing the Folmer fragment for tetranychid mites will reveal similar patterns as found in this study.
Currently, the Folmer fragment is widely used as a gene partition for barcoding species (e.g., Gómez et al. 2007; Hebert et al. 2003, 2004), although other fragments have also been proposed (e.g., in plants; Kress et al. 2005). DNA barcoding assumes that genetic distances between species are greater than within species. In that way, clusters of similar sequences represent species, clearly separated from other clusters (species). Hebert et al. (2003) proposed the use of a standard threshold (divergence value) to identify species. Up to now, several studies have reported successful barcoding of species (e.g., Barret and Hebert 2005; Gómez et al. 2007; Hebert et al. 2003, 2004). However, often, intraspecific variation was not at all or not thoroughly investigated, because only one or two individuals per species were analyzed or geographic sampling was restricted (Dasmahapatra and Mallet 2006; Prendini 2005). This may result in significant underestimation of the amount of intraspecific variation. Additionally, interspecific variation might be overestimated if closely related sister taxa are not included in the analysis. Therefore, it is necessary to analyze samples from more than one geographic region and to include closely related sister species. Our study comprises an analysis of three closely related species that were widely sampled and showed extensive amounts of intraspecific variation. Moreover, in several cases intraspecific variation exceeded interspecific variation between the species, as is illustrated by overlapping frequency distributions of intra- and interspecific pairwise p-distances (Fig. 6). For example, differences within T. urticae reach up to 7.2%, exceeding the minimum 3.7% difference between T. urticae and T. kanzawai. Thus the general barcoding assumption that intraspecific variation is smaller than interspecific variation is violated in tetranychids, indicating that simply relying on genetic distances is not sufficient for species identification. This clearly illustrates the importance of including samples of various, geographically different populations for each species, and to include comparisons with sister species, when investigating the efficacy of barcoding. It also shows the need to include phylogenetic information to delineate species groupings, instead of simply relying on sequence divergences (Prendini 2005; Rubinoff et al. 2006). A careful analysis of the DNA phylogeny, preferably in a multi disciplinary approach (including multiple gene data, morphological, ecological or other relevant data), can assist in defining or delimiting species, but the use of single sequences in combination with a threshold seems insufficient to simply identify species.
Fig. 6.
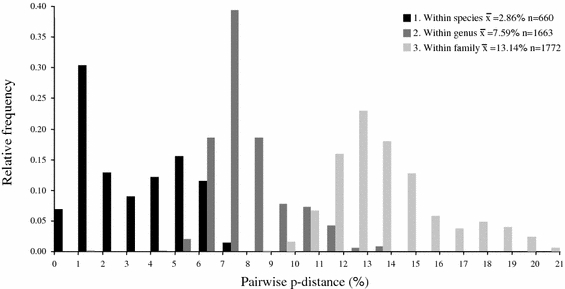
Histogram of pairwise differences (p-distance) between 91 COI sequences within the family Tetranychidae. Pairwise differences are separated into three categories: 1. between individuals in the same species; 2. between individuals in the same genus (excluding intraspecific differences); 3. between individuals in the same family (excluding intraspecific and intrageneric differences). n = number of pairwise comparisons
Reproductive parasites and selective sweeps
There are a number of additional problems associated with the use of a single mitochondrial gene for barcoding. Hybridization can result in reticulate evolutionary relationships between species and disturb groupings into species based on mtDNA. Selective sweeps of mtDNA can both homogenize or increase mtDNA diversity. The widespread occurrence of reproductive parasites in arthropods can both influence the frequency of hybridization between host species and indirectly cause selective sweeps of mtDNA (Hurst and Jiggins 2005). These parasites can cause homogenization of biological species after hybridization followed by spreading of the intracellular reproductive parasite. The mitochondrial haplotype is dragged along with these parasites resulting in replacement of the original mitochondrial haplotype and reducing mitochondrial diversity. In a recent study, Whitworth et al. (2007) found a lack of species monophyly in the blowfly genus Protocalliphora due to introgressive hybridization associated with Wolbachia infection. On the other hand, the presence of different reproductive parasites co-infecting the same host species may increase the levels of mitochondrial diversity within that host species if each parasite is tightly linked to a different haplotype (Schulenburg et al. 2002). Infection with reproductive parasites may thus increase or decrease mitochondrial diversity and severely influence the patterns of mitochondrial DNA variation.
Intracellular reproductive parasites such as Wolbachia, Cardinium, and Rickettsia, are widespread in tetranychid mites (Breeuwer and Jacobs 1996; Gotoh et al. 2003; Hoy and Jeyaprakash 2005; Xie et al. 2006b). They can cause cytoplasmic incompatibility (CI) and hybrid breakdown in spider mites (Breeuwer 1997; Gotoh et al. 2003, 2006; Vala et al. 2000). It is possible that the COI variation found within and between closely related mite species is a result of selective sweeps caused by infection with reproductive parasites. Variation within species is relatively high. It is not linked to geographical location nor associated with the host plant. An interesting next step would be to investigate the link between haplotype variation within COI and variation in reproductive parasites. We should be especially cautious with the use of mitochondrial genes for delineating and barcoding biological species in light of the presence of reproductive parasites.
Conclusions and recommendations
Accurate species delineation and identification is important for our ability to understand and interpret evolutionary processes and ecological diversity in mites. It is also clear that mites are a difficult group to identify morphologically, as many key traits exhibit large phenotypic plasticity and lack suitable characters for identification. Many ecological, behavioral, genetic and pest-control studies have been conducted on various tetranychid species or strains, without the concurrent storage of voucher specimens, leading to subsequent uncertainty about the identity of the investigated specimens. In such cases, DNA barcoding can be an important and powerful tool to assist in species identification (Will et al. 2005). However, the use of a single (mitochondrial) gene for DNA barcoding or DNA taxonomy seems inappropriate. An integrative approach is needed combining nuclear and mitochondrial genes, morphological characters, and ecological information (and if possible crossing experiments).
A combined analysis of mitochondrial and nuclear markers is commonly used to avoid the problem that gene trees are not necessarily congruent with species trees and for the detection of hybridization. The challenge is to find suitable nuclear markers and robust geographic sampling designs that allow for the assessment of intra- and interspecific variation. Navajas and Fenton (2000) and Cruickshank (2002) have investigated the suitability of various molecular markers, but there is still a need for nuclear markers suitable for distinguishing closely related species. Recently, Sonnenberg et al. (2007) suggested the D1-D2 region of the nuclear 28S rDNA gene as a taxonomic marker. It could complement DNA barcoding studies based on mitochondrial DNA sequences. In addition, molecular testing for reproductive parasites and crossing experiments using isofemale lines should be standard procedure to delineate biological species.
Acknowledgements
We thank Tom Groot for collecting mite specimens and Steph Menken and three anonymous reviewers for comments on the manuscript. This research was funded by The Netherlands Organisation for Scientific Research (NWO; ALW4PJ/03–25).
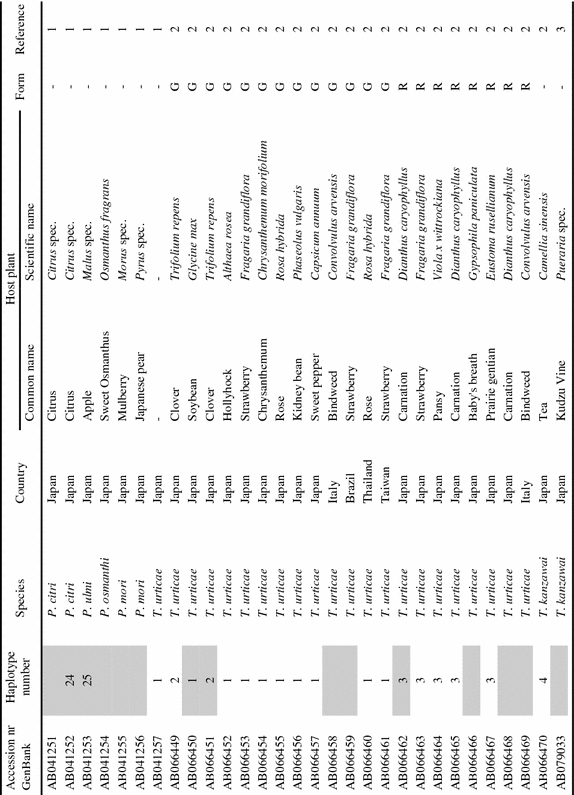
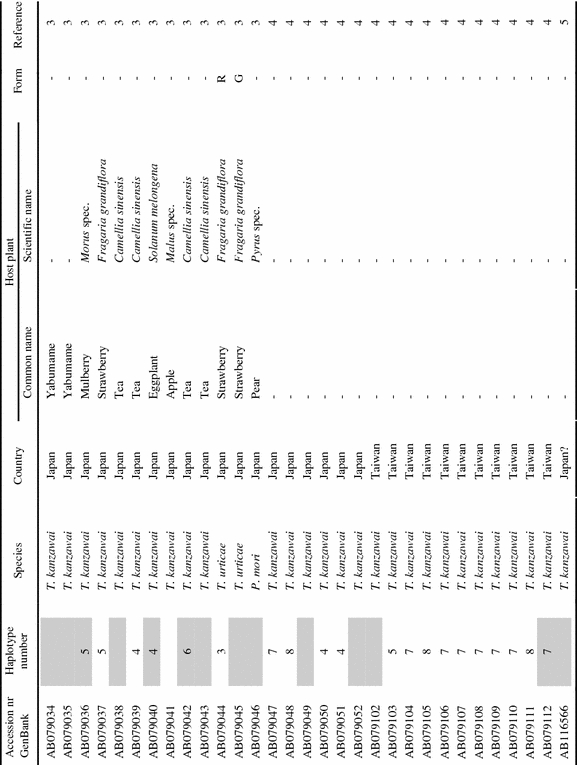
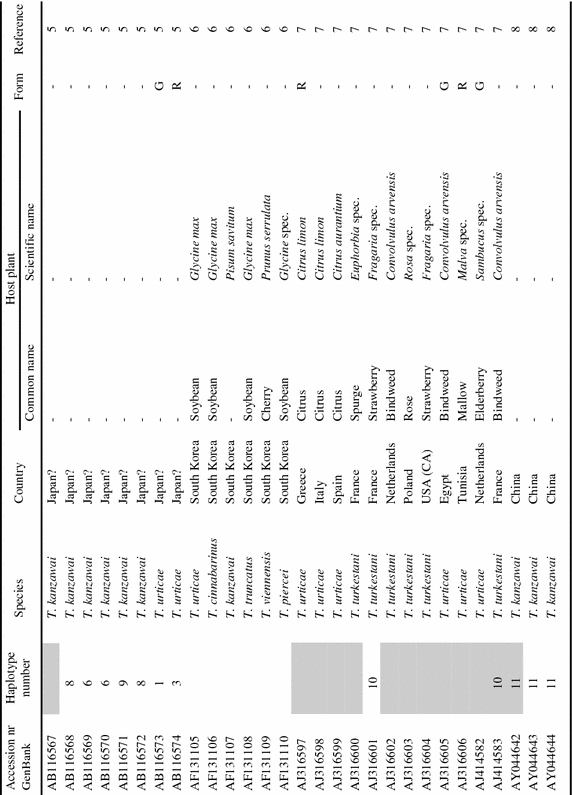
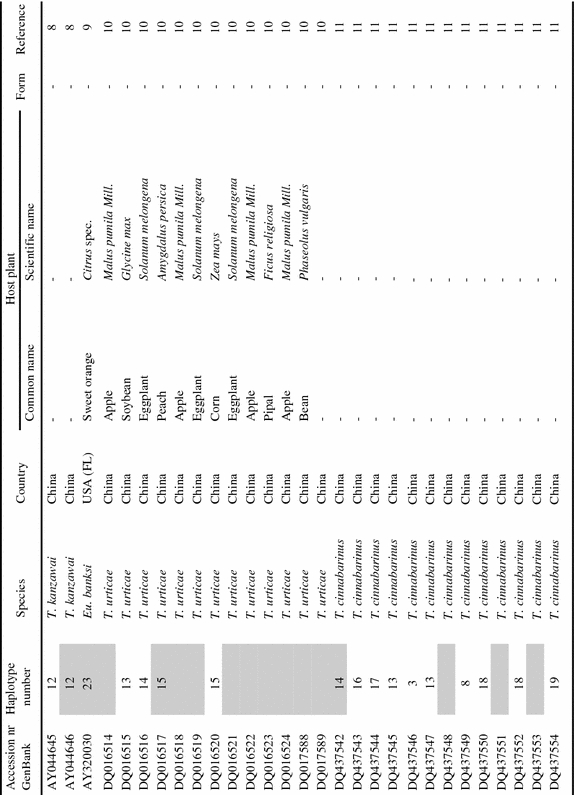
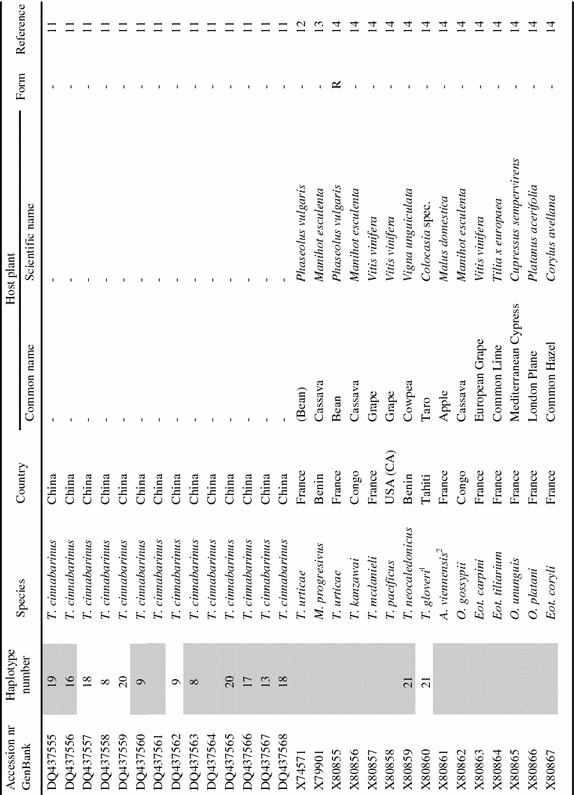
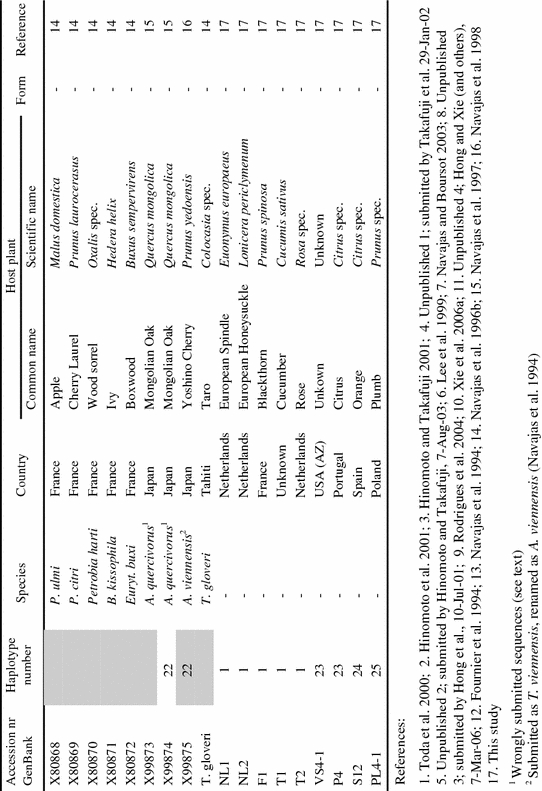
Appendix
List of tetranychid COI sequences from GenBank and the sequences obtained in this study. Sequences were collected from GenBank on September 8th, 2006 (keywords for search were ‘cytochrome oxidase subunit I AND Tetranychidae’). Information on host plant species and geographic origin was extracted from the original reference article. Species names were copied from GenBank. ‘Haplotype number’ indicates groups of identical sequences. Sequences identical at the 390 bp part are indicated by the same number. Samples included in the dataset for the phylogenetic analysis are marked grey in this column. ‘Form’ indicates the green (G) and red (R) color morphs of T. urticae. Genus name abbreviations: T=Tetranychus; A=Amphitetranychus; B=Bryobia; P=Panonychus; O=Oligonychus; M=Mononychellus; Eut=Eutetranychus; Euryt=Eurytetranychus; Eot=Eotetranychus.
|
References
- Akaike H (1974) A new look at the statistical model identification. IEEE Trans Autom Contr 19:716–723 [DOI]
- Avise JC (2000) Phylogeography. The history and formation of species. Harvard University Press, Cambridge, MA
- Ballard JWO, Rand DM (2005) The population biology of mitochondrial DNA and its phylogenetic implications. Annu Rev Ecol Evol S 36:621–642 [DOI]
- Barrett RDH, Hebert PDN (2005) Identifying spiders through DNA barcodes. Can J Zool 83:481–491 [DOI]
- Bolland HR, Gutierrez J, Flechtmann CHW (1998) World catalogue of the spider mite family (Acari: Tetranychidae). Brill, Leiden, Boston, Koln
- Breeuwer JAJ, Jacobs G (1996) Wolbachia: intracellular manipulators of mite reproduction. Exp Appl Acarol 20:421–434 [DOI] [PubMed]
- Breeuwer JAJ (1997) Wolbachia and cytoplasmic incompatibility in the spider mites Tetranychus urticae and T. turkestani. Heredity 79:41–47 [DOI]
- Cruickshank RH (2002) Molecular markers for the phylogenetics of mites and ticks. Syst Appl Acarol 7:3–14
- Dasmahapatra KK, Mallet J (2006) DNA barcodes: recent successes and future prospects. Heredity 97:254–255 [DOI] [PubMed]
- Doyle JJ (1991) DNA protocols for plants. In: Hewitt G, Johnson AWB, Young JPW (eds) Molecular techniques in taxonomy. Springer, Berlin
- Dupont LM (1979) On gene flow between Tetranychus urticae Koch, 1836 and Tetranychus cinnabarinus (Boisduval) Boudreaux, 1956 (Acari: Tetranychidae): synonymy between the two species. Entomol Exp Appl 25:297–303 [DOI]
- Ehara S (1999) Revision of the spider mite family Tetranychidae of Japan (Acari, Prostigmata). Species Divers 4:63–141
- Erpenbeck D, Hooper JNA, Worheide G (2006) CO1 phylogenies in diploblasts and the ‘Barcoding of Life’––are we sequencing a suboptimal partition? Mol Ecol Notes 6:550–553 [DOI]
- Folmer O, Black M, Hoeh W, Lutz R, Vrijenhoek R (1994) DNA primers for amplification of mitochondrial cytochrome C oxidase subunit I form diverse metazoan invertebrates. Molec Mar Biol Biotech 3:294–299 [PubMed]
- Frati F, Simon C, Sullivan J, Swofford DL (1997) Evolution of the mitochondrial cytochrome oxidase II gene in collembola. J Mol Evol 44:145–158 [DOI] [PubMed]
- Gleeson DM, Rowell DM, Tait NN, Briscoe DA, Higgins AV (1998) Phylogenetic relationships among Onychophora from Australasia inferred from the mitochondrial cytochrome oxidase subunit I gene. Mol Phylogenet Evol 10:237–248 [DOI] [PubMed]
- Gómez A, Wright PJ, Lunt DH, Cancino JM, Carvalho GR, Hughes RN (2007) Mating trials validate the use of DNA barcoding to reveal cryptic speciation of a marine bryozoan taxon. Proc R Soc B 274:199–207 [DOI] [PMC free article] [PubMed]
- Gotoh T, Tokioka T (1996) Genetic compatibility among diapausing red, non-diapausing red and diapausing green forms of the two-spotted spider mite, Tetranychus urticae Koch (Acari: Tetranychidae). Jpn J Ent 64:215–225
- Gotoh T, Noda H, Hong XY (2003) Wolbachia distribution and cytoplasmic incompatibility based on a survey of 42 spider mite species (Acari: Tetranychidae) in Japan. Heredity 91:208–216 [DOI] [PubMed]
- Gotoh T, Noda H, Ito S (2006) Cardinium symbionts cause cytoplasmic incompatibility in spider mites. Heredity 98:13–20 [DOI] [PubMed]
- Hebert PDN, Cywinska A, Ball SL, deWaard JR (2003) Biological identifications through DNA barcodes. Proc R Soc B 270:313–321 [DOI] [PMC free article] [PubMed]
- Hebert PDN, Stoeckle MY, Zemlak TS, Francis CM (2004) Identification of birds through DNA barcodes. Plos Biol 2:1657–1663 [DOI] [PMC free article] [PubMed]
- Hinomoto N, Osakabe M, Gotoh T, Takafuji A (2001) Phylogenetic analysis of green and red forms of the two-spotted spider mite, Tetranychus urticae Koch (Acari: Tetranychidae), in Japan, based on mitochondrial cytochrome oxidase subunit I sequences. Appl Entomol Zool 36:459–464 [DOI]
- Hinomoto N, Takafuji A (2001) Genetic diversity and phylogeny of the Kanzawa spider mite, Tetranychus kanzawai, in Japan. Exp Appl Acarol 25:355–370 [DOI] [PubMed]
- Hinomoto N, Tran DP, Pham AT, Le TBN, Tajima R, Ohashi K, Osakabe M, Takafuji A (2007) Identification of spider mites (Acari: Tetranychidae) by DNA sequences: a case study in Northern Vietnam. Int J Acarol 33:53–60
- Hoy MA, Jeyaprakash A (2005) Microbial diversity in the predatory mite Metaseiulus occidentalis (Acari: Phytoseiidae) and its prey, Tetranychus urticae (Acari : Tetranychidae). Biol Control 32:427–441 [DOI]
- Hurst GDD, Jiggins FM (2005) Problems with mitochondrial DNA as a marker in population, phylogeographic and phylogenetic studies: the effects of inherited symbionts. Proc R Soc B 272:1525–1534 [DOI] [PMC free article] [PubMed]
- Kress WJ, Wurdack KJ, Zimmer EA, Weigt LA, Janzen DH (2005) Use of DNA barcodes to identify flowering plants. P Natl Acad Sci USA 102:8369–8374 [DOI] [PMC free article] [PubMed]
- Lee ML, Suh SJ, Kwon YJ (1999) Phylogeny and diagnostic markers of six Tetranychus species (Acarina: Tetranychidae) in Korea based on the mitochondrial cytochrome oxidase subunit I. J Asia-Pacific Entomol 2:85–92
- Lunt DH, Zhang DX, Szymura JM, Hewitt GM (1996) The insect cytochrome oxidase I gene: evolutionary patterns and conserved primers for phylogenetic studies. Insect Mol Biol 5:153–165 [DOI] [PubMed]
- Monaghan MT, Balke M, Gregory TR, Vogler AP (2005) DNA-based species delineation in tropical beetles using mitochondrial and nuclear markers. Phil Trans R Soc B 360:1925–1933 [DOI] [PMC free article] [PubMed]
- Moritz C, Cicero C (2004) DNA barcoding: promise and pitfalls. Plos Biol 2:1529–1531 [DOI] [PMC free article] [PubMed]
- Navajas M, Gutierrez J, Bonato O, Bolland HR, Mapangoudivassa S (1994) Intraspecific diversity of the cassava green mite Mononycellus progresivus (Acari, Tetranychidae) using comparisons of mitochondrial and nuclear ribosomal DNA-sequences and cross-breeding. Exp Appl Acarol 18:351–360 [DOI] [PubMed]
- Navajas M, Fournier D, Lagnel J, Gutierrez J, Boursot P (1996a) Mitochondrial COI sequences in mites: evidence for variations in base composition. Insect Mol Biol 5:281–285 [DOI] [PubMed]
- Navajas M, Gutierrez J, Lagnel J, Boursot P (1996b) Mitochondrial cytochrome oxidase I in tetranychid mites: a comparison between molecular phylogeny and changes of morphological and life history traits. B Entomol Res 86:407–417
- Navajas M, Gutierrez J, Gotoh T (1997) Convergence of molecular and morphological data reveals phylogenetic information on Tetranychus species and allows the restoration of the genus Amphitetranychus (Acari:Tetranychidae). B Entomol Res 87:283–288
- Navajas M (1998) Host plant associations in the spider mite Tetranychus urticae (Acari: Tetranychidae): insights from molecular phylogeography. Exp Appl Acarol 22:201–214 [DOI]
- Navajas M, Lagnel J, Gutierrez J, Boursot P (1998) Species-wide homogeneity of nuclear ribosomal ITS2 sequences in the spider mite Tetranychus urticae contrasts with extensive mitochondrial COI polymorphism. Heredity 80:742–752 [DOI] [PubMed]
- Navajas M, Fenton B (2000) The application of molecular markers in the study of diversity in acarology: a review. Exp Appl Acarol 24:751–774 [DOI] [PubMed]
- Navajas M, Boursot P (2003) Nuclear ribosomal DNA monophyly versus mitochondrial DNA polyphyly in two closely related mite species: the influence of life history and molecular drive. Proc R Soc B 270:S124–S127 [DOI] [PMC free article] [PubMed]
- Posada D, Crandall KA (1998) MODELTEST: testing the model of DNA substitution. Bioinformatics 14:817–818 [DOI] [PubMed]
- Prendini L (2005) Comment on “Identifying spiders through DNA barcodes”. Can J Zool 83:498–504 [DOI]
- Rubinoff D, Cameron S, Will K (2006) Are plant DNA barcodes a search for the Holy Grail? Trends Ecol Evol 21:1–2 [DOI] [PubMed]
- Schulenburg JHGV, Hurst GDD, Tetzlaff D, Booth GE, Zakharov IA, Majerus MEN (2002) History of infection with different male-killing bacteria in the two-spot ladybird beetle Adalia bipunctata revealed through mitochondrial DNA sequence analysis. Genetics 160:1075–1086 [DOI] [PMC free article] [PubMed]
- Shapiro B, Rambaut A, Drummond AJ (2006) Choosing appropriate substitution models for the phylogenetic analysis of protein-coding sequences. Mol Biol Evol 23:7–9 [DOI] [PubMed]
- Söller R, Wohltmann A, Witte H, Blohm D (2001) Phylogenetic relationships within terrestrial mites (Acari: Prostigmata, Parasitengona) inferred from comparative DNA sequence analysis of the mitochondrial cytochrome oxidase subunit I gene. Mol Phylogenet Evol 18:47–53 [DOI] [PubMed]
- Sonnenberg R, Nolte AW, Tautz D (2007) An evaluation of LSU rDNA D1-D2 sequences for their use in species identification. Front Zool 4:6 [DOI] [PMC free article] [PubMed]
- Sullivan J, Abdo Z, Joyce P, Swofford DL (2005) Evaluating the performance of a successive-approximations approach to parameter optimization in maximum-likelihood phylogeny estimation. Mol Biol Evol 22:1386–1392 [DOI] [PubMed]
- Swofford DL (2002) PAUP*, Phylogenetic Analysis Using Parsimony (*and Other Methods). Sinauer Associates, Sunderland
- Swofford DL, Sullivan J (2003) Phylogeny inference based on parsimony and other methods using PAUP*. In: Salemi M, Vandamme A-M (eds) The phylogenetic handbook. A practical approach to DNA and protein phylogeny. Cambridge University Press, Cambridge
- Thompson JD, Gibson TJ, Plewniak F, Jeanmougin F, Higgins DG (1997) The CLUSTAL_X windows interface: flexible strategies for multiple sequence alignment aided by quality analysis tools. Nucleic Acids Res 25:4876–4882 [DOI] [PMC free article] [PubMed]
- Toda S, Osakabe M, Komazaki S (2000) Interspecific diversity of mitochondrial COI sequences in Japanese Panonychus species (Acari: Tetranychidae). Exp Appl Acarol 24:821–829 [DOI] [PubMed]
- Vala F, Breeuwer JAJ, Sabelis MW (2000) Wolbachia-induced ‘hybrid breakdown’ in the two-spotted spider mite Tetranychus urticae Koch. Proc R Soc B 267:1931–1937 [DOI] [PMC free article] [PubMed]
- Vogler AP, Monaghan MT (2007) Recent advances in DNA taxonomy. J Zool Syst Evol Res 45:1–10 [DOI]
- Whitworth TL, Dawson RD, Magalon H, Baudry E (2007) DNA barcoding cannot reliably identify species of the blowfly genus Protocalliphora (Diptera: Calliphoridae). Proc R Soc B 274:1731–1739 [DOI] [PMC free article] [PubMed]
- Will KW, Mishler BD, Wheeler QD (2005) The perils of DNA barcoding and the need for integrative taxonomy. Syst Biol 54:844–851 [DOI] [PubMed]
- Xia X, Xie Z (2001) DAMBE: software package for data analysis in molecular biology and evolution. J Hered 92:371–373 [DOI] [PubMed]
- Xie L, Hong XY, Xue XF (2006a) Population genetic structure of the two-spotted spider mite (Acari: Tetranychidae) from China. Ann Entomol Soc Am 99:959–965 [DOI]
- Xie L, Miao H, Hong XY (2006b) The two-spotted spider mite Tetranychus urticae Koch and the carmine spider mite Tetranychus cinnabarinus (Boisduval) in China mixed in their Wolbachia phylogenetic tree. Zootaxa 1165:33–46
- Zhang ZQ, Jacobson RJ (2000) Using adult female morphological characters for differentiating Tetranychus urticae complex (Acari: Tetranychidae) from greenhouse tomato crops in UK. Syst Appl Acarol 5:69–76