

Abstract
Objective
Evaluation and treatment of patients with early stages of osteoarthritis is dependent upon an accurate assessment of the cartilage lesions. However, standard cartilage dedicated MR techniques are inconclusive in quantifying early degenerative changes. The objective of this study was to determine the ability of MR T1ρ and T2 mapping to detect cartilage matrix degeneration between normal and early OA patients.
Method
Sixteen healthy volunteers (mean age 41.3) without clinical or radiological evidence of OA and 10 patients (mean age 55.9) with OA were scanned using a 3 Tesla (3T) MR scanner. Cartilage volume and thickness, T1ρ and T2 values were compared between normal and OA patients. The relationship between T1ρ and T2 values, and Kellgren Lawrence (KL) scores based on plain radiographs and cartilage lesion grading based on MR images were studied.
Results
The average T1ρ and T2 values were significantly increased in OA patients compared with controls (52.04 ± 2.97 ms versus 45.53 ± 3.28 ms with P = 0.0002 for T1ρ, and 39.63 ±2.69 versus 34.74 ± 2.48 with P = 0.001 for T2). Increased T1ρ and T2 values were correlated with increased severity in radiographic and MR grading of OA. T1ρ has a larger range and higher effect size than T2, 3.7 versus 3.0.
Conclusion
Our results suggest that both in vivo T1ρ and T2 relaxation times increase with the degree of cartilage degeneration. T1ρ relaxation time may be a more sensitive indicator for early cartilage degeneration than T2. The ability to detect early cartilage degeneration prior to morphologic changes may allow us to critically monitor the course of OA and injury progression, and to evaluate the success of treatment to patients with early stages of OA.
Keywords: Osteoarthritis, Cartilage Imaging, Magnetic Resonance Imaging, T1ρ, T2
INTRODUCTION
Osteoarthritis is a heterogeneous and multifactorial disease characterized primarily by the progressive loss of hyaline articular cartilage 1. Plain radiographs have been used primarily in the evaluation of OA, which depict only narrowing of the joint space or gross osseous changes that tend to occur late in the disease. Early changes in the articular cartilage may not be visible on plain radiographs. Cartilage loss can only be indirectly inferred by the development of joint-space narrowing, which can be highly unreliable even with careful attention to proper technique 2. In addition, plain radiographs are insensitive to focal cartilage loss, and widening of the joint space despite significant cartilage loss can occur in one compartment of the knee simply as a result of narrowing in the other compartment 3.
MRI has been found useful to visualize cartilage directly yet morphologic imaging shows damage at a stage when cartilage is already irreversibly lost. Standard cartilage dedicated MR techniques include fat saturated T2-weighted, proton density-weighted fast spin echo (FSE) sequences and T1-weighted spoiled gradient echo (SPGR) sequences. These sequences, however, are inconclusive in quantifying early degenerative changes of the cartilage matrix, especially biochemical changes such as proteoglycan loss 4. Early events in the development of cartilage matrix breakdown include the loss of proteoglycans, changes in water content, and molecular level changes in collagen 5. Early diagnosis of cartilage injury would require the ability to non-invasively detect changes in proteoglycan concentration and collagen integrity before gross morphologic changes occur.
T2 relaxation reflects the ability of free water proton molecules to move and to exchange energy inside the cartilaginous matrix. Damage to collagen-PG matrix and increase of water content in degenerating cartilage may increase T2 relaxation times. In vivo T2 relaxation times have been derived by several groups 6–10. Elevated T2 values were observed in patients with OA 7,10. T1ρ (T1rho) relaxation time has recently been proposed as an attractive alternative parameter to probe biochemical changes in cartilage 11–15. The T1ρ parameter describes the spin-lattice relaxation in the rotating frame 16. It probes the slow motion interactions between motion-restricted water molecules and their local macromolecular environment. The extracellular matrix in articular cartilage provides a motion-restricted environment to water molecules. Changes to the extracellular matrix, such as proteoglycan loss, therefore may be reflected in measurements of T1ρ. Initial studies in human subjects showed elevated T1ρ values in patients with OA 17–19. Although both T1ρ and T2 can probe slow motion of water protons, they are parameters describing different MR relaxation mechanisms. T1ρ is spin-lattice relaxation related with the energy changes between proton spins and the environment, while T2 is spin-spin relaxation related with the energy changes between proton spins themselves. Therefore, these two parameters may provide complementary information regarding macromolecular changes in cartilage.
With the improvement in cartilage resurfacing procedures and development of disease modifying drugs for OA, there is a need to develop a non-invasive method to monitor early cartilage degeneration or restoration 20–23. In this study, we investigated the changes in T1ρ and T2 relaxation times in normal and osteoarthritic patients using 3T MRI. Our hypothesis was that there would be an increase in both T1ρ and T2 values in cartilage in osteoarthritic patients compared to normal controls. We further hypothesized that the amount of T1ρ and T2 elevation would be related to the severity of OA.
MATERIALS AND METHODS
Subjects
Sixteen healthy volunteers (eight female and eight male, ranging in age from 22 to 74 years, with an average age of 41.3 years) and 10 patients with clinical OA symptoms and radiological findings (three female and seven male, ranging in age from 37 to 72 years, with an average age of 55.9 years) were studied. Among them 10 healthy volunteers (four female and six male, ranging in age from 28 to 74 years, with an average age of 41.0 years) were scanned for both T1ρ and T2 mapping, while in the remaining 6 volunteers only T1ρ mapping was obtained. In all patients standard radiographs were obtained in addition to both T1ρ and T2 MR examinations. The study was approved by the Committee for Human Research at our institution and all of the subjects gave informed consent.
Imaging Protocol
In the patients, the standard knee radiographic protocol included 1) bilateral standing flexion weight-bearing view, 2) 30 degrees flexion lateral, and 3) bilateral patellofemoral, sunrise views.
All MR exams were implemented on a 3T GE Excite Signa MR scanner using a quadrature transmit/receive knee coil. The protocol included six sequences: sagittal T1-weighted spin-echo (SE) imaging (TR/TE = 700/13.5 ms, FOV = 16 cm, matrix = 288 × 224, bandwidth = 15.63 KHz, Number of excitations [NEX] = 2), sagittal and axial 3D water excitation high-resolution spoiled gradient-echo (SPGR) imaging (TR/TE = 15/6.7 ms, flip angle = 12, FOV = 16 cm, matrix = 512 × 512, slice thickness = 1 mm, bandwidth = 31.25 kHz, NEX = 0.75), sagittal fat-saturated T2-weighted fast spin-echo (FSE) images (TR/TE = 3700/68 ms, FOV = 14 cm, matrix = 288 × 224, slice thickness = 3 mm, echo train length [ETL] = 8, bandwidth = 16.5 kHz, NEX = 2), and axial T1ρ-weighted and T2-weighted images.
The multi-slice T1ρ-weighted images were obtained using the sequence we previously developed based on spin-lock techniques and spiral image acquisition 19. The acquisition parameters were: 14 interleaves/slice, 4,096 points/interleaf, FOV = 16 cm, effective in-plane spatial resolution = 0.6 × 0.6 mm, slice thickness = 3 mm, skip = 1 mm, number of slices = 14–16, TR/TE = 2000/5.8 ms, time of spin-lock (TSL) = 20/40/60/80 ms, spin lock frequency = 500 Hz. The total acquisition time was approximately 13 minutes. The axial T1ρ-weighted images were prescribed on sagittal SPGR images, covering regions from the top of the patellar cartilage to the femoral-tibial cartilage. The T2 quantification sequence was also based on spiral sequence 24,25 with TR/TE = 2000/6.7, 12, 28, 60 ms, All other prescription parameters of the T2 sequence were the same as the T1ρ sequence, with a total acquisition time approximately 11 minutes. The T2 quantification was acquired subsequently and covered the same region as the T1ρ sequence.
Plain Radiographic and Clinical Diagnostic MR Images Assessment
All radiographs and clinical MR images (SPGR, T1- and T2-weighted fat saturated sequences) were reviewed by a radiologist (T.M.L). The radiographic findings were scored according to the Kellgren-Lawrence (KL) scale, which is a standard grading system for OA 26,27. Osteophytes at the joint margins, narrowing of joint spaces and subchondral sclerosis have been considered as radiological features of OA. Based on these features, the following KL scores were defined 28: 0, no features of OA; 1, doubtful OA, with minute osteophytes of doubtful importance; 2, minimal OA, with definite osteophytes but unimpaired joint space; 3, moderate OA, with osteophytes and moderate diminution of joint space; and 4, severe OA, with greatly impaired joint space and sclerosis of subchondral bone.
The MR images were analyzed regarding cartilage lesions, joint effusion, popliteal cysts, ligaments and menisci. Additional features included reactive bone marrow changes, osteophytes, subchondral cysts and loose bodies. Five compartments were defined in each subject: patella, medial femoral condyle (MFC), lateral femoral condyle (LFC), medial tibia (MT) and lateral tibia (LT). Cartilage thinning was defined in each of the compartments based on T2-weighted FSE and T1-weighted SPGR images as: 0, no obvious thinning; 1, <50% thinning; 2, >50% thinning; and 3, full thickness loss of cartilage. Each patient was given an overall grade based on the most severe cartilage lesion in each of the five compartments. The bone marrow edema pattern was defined as high signal intensity in the T2-weighted fat-saturated FSE images and graded as: 0, no obvious BME; 1, mild edema with less than 1 cm diameter in the long axis; 2, moderate edema with diameter between 1 and 3 cm in the long axis; 3, severe edema with diameter larger than 3 cm in the long axis. Osteophytes were classified as: 0, no obvious osteophytes; 1, mild when they were located in the joint margins and were less than 0.5 cm in diameter; 2, severe when osteophytes were larger than 0.5 cm in diameter.
MR Images Post-processing
MR images were transferred to a Sun workstation (Sun Microsystems, Palo Alto, CA) for off-line quantification of cartilage volume and thickness, and quantification of T1ρ and T2 relaxation times.
Cartilage was segmented semi-automatically in sagittal SPGR images using an in-house developed program with MATLAB based on edge detection and Bezier splines 29. Five compartments were defined as mentioned above in each subject: patella, MFC, LFC, MT and LT. An iterative minimization process was used to calculate total cartilage volume and average thickness for each region. Following segmentation, a medial line was generated in each region of cartilage. The cartilage thickness was determined by calculating the minimum distance from each point on the medial line to a cartilage boundary. The average thickness was calculated for each slice and then averaged for all the slices. The cartilage volume was determined by multiplying the total number of voxels encompassing the cartilage by the volume of each voxel. The root mean square CV for intra-observer reproducibility of this algorithm was between 2.4%–3.69% as reported previously 30. Finally to minimize volumetric variations due to the size of the knee, the cartilage volume was normalized by the epicondylar distance determined from axial SPGR images.
The T1ρ map was reconstructed by fitting the image intensity pixel-by-pixel to the equation below using a Levenberg-Marquardt mono-exponential fitting algorithm developed in-house:
T1ρ-weighted images with the shortest TSL (therefore with highest SNR) were rigidly registered to high-resolution T1-weighted SPGR images acquired in the same exam using the VTK CISG Registration Toolkit 31. The transformation matrix was applied to the reconstructed T1ρ map. Different regions of the knee cartilage: patellar, trochlea, medial and lateral compartments were segmented automatically based on axial high-resolution SPGR images using the same algorithm used for sagittal segmentation. The segmentation was corrected manually to avoid synovial fluid or other surrounding tissue. 3D cartilage contours were generated and overlaid on the registered T1ρ map. Similarly, The T2 map was reconstructed by fitting the image intensity pixel-by-pixel to the equation S(TE)∝ exp(−TE/T2). T2-weighted images with the shortest TE were rigidly registered to SPGR images, and the transformation matrix was applied to T2 maps using the VTK CISG Registration Toolkit. The cartilage contours generated previously from SPGR images were also overlaid on the registered T2 map. To reduce artifacts caused by partial volume effects with synovial fluid, regions with relaxation time greater than 150 ms in T1ρ or T2 maps were manually removed from the data used for quantification.
Statistical Analysis
A non-parametric rank test was used to compare volume, average thickness, average T1ρ and T2 values between control subjects and OA patients. A Spearman rank correlation was performed to study the relationship between average T1ρ and T2 values, between these relaxation times and ages, and between these relaxation times and cartilage thickness and volumes. The effect size was calculated to compare the discrimination power of T1ρ and T2 values using equation below:
where Δ mean is the mean difference between control and OA, and SD is the pooled standard deviation of these two groups defined as:
Where n1 and n2 are the sample size of these two groups respectively, and SD1 and SD2 are the standard deviation of these two groups respectively.
RESULTS
T1ρ and T2 Quantification for Control Subjects and OA Patients
The average T1ρ values were significantly higher in OA subjects compared with healthy controls (52.04 ± 2.97 ms versus 45.53 ± 3.28 ms, P = 0.0002), as shown in Table 1. The average T2 values were also increased significantly in patients with OA (39.63 ± 2.69 ms versus 34.74 ± 2.48 ms, P = 0.001, Table 1). Figure 1 shows T1ρ and T2 maps for a healthy control. Figure 2 and Figure 3 present T1ρ and T2 maps of a patient with mild OA with KL score = 1, and a patient with advanced OA with KL score = 4, respectively. The average T1ρ and T2 values correlated significantly (R2 = 86.0%, P < 0.0001). T1ρ values had a higher effect size than T2 values (3.7 versus 3.0), indicating T1ρ may be more sensitive than T2 for distinguishing OA from controls.
Table 1.
Radiological findings based on radiographs and anatomic MR images
| Patient ID | KL Score | Cartilage thinning | Osteophytes | BME | ||||||
|---|---|---|---|---|---|---|---|---|---|---|
| MFC | LFC | MT | LT | P | F-T | F-P | Center | |||
| 1 | 2 | 1 | 0 | 0 | 0 | 2 | 1 | 1 | 0 | 0 |
| 2 | 1 | 1 | 1 | 0 | 0 | 0 | 1 | 1 | 0 | 0 |
| 3 | 2 | 0 | 1 | 0 | 1 | 1 | 1 | 1 | 1 | 2 |
| 4 | 3 | 2 | 0 | 2 | 0 | 2 | 2 | 2 | 1 | 2 |
| 5 | 3 | 3 | 0 | 3 | 0 | 2 | 1 | 1 | 0 | 2 |
| 6 | 1 | 1 | 0 | 0 | 0 | 1 | 1 | 1 | 0 | 3 |
| 7 | 4 | 3 | 2 | 3 | 2 | 3 | 2 | 1 | 1 | 2 |
| 8 | 3 | 2 | 3 | 2 | 2 | 3 | 1 | 1 | 0 | 2 |
| 9 | 2 | 0 | 0 | 0 | 0 | 0 | 0 | 1 | 0 | 0 |
| 10 | 4 | 3 | 0 | 3 | 0 | 1 | 3 | 2 | 0 | 2 |
MFC: medial femoral condyle; LFC: lateral femoral condyle, MT: medial tibia; LT: lateral tibia; P: patella; F-T: femoral-tibial joint; F-P: femoral-patellar joint; BME: bone marrow edema.
Cartilage thinning grading: 1, <50% thinning; 2, >50% thinning; and 3, full thinning (loss) of cartilage.
Bone marrow edema grading: 0, no obvious BME; 1, mild edema with less than 1 cm diameter in the long axis; 2, moderate edema with diameter between 1 and 3 cm in the long axis; 3, severe edema with diameter larger than 3 cm in the long axis.
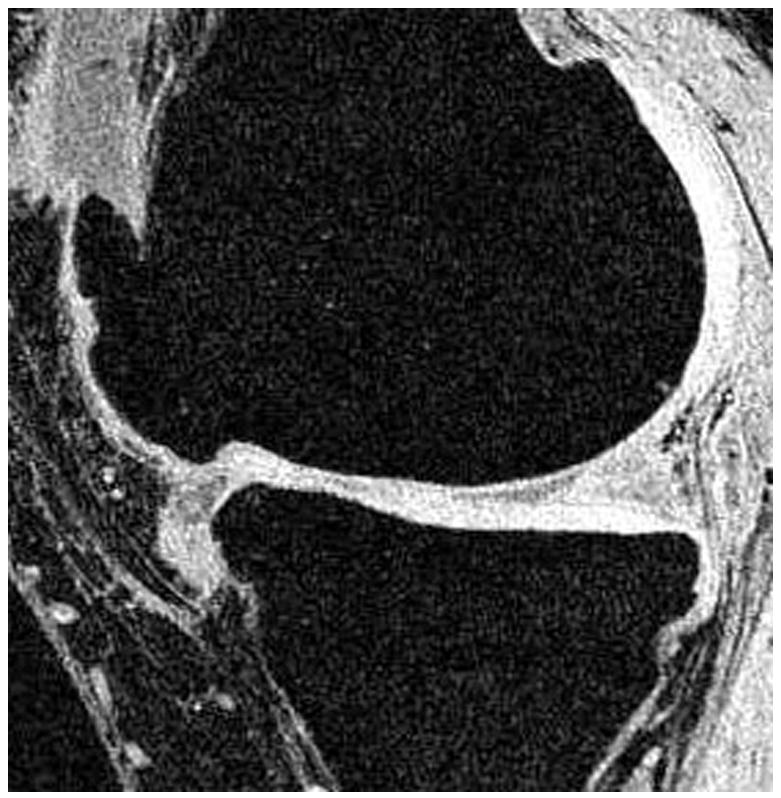
Figure 1.
T1-weighted water excitation SPGR image (a), T1ρ map (b) and T2 map (c) for a healthy control (male, 30). No radiographs were obtained, as the subject is a healthy asymptomatic control. No cartilage thinning, osteophytes and other OA symptoms were seen in MR images. The average T1ρ value was 40.1 ± 11.4 ms and the average T2 value was 33.3 ± 10.5 ms in cartilage.
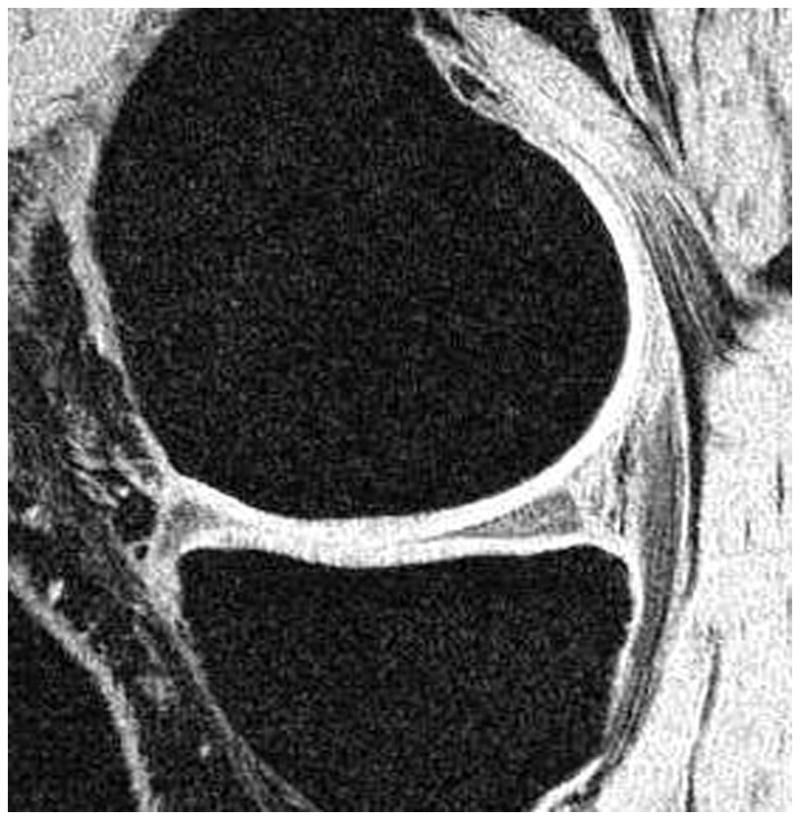
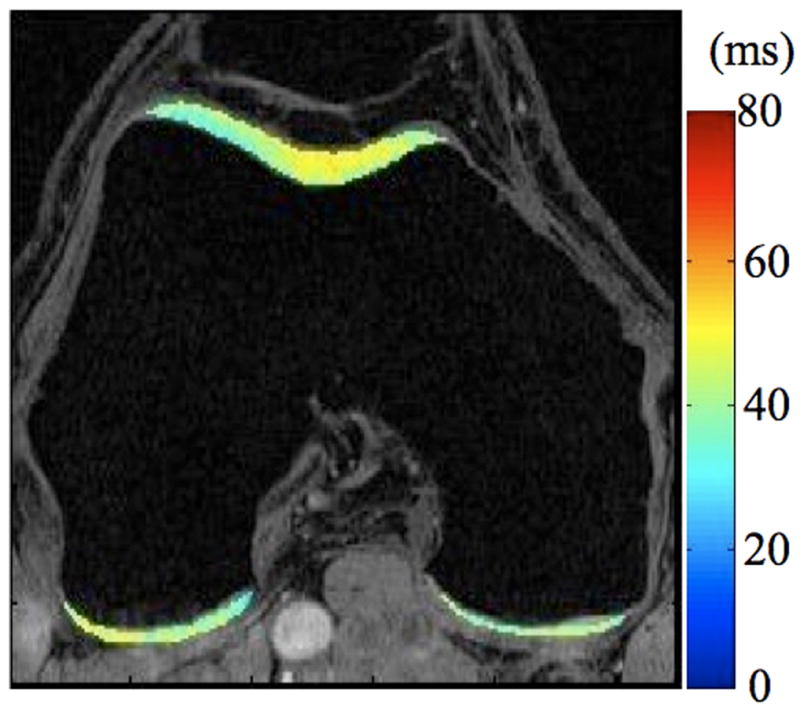
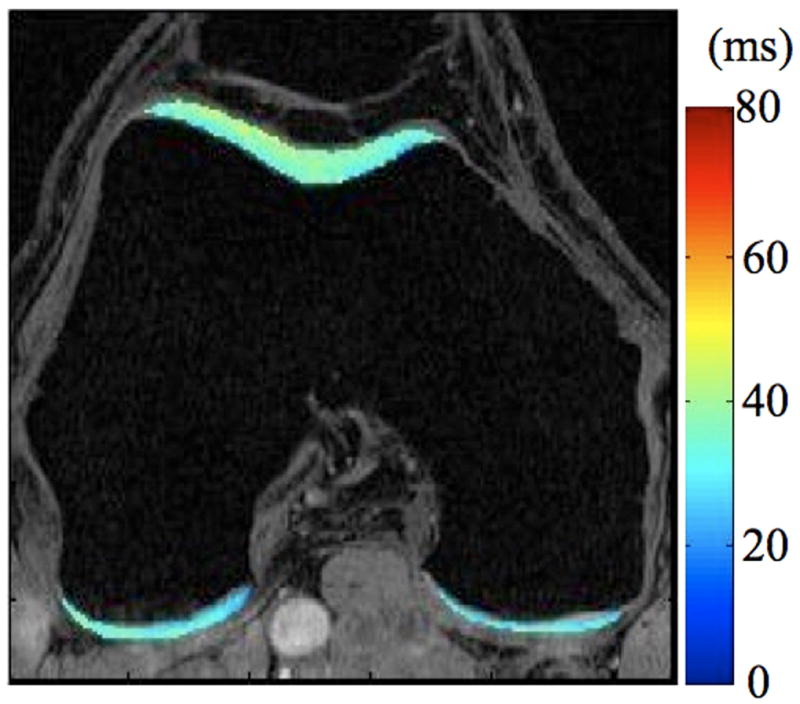
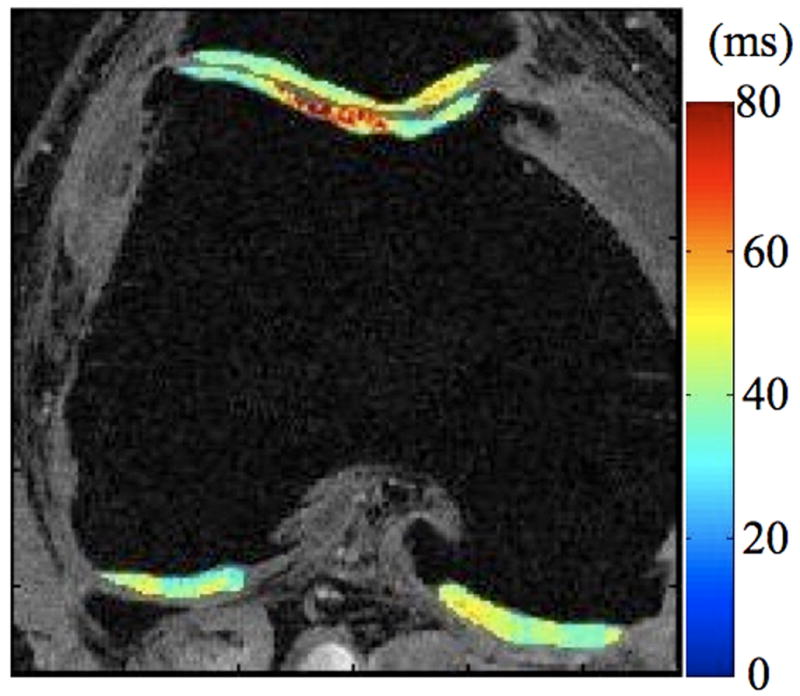
Figure 2.
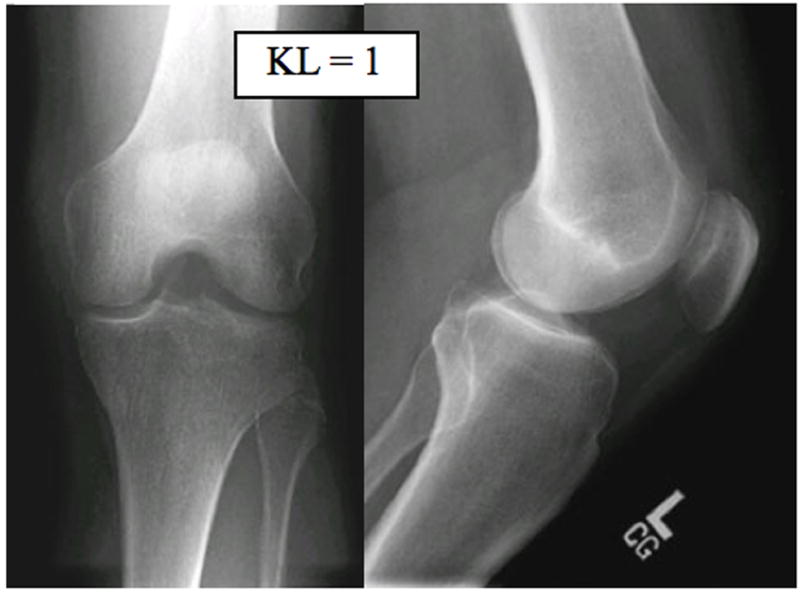
Radiographs (a), T1-weighted water excitation SPGR image (b), T1ρ map (c) and T2 map (d) for a patient with mild OA (male, 66). From radiographs, no significant joint space narrowing was seen, but minimal osteophytes were observed in femoro-tibial joint and minimal to mild osteophytes were observed in femoro-patellar joint, resulting in a KL score as 1. From MR images, minimal osteophytes were also seen in femoro-tibial and femoro-patellar joints. The cartilage in medial femur and femoro-patellar compartment had grade 1 thinning. The average T1ρ value was 45.5 ± 14.5 ms and the average T2 value was 35.0 ± 10.9 ms in cartilage.
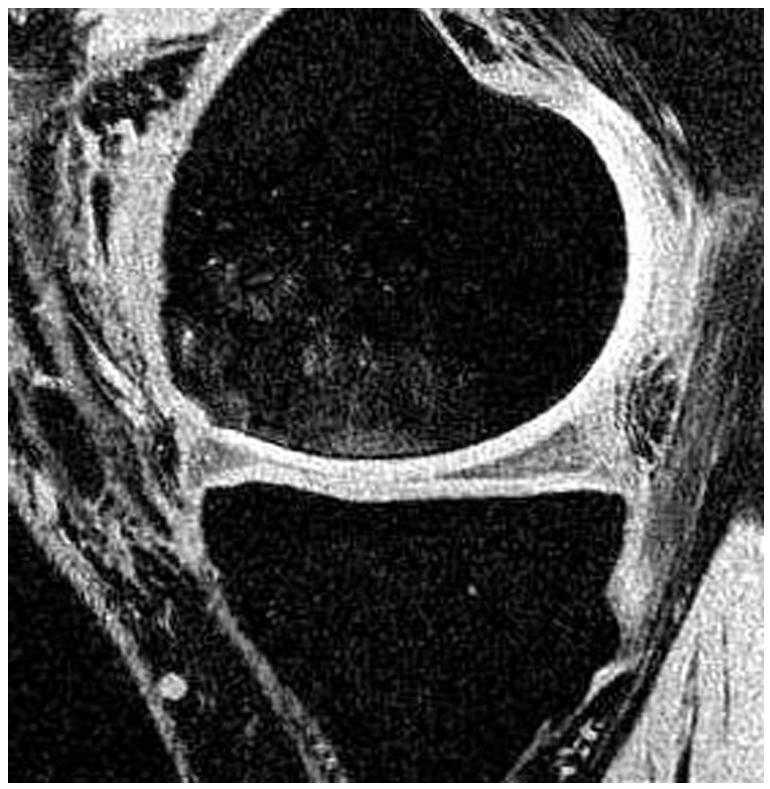
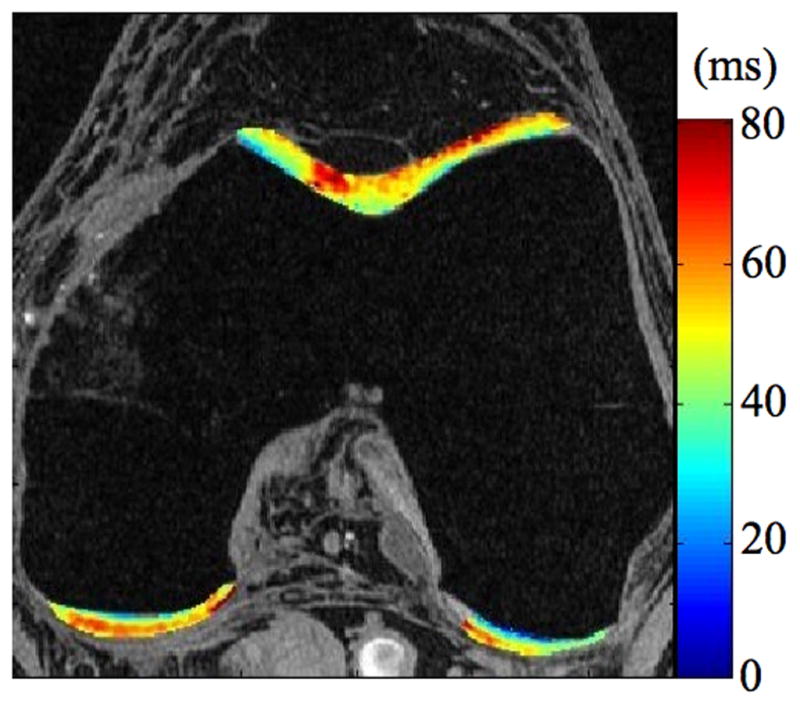
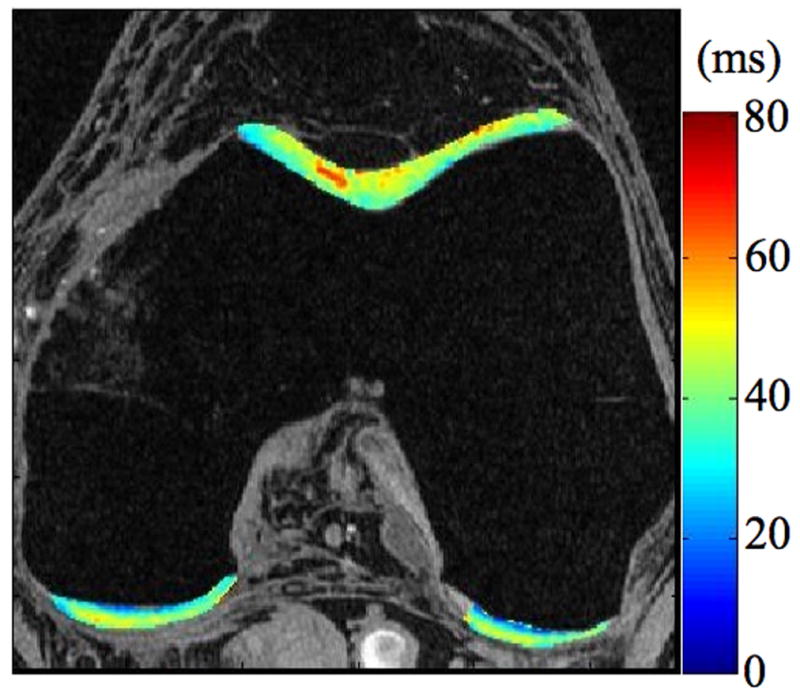
Figure 3.
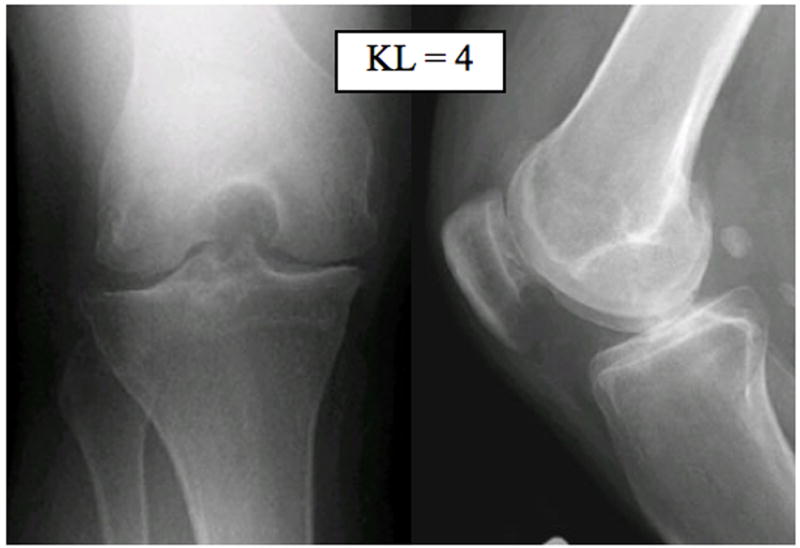
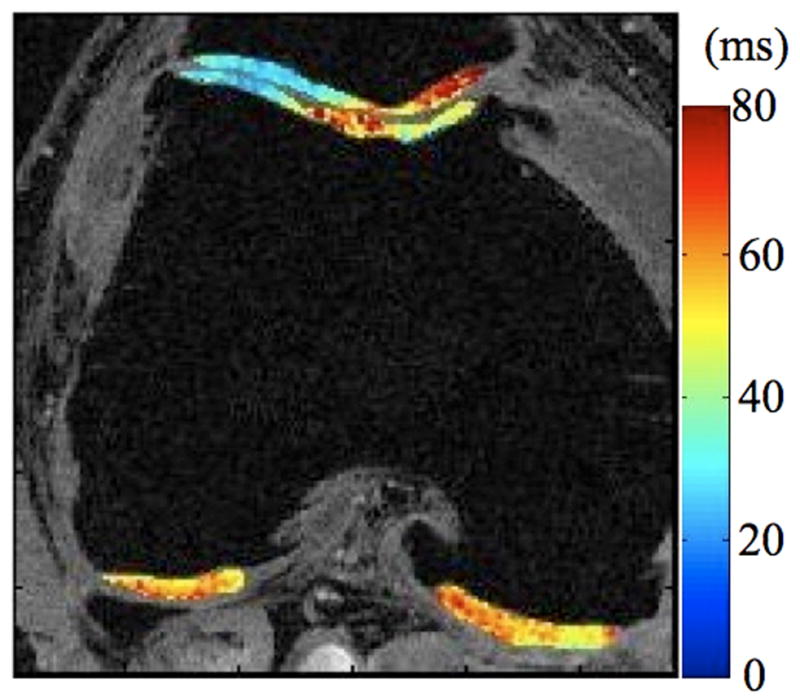
Radiographs (a), T1-weighted water excitation SPGR image (b), T1ρ map (c) and T2 map (d) for a patient with advanced OA (male, 46). Based on radiographs, the patient had joint space narrowing with 1 mm in medial compartment and 3 mm in lateral compartment, and significant osteophytes in both femoro-tibial and femoro-patellar joints, resulting in a KL score as 4. In MR images, significant osteophytes were seen in both femoro-tibial and femoro-patellar joints. The cartilage had a grade 3 thinning in medial femur, medial tibia and femoro-patellar compartments, and grade 2 thinning in lateral femur and lateral tibia compartments. The average T1ρ value was 55.4 ± 26.0 ms and the average T2 value was 43.8 ± 11.1 ms in cartilage.
The average T1ρ values increased with age in the 16 healthy controls, with a significant but moderate correlation (R2 = 58.3%, P = 0.018), as shown in Figure 4. In the ten controls who also had T2 quantification, T2 values also increased with ages, but the correlation was not significant (R2 = 41.5%, P = 0.233).
Figure 4.
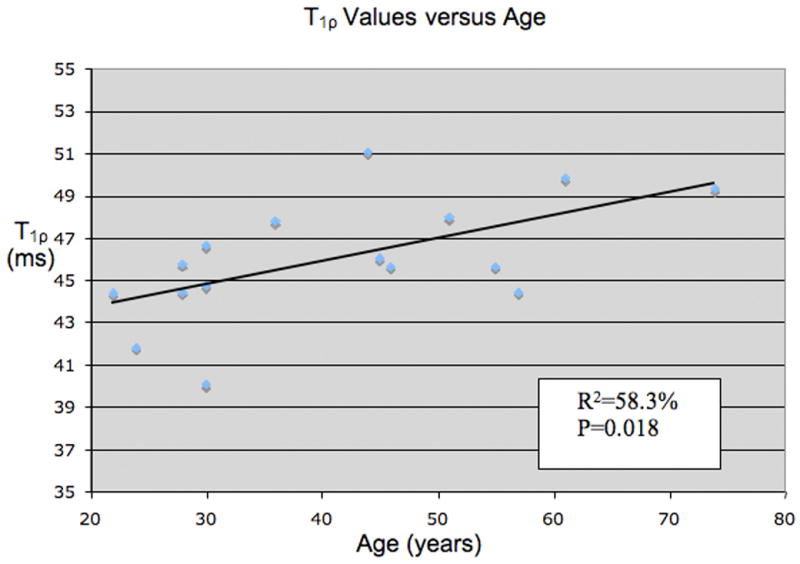
Distribution of T1ρ values versus age in healthy volunteers. The correlation is moderate but significant with R2=58.3% and P=0.018.
KL Scores and MR Findings Based on Anatomic MR Images
Based on radiographs, two patients had a KL score = 1, three had a KL score = 2, three had a KL score = 3 and two had a KL score = 4. Cartilage lesions were classified as grade 0 for one patient, 1 for three patients, 2 for two patients and 3 for four patients. Table 2 illustrates the main findings based on radiographs and clinical MR images for the 10 patients, including KL score, cartilage lesion grade in each compartment, osteophytes in the femoro-tibial joint, femoro-patellar joint and the joint center, as well as bone marrow edema. Among the ten OA patients, six patients had more severe cartilage lesions at the medial compartments than at the lateral compartments, two had more severe lesions at the lateral compartments, and two had the same lesion grade at both compartments.
Table 2(a).
Cartilage thickness (in mm, mean ± SD) in each compartment
| Patellar | MFC | LFC | Medial tibia | Lateral tibia | |
|---|---|---|---|---|---|
| Controls | 2.17±0.62 | 1.51±0.35 | 1.51±0.38 | 1.23±0.49 | 1.88±0.28 |
| OA patients | 2.04±0.53 | 1.65±0.20 | 1.86±0.40 | 1.51±0.26 | 1.94±0.49 |
There were no significant difference in the total volume and average thickness of cartilage in OA patients and control subjects (1.53 ± 0.42 cm3/cm versus 1.27 ± 0.29 cm3/cm for volume normalized by epicondyle length, and 1.78 ± 0.31 mm versus 1.65 ± 0.32 mm for thickness), (P = 0.13 and P = 0.37 respectively). Table 3 presents the mean and SD of cartilage volumes and thickness in each compartments for control subjects and OA patients. There were no significant differences in either cartilage volume or thickness for any compartment between these two groups.
Table 3.
T1ρ and T2 values (in ms, mean ± SD) in healthy controls and osteoarthritic subjects.
| Controls | OA | P value | Effect size | |
|---|---|---|---|---|
| T1ρ | 45.53 ± 3.28 | 52.04 ± 2.97 | 0.0002 | 3.7 |
| T2 | 34.74 ± 2.48 | 39.63 ± 2.69 | 0.001 | 3.0 |
Relationship between Radiological Findings and T1ρ and T2 Quantification
The average T1ρ value increased as KL score increased based on radiographs, with 45.5 ± 3.3 ms, 47.6 ± 3.0 ms, 51.8 ± 0.7 ms, 52.4 ± 0.2 ms and 55.6 ± 0.4 ms for KL = 0 (healthy controls), 1, 2, 3, 4 respectively, Table 4(a). The same trend was found between average T2 values and KL scores, with T2 values of 34.7 ± 2.5 ms for grade 0, 35.9 ± 1.4 ms for grade 1, 39.8 ± 2.4 ms for grade 2, 39.6 ± 0.3 ms for grade 3 and 43.0 ± 1.0 ms for grade 4, as shown in Table 4(a).
Table 4(a).
T1ρ and T2 values (in ms, mean ± SD) in subjects versus KL scores evaluated on plain radiographs
| KL score | 0 (n=10) | I (n=2) | II (n=3) | III (n=3) | IV (n=2) |
|---|---|---|---|---|---|
| T1ρ | 45.5±3.3 | 47.6±3.0 | 51.8±0.7 | 52.9±0.9 | 55.6±0.4 |
| T2 | 34.7±2.5 | 35.9±1.4 | 39.8±2.4 | 40.0±0.2 | 43.0±1.0 |
The average T1ρ and T2 values increased as the overall cartilage lesion grades increased from 0 to 3 based (from 46.1 ± 3.6 to 54.4 ± 1.5 ms for T1ρ, and from 35.0 ± 2.5 ms to 41.4 ± 2.0 ms for T2 as presented in Table 4(b). No significant correlation was found between T1ρ and T2 values and cartilage volumes and thickness (P > 0.05).
Table 4(b).
T1ρ and T2 values (in ms, mean ± SD) in subjects versus cartilage thinning grades evaluated on MR images
| Cartilage thinning grading | 0 (n=11) | I (n=3) | II (n=2) | III (n=4) |
|---|---|---|---|---|
| T1ρ | 46.1±3.6 | 48.9±3.0 | 52.4±0.2 | 54.4±1.5 |
| T2 | 35.0±2.5 | 37.7±3.1 | 40.3±1.3 | 41.4±2.0 |
Based on the cartilage lesion grading, we regrouped the 50 compartments for the 10 OA patients into two groups: mild OA with grades 0 and 1, and advanced OA with grades 2 and 3. The average T1ρ values were significantly increased in compartments with advanced OA compared with the ones with mild OA (54.3 ± 6.1 ms versus 48.4 ± 5.6 ms, P = 0.0012). The increase in percentage was 12.2%. The T2 values were also elevated in the compartments with advanced OA (41.0 ± 4.5 ms versus 38.0 ± 4.8 ms, P = 0.030), but with an increased percentage of only 7.9%.
DISCUSSION
In this study, we have demonstrated that both T1ρ and T2 cartilage values were significantly increased in patients with OA when compared with healthy controls. T1ρ and T2 values also increased with more severe radiographic OA and MR grades of cartilage degeneration.
Increased T2 values were reported previously in degenerated cartilage in both animal models and in human subjects 7,10,32. The values obtained in our study are consistent with the reported values, with a range from 31.3 ms to 38.7 ms for healthy controls and 35.0 ms to 43.8 ms for patients with OA. In an effort to correlate the T2 relaxation times with biochemical changes in cartilage, previous in vitro studies have reported that T2 correlated poorly with PG content 33,34, and PG cleavage did not affect T2 values significantly 35. Instead, T2 can be affected mainly by collagen content and orientation and/or water content 11,36. It has been observed that loss of proteoglycan is an initiating event in early OA, while neither the content nor the type of collagen is altered in early OA 5. Therefore lack of specificity to quantify proteoglycan loss may make T2 less appealing for early detection of cartilage degeneration. In addition, the angular dependency of T2 values with respect to the external magnetic field B0 have made it difficult to define a ‘normal’ appearance of T2 maps. As a result, it is difficult to apply T2 values to quantify cartilage degeneration longitudinally, and the clinical results obtained with T2 quantification remain inconclusive. This angular dependency, however, as shown in an in vitro study using high field (8.6T) microscopic MRI (μMRI), can provide specific information about the collagen ultra-structure 37.
T1ρ has been recently proposed as an attractive alternative to evaluate biochemical changes in cartilage matrix non-invasively. T1ρ relaxation rate (1/T1ρ) has been shown to decrease linearly with decreasing PG content in ex vivo bovine patellae 11 and has been proposed as a more specific indicator of PG content than T2 relaxation in trypsinized cartilage 33 and in human cartilage specimens obtained from patients with severe OA who underwent total knee replacement 38. Makela et al. 14 and Duvvuri et al. 39 have suggested that proton exchange between chemically shifted NH and OH groups of proteoglycan and the tissue water could be an important relaxation mechanism contributing to T1ρ relaxation. Therefore T1ρ may be specific to changes of proteoglycan in cartilage matrix during early stages of OA. Furthermore, T1ρ relaxation times do not seem to be affected by the orientation of collagen that can affect T2 relaxation techniques 40. Preliminary in vivo studies have also shown increased cartilage T1ρ values for patients with OA versus healthy controls 17–19 Our results also suggested that the mean T1ρ values exhibit similar changes with age as seen in previous studies on T2 relaxation times 7,41.
The results of our comparison study demonstrated that both T1ρ and T2 techniques can be sensitive to cartilage degeneration. However, there is a larger range and effect size for T1ρ versus T2 values, which may indicate a more sensitive method of detecting cartilage degeneration. Furthermore, although there is a significant correlation between the average T1ρ and T2 values, the spatial distribution of the elevation of these two parameters can be different in OA patients, as clearly seen in Figure 3. We will investigate in the spatial correlation between T1ρ and T2 values in future studies. We believe that since T1ρ and T2 represent two relaxation mechanisms in tissues, they may provide complementary information on cartilage degeneration. Combining this information may enhance our ability to detect early cartilage degeneration, as well as to distinguish between different stages of degeneration.
In this study, T1ρ and T2 increased with KL scores based on radiographs and overall cartilage lesion grade based on analysis of clinical MR sequences. However, due to the small sample size, we could not test the statistical significance of this correlation. In a previous study correlating in vivo T2 values and OA disease severity as defined by KL scores, Dunn et al. 10 showed that the T2 values were elevated significantly in mild OA (KL=1,2, n=20) compared with healthy controls. Although there was an increasing trend of T2 values from mild OA to severe OA (KL=3,4, n=28), this difference was not significant. The authors proposed that with the limitations by KL grading system, in particular the emphasis on the presence of osteophytes, significant changes in T2 values for cartilage with different KL scores are not necessarily expected. Interestingly in this study, significant differences were observed in both T1ρ and T2 values between mild OA compartments (with cartilage thinning grade 0 and 1) and advanced OA compartments (with cartilage thinning grade 2 and 3) after we regrouped all 50 compartments according to cartilage lesion grade.
Furthermore, among the patients with cartilage thinning observed in MR images (grade >= 1), six had ‘spared’ compartments with cartilage thinning grade 0 on the clinical MR images. The average T1ρ and T2 values for these ‘spared’ compartments were 50.8 ± 5.4 ms and 39.4 ± 3.8 ms respectively. These values were significantly higher than those found in cartilage of healthy controls (P = 0.029 and P = 0.004 for T1ρ and T2 respectively). These results suggest that cartilage degeneration, or the biochemical change, can take place in these compartments even if no morphologic changes are yet visualized.
In this study, we did not find a significant difference in cartilage volume or thickness between the healthy control and OA groups. We attribute the lack of volumetric differences to the fact that early osteoarthritic patients with less structural cartilage wear were examined and to the varying severity of OA in the diseased group. The cartilage volume and thickness was slightly higher in the osteoarthritic subjects. This may due to the increase of water content and consequently swelling of cartilage in the early stages of OA. One example of segmented cartilage in medial compartments in a control (male, 30) versus an OA patient (male, 66) is shown in Figure 5. Our findings also indicate that physical measures such as cartilage thickness and volume may lag behind biochemical and molecular changes which can be measured quantitatively with T1ρ and T2 values.
Figure 5.
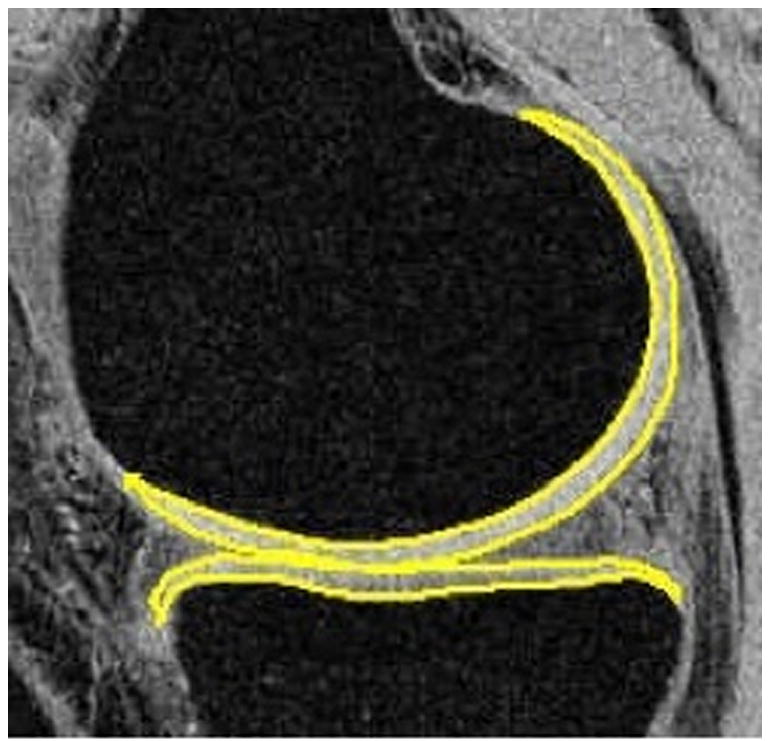
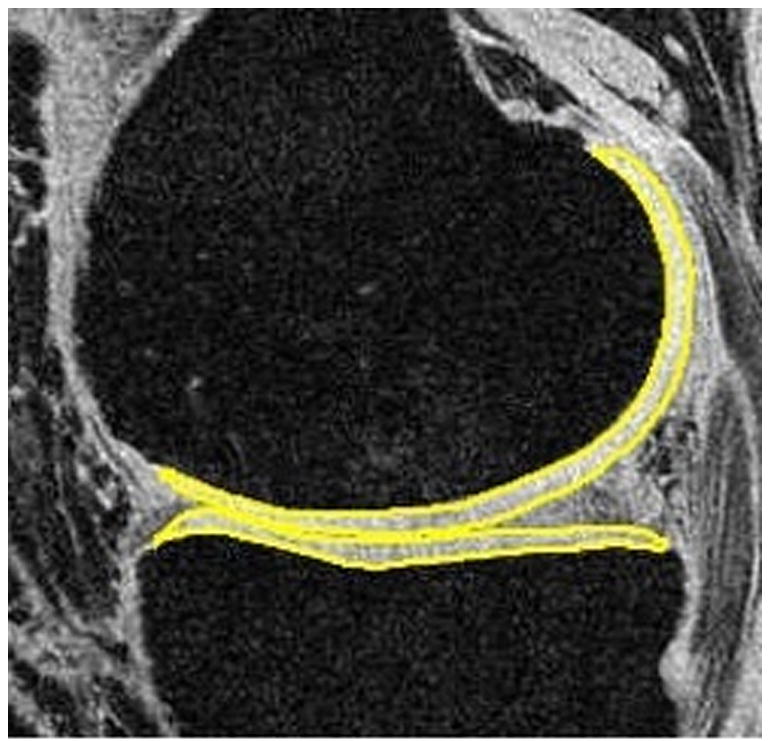
Segmented femoral and tibial cartilage in medial compartments of a healthy control (a, male, 30) and an OA patient (b, male, 66). The average thickness (in mm) is 1.68 vs. 1.84 (control vs. OA) in medial femoral condyle (MFC), and 1.63 vs. 1.71 (control vs OA) in medial tibia (MT). The volume (normalized by epicondylar length, in cm^3/cm) is 0.31 vs. 0.35 (control vs OA) in MFC, and 0.20 vs. 0.19 (control vs OA) in MT. The slightly increased cartilage volume and thickness may due to the increase of water content and consequently swelling of cartilage in the early stages of OA.
T1ρ and T2 imaging are a few techniques that have shown the potential of MR imaging to reflect changes in the biochemical composition of cartilage with early OA. Other techniques, including sodium 23 (23Na) MRI 42,43 and delayed gadolinium enhanced MRI of cartilage (dGEMRIC) 44–46 have also shown promising results in imaging cartilage biochemistry. All of these techniques are complementary to standardized cartilage sensitive images and may provide information about cartilage changes (either proteoglycan or collagen) that may exist prior to structural changes in cartilage thickness or surface morphology. However, some of the techniques may have requirements that can limit their clinical use. The dGEMRIC technique, which has been validated in multiple studies to allow assessment of the proteoglycan component of articular cartilage, requires a several hour wait after either an intraveneous or intraarticular injection of the contrast agent (Gd-DPTA) for effective penetration. 23Na MR imaging, which uses sodium concentrations as a marker for proteoglycan loss, is of limited clinical use because of the inherent low sensitivity of sodium signal and the limited availability of sodium MRI (requires special coils and hardware).
T1ρ and T2 mapping does not require the use of special hardware, coils or contrast. Our study was implemented on a 3T MR scanner because of the advantages afforded by using a higher field strength (such as increased signal to noise ratio and higher resolution), but T1ρ-weighted MR images can be easily obtained on more readily available 1.5 T scanners 47.
A potential limitation of this study was that average T1ρ and T2 values were quantified within the entire cartilage surface or in a specific compartment of the knee. Mosher et al. has developed techniques examining the spatial variation of T2 within cartilage and reported changes in different layers with age and with cartilage degeneration 48. It may be helpful to further investigate the spatial variation of T1ρ in different layers and compare it with that of T2 values in both healthy controls and osteoarthritic subjects to better localize areas of cartilage degeneration.
In conclusion, in vivo T1ρ and T2 mapping techniques have demonstrated feasibility in detecting cartilage degeneration. Quantitative cartilage imaging may enhance our ability to detect subtle, early matrix changes associated with cartilage injuries when used in conjunction with standardized cartilage sensitive imaging. We are currently investigating the ability of quantitative imaging to detect cartilage injuries associated with ligament tears 49. Development of non-invasive methods to assess early cartilage matrix changes is potentially important to initiate early treatment, monitor disease progression and to follow-up operative cartilage repair and resurfacing.
Table 2(b).
Cartilage volume (normalized by epicondylar length, in cm^3/cm, mean ± SD) in each compartment
| Patellar | MFC | LFC | Medial tibia | Lateral tibia | |
|---|---|---|---|---|---|
| Controls | 0.23±0.07 | 0.27±0.05 | 0.43±0.14 | 0.15±0.04 | 0.19±0.04 |
| OA patients | 0.33±0.15 | 0.33±0.13 | 0.49±0.21 | 0.18±0.05 | 0.21±0.09 |
Acknowledgments
The authors would like to thank Dr. Robert Stahl for his help with radiograph data. The research was supported by NIH RO1 AG17762, RO1 AR46905 and K25 AR053633.
Footnotes
Publisher's Disclaimer: This is a PDF file of an unedited manuscript that has been accepted for publication. As a service to our customers we are providing this early version of the manuscript. The manuscript will undergo copyediting, typesetting, and review of the resulting proof before it is published in its final citable form. Please note that during the production process errors may be discovered which could affect the content, and all legal disclaimers that apply to the journal pertain.
References
- 1.Brandt KD, Doherty M, Lohmander LS, editors. Osteoarthritis. New York: Oxford University Press Inc; 1998. [Google Scholar]
- 2.Rogers J, Watt Dieppe P. A comparison of the visual and radiographic detection of bony changes at the knee joint. BMJ. 1990;300:367–368. doi: 10.1136/bmj.300.6721.367. [DOI] [PMC free article] [PubMed] [Google Scholar]
- 3.Chan WP, Lang P, Stevens MP, Sack K, Majumdar S, Stoller DW, et al. Osteoarthritis of the knee: comparison of radiography, CT, and MR imaging to assess extent and severity. Ajr Am J Roentgenol. 1991;157(4):799–806. doi: 10.2214/ajr.157.4.1892040. [DOI] [PubMed] [Google Scholar]
- 4.Gray ML, Eckstein F, Peterfy C, Dahlberg L, Kim YJ, Sorensen AG. Toward imaging biomarkers for osteoarthritis. Clin Orthop Relat Res. 2004;(427)(Suppl):S175–181. doi: 10.1097/01.blo.0000144972.50849.d9. [DOI] [PubMed] [Google Scholar]
- 5.Dijkgraaf LC, de Bont LG, Boering G, Liem RS. The structure, biochemistry, and metabolism of osteoarthritic cartilage: a review of the literature. J Oral Maxillofac Surg. 1995;53(10):1182–1192. doi: 10.1016/0278-2391(95)90632-0. [DOI] [PubMed] [Google Scholar]
- 6.Xia Y, Farquhar T, Burton-Wuster N, Ray E, Jelinski L. Difiusion and relaxation mapping of cartilage-bone plugs and excised disks using microscopic magnetic resonance imaging. Magn Reson Med. 1994;31:273–282. doi: 10.1002/mrm.1910310306. [DOI] [PubMed] [Google Scholar]
- 7.Mosher TJ, Dardzinski BJ, Smith MB. Human articular cartilage: influence of aging and early symptomatic degeneration on the spatial variation of T2--preliminary findings at 3 T. Radiology. 2000;214(1):259–266. doi: 10.1148/radiology.214.1.r00ja15259. [DOI] [PubMed] [Google Scholar]
- 8.Dardzinski BJ, Laor T, Schmithorst VJ, Klosterman L, Graham TB. Mapping T2 relaxation time in the pediatric knee: feasibility with a clinical 1.5-T MR imaging system. Radiology. 2002;225(1):233–239. doi: 10.1148/radiol.2251011461. [DOI] [PubMed] [Google Scholar]
- 9.David-Vaudey E, Ghosh S, Ries M, Majumdar S. T2 relaxation time measurements in osteoarthritis. Magn Reson Imaging. 2004;22(5):673–682. doi: 10.1016/j.mri.2004.01.071. [DOI] [PubMed] [Google Scholar]
- 10.Dunn TC, Lu Y, Jin H, Ries MD, Majumdar S. T2 relaxation time of cartilage at MR imaging: comparison with severity of knee osteoarthritis. Radiology. 2004;232(2):592–598. doi: 10.1148/radiol.2322030976. [DOI] [PMC free article] [PubMed] [Google Scholar]
- 11.Duvvuri U, Reddy R, Patel SD, Kaufman JH, Kneeland JB, Leigh JS. T1rho-relaxation in articular cartilage: effects of enzymatic degradation. Magn Reson Med. 1997;38(6):863–867. doi: 10.1002/mrm.1910380602. [DOI] [PubMed] [Google Scholar]
- 12.Nugent AC, Johnson GA. T1rho imaging using magnetization-prepared projection encoding (MaPPE) Magn Reson Med. 2000;43(3):421–428. doi: 10.1002/(sici)1522-2594(200003)43:3<421::aid-mrm14>3.0.co;2-x. [DOI] [PubMed] [Google Scholar]
- 13.Akella SV, Regatte RR, Gougoutas AJ, Borthakur A, Shapiro EM, Kneeland JB, et al. Proteoglycan-induced changes in T1rho-relaxation of articular cartilage at 4T. Magn Reson Med. 2001;46(3):419–423. doi: 10.1002/mrm.1208. [DOI] [PubMed] [Google Scholar]
- 14.Makela HI, Grohn OH, Kettunen MI, Kauppinen RA. Proton exchange as a relaxation mechanism for T1 in the rotating frame in native and immobilized protein solutions. Biochem Biophys Res Commun. 2001;289(4):813–818. doi: 10.1006/bbrc.2001.6058. [DOI] [PubMed] [Google Scholar]
- 15.Mlynarik V, Szomolanyi P, Toffanin R, Vittur F, Trattnig S. Transverse relaxation mechanisms in articular cartilage. J Magn Reson. 2004;169(2):300–307. doi: 10.1016/j.jmr.2004.05.003. [DOI] [PubMed] [Google Scholar]
- 16.Redfield AG. Nucclear Spin Thermodynamics in the Rotating Frame. Science. 1969;164:1015–1023. doi: 10.1126/science.164.3883.1015. [DOI] [PubMed] [Google Scholar]
- 17.Duvvuri U, Charagundla SR, Kudchodkar SB, Kaufman JH, Kneeland JB, Rizi R, et al. Human knee: in vivo T1(rho)-weighted MR imaging at 1.5 T--preliminary experience. Radiology. 2001;220(3):822–826. doi: 10.1148/radiol.2203001662. [DOI] [PubMed] [Google Scholar]
- 18.Regatte RR, Akella SV, Wheaton AJ, Lech G, Borthakur A, Kneeland JB, et al. 3D-T1rho-relaxation mapping of articular cartilage: in vivo assessment of early degenerative changes in symptomatic osteoarthritic subjects. Acad Radiol. 2004;11(7):741–749. doi: 10.1016/j.acra.2004.03.051. [DOI] [PubMed] [Google Scholar]
- 19.Li X, Han E, Ma C, Link T, Newitt D, Majumdar S. In vivo 3T spiral imaging based multi-slice T(1rho) mapping of knee cartilage in osteoarthritis. Magnetic resonance in medicine Magnetic resonance in medicine. 2005;54(4):929–936. doi: 10.1002/mrm.20609. [DOI] [PubMed] [Google Scholar]
- 20.Hangody L, Fules P. Autologous osteochondral mosaicplasty for the treatment of full-thickness defects of weight-bearing joints: ten years of experimental and clinical experience. J Bone Joint Surg Am. 2003;85-A(Suppl 2):25–32. doi: 10.2106/00004623-200300002-00004. [DOI] [PubMed] [Google Scholar]
- 21.Steadman J, Briggs K, Rodrigo J, Kocher M, Gill T, Rodkey W. Outcomes of microfracture for traumatic chondral defects of the knee: average 11-year follow-up. Arthroscopy. 2003;19(5):477–484. doi: 10.1053/jars.2003.50112. [DOI] [PubMed] [Google Scholar]
- 22.Knutsen G, Engebretsen L, Ludvigsen T, Drogset J, Grontvedt T, Solheim E, et al. Autologous chondrocyte implantation compared with microfracture in the knee. A randomized trial. J Bone Joint Surg Am. 2004;86-A:455–464. doi: 10.2106/00004623-200403000-00001. [DOI] [PubMed] [Google Scholar]
- 23.Brandt K, Mazzuca S, Katz B, Lane K, Buckwalter K, Yocum D, et al. Effects of doxycycline on progression of osteoarthritis: results of a randomized, placebo-controlled, double-blind trial. Arthritis Rheum. 2005;52(7):2015–2025. doi: 10.1002/art.21122. [DOI] [PubMed] [Google Scholar]
- 24.Brittain JH, Hu BS, Wright GA, Meyer CH, Macovski A, Nishimura DG. Coronary angiography with magnetization-prepared T2 contrast. Magn Reson Med. 1995;33(5):689–696. doi: 10.1002/mrm.1910330515. [DOI] [PubMed] [Google Scholar]
- 25.Oh J, Cha S, Aiken AH, Han ET, Crane JC, Stainsby JA, et al. Quantitative Apparent Diffusion Coefficients and T2 Relaxation Times in Characterizing Contrast Enhancing Brain Tumors and Regions of Peritumoral Edema. J Magn Reson Imaging. 2005 doi: 10.1002/jmri.20335. accepted. [DOI] [PubMed] [Google Scholar]
- 26.Kellgren J, Lawrence J. Radiologic assessment of osteoarthritis. Ann Rheum Dis. 1957;16:494–502. doi: 10.1136/ard.16.4.494. [DOI] [PMC free article] [PubMed] [Google Scholar]
- 27.Hart D, Spector T. Osteoarthritis. Oxford, England: Oxford University Press; 1998. Assessment of changes in joint tissues in patients treated with a disease-modifying osteoarthritis drug (DMOAD): monitoring outcomes; pp. 450–458. [Google Scholar]
- 28.Link TM, Steinbach LS, Ghosh S, Ries M, Lu Y, Lane N, et al. Osteoarthritis: MR imaging findings in different stages of disease and correlation with clinical findings. Radiology. 2003;226(2):373–381. doi: 10.1148/radiol.2262012190. [DOI] [PubMed] [Google Scholar]
- 29.Carballido-Gamio J, Bauer JS, Lee KY, Krause S, Majumdar S. Combined Image Processing Techniques for Characterization of MRI Cartilage of the Knee. Shanghai, China: 2005. Sep 1–4, [DOI] [PubMed] [Google Scholar]
- 30.Blumenkrantz G, Lindsey CT, Dunn TC, Jin H, Ries MD, Link TM, et al. A pilot, two-year longitudinal study of the interrelationship between trabecular bone and articular cartilage in the osteoarthritic knee. Osteoarthritis Cartilage. 2004;12(12):997–1005. doi: 10.1016/j.joca.2004.09.001. [DOI] [PubMed] [Google Scholar]
- 31.Rueckert D, Sonoda LI, Hayes C, Hill DL, Leach MO, Hawkes DJ. Nonrigid registration using free-form deformations: application to breast MR images. IEEE Trans Med Imaging. 1999;18(8):712–721. doi: 10.1109/42.796284. [DOI] [PubMed] [Google Scholar]
- 32.Mosher T, Dardzinski B. Cartilage MRI T2 relaxation time mapping: overview and applications. Seminars in musculoskeletal radiology. 2004;8(4):355–368. doi: 10.1055/s-2004-861764. [DOI] [PubMed] [Google Scholar]
- 33.Regatte RR, Akella SV, Borthakur A, Kneeland JB, Reddy R. Proteoglycan depletion-induced changes in transverse relaxation maps of cartilage: comparison of T2 and T1rho. Acad Radiol. 2002;9(12):1388–1394. doi: 10.1016/s1076-6332(03)80666-9. [DOI] [PubMed] [Google Scholar]
- 34.Toffanin R, Mlynarik V, Russo S, Szomolanyi P, Piras A, Vittur F. Proteoglycan depletion and magnetic resonance parameters of articular cartilage. Arch Biochem Biophys. 2001;390(2):235–242. doi: 10.1006/abbi.2001.2338. [DOI] [PubMed] [Google Scholar]
- 35.Nieminen MT, Toyras J, Rieppo J, Hakumaki JM, Silvennoinen J, Helminen HJ, et al. Quantitative MR microscopy of enzymatically degraded articular cartilage. Magn Reson Med. 2000;43(5):676–681. doi: 10.1002/(sici)1522-2594(200005)43:5<676::aid-mrm9>3.0.co;2-x. [DOI] [PubMed] [Google Scholar]
- 36.Gray M, Burstein D, Xia Y. Biochemical (and functional) imaging of articular cartilage. Seminars in musculoskeletal radiology. 2001;5(4):329–343. doi: 10.1055/s-2001-19043. [DOI] [PubMed] [Google Scholar]
- 37.Xia Y. Relaxation anisotropy in cartilage by NMR microscopy (muMRI) at 14-microm resolution. Magn Reson Med. 1998;39(6):941–949. doi: 10.1002/mrm.1910390612. [DOI] [PubMed] [Google Scholar]
- 38.Regatte R, Akella S, Lonner J, Kneeland J, Reddy R. T1rho relaxation mapping in human osteoarthritis (OA) cartilage: comparison of T1rho with T2. J Magn Reson Imaging. 2006;23(4):547–553. doi: 10.1002/jmri.20536. [DOI] [PubMed] [Google Scholar]
- 39.Duvvuri U, Goldberg AD, Kranz JK, Hoang L, Reddy R, Wehrli FW, et al. Water magnetic relaxation dispersion in biological systems: the contribution of proton exchange and implications for the noninvasive detection of cartilage degradation. Proc Natl Acad Sci U S A. 2001;98(22):12479–12484. doi: 10.1073/pnas.221471898. [DOI] [PMC free article] [PubMed] [Google Scholar]
- 40.Akella SV, Regatte RR, Wheaton AJ, Borthakur A, Reddy R. Reduction of residual dipolar interaction in cartilage by spin-lock technique. Magn Reson Med. 2004;52(5):1103–1109. doi: 10.1002/mrm.20241. [DOI] [PubMed] [Google Scholar]
- 41.Mosher T, Liu Y, Yang Q, Yao J, Smith R, Dardzinski B, et al. Age dependency of cartilage magnetic resonance imaging T2 relaxation times in asymptomatic women. Arthritis Rheum. 2004;50(9):2820–2828. doi: 10.1002/art.20473. [DOI] [PubMed] [Google Scholar]
- 42.Reddy R, Insko EK, Noyszewski EA, Dandora R, Kneeland JB, Leigh JS. Sodium MRI of human articular cartilage in vivo. Magn Reson Med. 1998;39(5):697–701. doi: 10.1002/mrm.1910390505. [DOI] [PubMed] [Google Scholar]
- 43.Shapiro EM, Borthakur A, Gougoutas A, Reddy R. 23Na MRI accurately measures fixed charge density in articular cartilage. Magn Reson Med. 2002;47(2):284–291. doi: 10.1002/mrm.10054. [DOI] [PMC free article] [PubMed] [Google Scholar]
- 44.Bashir A, Gray ML, Burstein D. Gd-DTPA2- as a measure of cartilage degradation. Magn Reson Med. 1996;36(5):665–673. doi: 10.1002/mrm.1910360504. [DOI] [PubMed] [Google Scholar]
- 45.Bashir A, Gray ML, Hartke J, Burstein D. Nondestructive imaging of human cartilage glycosaminoglycan concentration by MRI. Magn Reson Med. 1999;41(5):857–865. doi: 10.1002/(sici)1522-2594(199905)41:5<857::aid-mrm1>3.0.co;2-e. [DOI] [PubMed] [Google Scholar]
- 46.Nieminen MT, Rieppo J, Silvennoinen J, Toyras J, Hakumaki JM, Hyttinen MM, et al. Spatial assessment of articular cartilage proteoglycans with Gd-DTPA-enhanced T1 imaging. Magn Reson Med. 2002;48(4):640–648. doi: 10.1002/mrm.10273. [DOI] [PubMed] [Google Scholar]
- 47.Borthakur A, Wheaton A, Charagundla SR, Shapiro EM, Regatte RR, Akella SV, et al. Three-dimensional T1rho-weighted MRI at 1.5 Tesla. J Magn Reson Imaging. 2003;17(6):730–736. doi: 10.1002/jmri.10296. [DOI] [PubMed] [Google Scholar]
- 48.Smith HE, Mosher TJ, Dardzinski BJ, Collins BG, Collins CM, Yang QX, et al. Spatial variation in cartilage T2 of the knee. J Magn Reson Imaging. 2001;14(1):50–55. doi: 10.1002/jmri.1150. [DOI] [PubMed] [Google Scholar]
- 49.Lozano J, Li X, Link T, Safran M, Majumdar S, Ma C. Detection of posttraumatic cartilage injury using quantitative T1rho magnetic resonance imaging. A report of two cases with arthroscopic findings. J Bone Joint Surg Am. 2006;88(6):1349–1352. doi: 10.2106/JBJS.E.01051. [DOI] [PubMed] [Google Scholar]