

INTRODUCTION
Organophosphate (OP) poisoning produces a cholinergic crisis by blockade of acetylcholinesterase in the central and peripheral nervous systems. Acute effects of poisoning include central apnea [1–4], seizures [5, 6], bronchorrhea, bronchoconstriction, muscle weakness, myosis, urination, and salivation [7–10]. The morbidity and mortality from acute OP poisoning is attributed to respiratory failure [11] but the relative contributions of the central and peripheral effects in producing collapse of the respiratory system [12] is unclear. The clinical literature emphasizes the peripheral effects contributing to acute pulmonary insufficiency [11, 13]. However this does not exclude early mortality in the field due to central apnea [14, 15].
In this study we used a rodent model to analyze the dynamics of respiratory and cardiovascular collapse during acute OP poisoning. We found that poisoning caused a rapidly lethal central apnea. Central apnea consistently occurred soon after the poisoning but pulmonary insufficiency was more variable in both timing and severity. Mortality was reduced in animals that were sustained solely by artificial ventilation; however most ventilated animals exhibited signs of impaired gas exchange due to pulmonary insufficiency. Our findings support the hypothesis that OP poisoning in this animal model causes a sequential “two hit” insult, with rapid central apnea followed by delayed impairment of pulmonary gas exchange with prominent airway secretions.
MATERIALS AND METHODS
We studied 27 male Wistar rats, weighing 275–325 gm (Charles River Laboratories, Wilmington, MA). The University of Massachusetts Medical School Institutional Animal Care and Utilization Committee approved all experimental procedures and protocols. The animal model used in this study is a novel preparation for OP research and the procedures are described in detail below.
Surgical Procedures
Surgical procedures were performed under general anesthesia with 1.5 – 2.2% isoflurane (Abbott Labs, North Chicago, IL) titrated to achieve a respiratory rate of 50–60 breaths per minute. All surgical procedures were performed under 100% oxygen. The animals were restrained in a supine position with the head extended and limbs abducted. Adequacy of anesthesia was confirmed by lack of withdrawal from a painful stimulus applied to the foot. The trachea was cannulated percutaneously via a tracheostomy using polyethylene (.24mm) tubing. Polyethylene (0.05 mm) tubing was inserted into the femoral artery for blood pressure recordings and into the femoral vein for intravenous access. Bladder catheterization was unnecessary because the experiments lasted less than 2.5 hours. Spontaneous urination was used as a marker of cholinergic toxicity.
Anesthetic Circuit
Spontaneously breathing animals received oxygen and anesthetic through a 3/32” kynar barbed y-fitting (Small parts INC, Miami Lakes, FL) with one arm supplying the gas mixture and the other arm attached to a low-pressure gas scavenger system (Surgivet, Waukesha, WI). The distal y-tube was attached in-line with a CO2 detector, a small chamber pneumotachometer, and the tracheal tube. The dead space of the ventilation circuit (y-tube, end-tidal CO2 detector, pneumotachometer, and tracheal tube) was 0.33 cc total or roughly 10% of the tidal volume of the animals. All animals that were not mechanically ventilated received 100% oxygen throughout the course of the experiment.
Groups of animals received mechanical ventilation with or without pharmacologic paralysis. Mechanical ventilation was supplied through a modification of the above anesthesia circuit using a small animal positive-pressure ventilator (Harvard Apparatus, Holliston MA). Once the surgical procedures were completed the fraction of inspire oxygen was titrated to achieve a partial arterial oxygen concentration (PaO2) of 100–115 mmHg. The ventilator was initially set to a tidal volume of 3 cc and respiratory rate of 80 bpm. Ventilator settings were adjusted to achieve a target end-tidal PCO2 < 60mmHg. Once these targets were achieved the ventilator and fraction of inspired oxygen settings were not changed throughout the experiment. In pharmacologically paralyzed animals, adequacy of paralysis was monitored using esophageal pressure recordings (see below) to monitor respiratory effort.
Recording Techniques
Respiratory Recordings
Expired CO2 was measured using an infrared CO2 sensor (Novametrix, Wallingford CT) in-line with the endotracheal tube. End-tidal PCO2 (PETCO2) was recorded as the maximum expired PCO2 for each respiratory cycle, along with airflow, respiratory rate, volume of expire air, and minute ventilation. Airflow was measured using a small chamber pneumotachometer (HSE, March-Hugstetten Germany) in series with the expired CO2 detector. The volume of expired gas was calculated using half-wave integration of the airflow signal. Respiratory rate was calculated using the peak of the inspiratory tracing as a marker of a single breath. Minute ventilation was calculated as respiratory rate multiplied by the volume of expiration. The normal respiratory rate of the rat is 80 bpm. For the purpose of the study we defined apnea was as cessation of airflow for greater than 20 seconds and central (or non-obstructive) apnea as concomitant cessation of respiratory effort and airflow for greater than 20 seconds. Pulse oximetry was measured using a photodetector (Nelcor, Pleasanton CA) placed on the right paw. Raw tracing of the pulse oximetry signal as well as measured value of the arterial oxygen saturation was recorded and displayed continuously. Respiratory effort was monitored by esophageal pressure via a saline filled open tube inserted to the level of the mid-thorax connected to a pressure transducer (Cobe, Lakewood CO). Prior studies have correlated this esophageal pressure recording with pleural pressure as a non-invasive measurement of respiratory effort [16]. Pressure recordings were calibrated relative to atmospheric pressure recorded at the level of the animal’s mouth immediately prior to insertion of the esophageal tube. Respiratory effort was measured as maximal negative esophageal pressure from baseline for each respiratory cycle during spontaneous respiration. Similar measurements were performed during positive pressure mechanical ventilation as the negative deflections of respiratory effort were easily distinguished from the positive deflections of positive pressure ventilation.
Hemodynamic Recordings
Blood pressure and pulse rate were measured using polyethylene tubing connected to a pressure transducer (Utah Medical, Midvale UT). Mean arterial pressure was calculated from the analogue signal. Pulse rate was calculated using peak systolic blood pressure of the arterial pressure tracing as the marker for a single heartbeat. For the purpose of this study death was defined as an arterial pulse pressure (systolic pressure minus diastolic pressure) less than 3mmHg with a systolic blood pressure less than 5mmHg.
Arterial Blood Gas Measurements
Arterial blood samples for blood gas measurements were obtained via a stopcock attached in-line with the femoral arterial line. An initial small amount of blood (0.1 cc) was withdrawn and discarded to prevent mixing of catheter saline flush and arterial blood. A 0.2 ml sample of arterial blood was then withdrawn for immediate analysis in a Rapidlab 248 blood gas analyzer (Bayer Healthcare, East Walpole MA). Samples were withdrawn at differing schedules depending on the study protocol. In groups with spontaneously breathing animals measurements occurred sporadically. In groups with mechanical ventilation measurements either occurred at regular intervals (ventilation throughout) or at the time of apnea (rescue ventilation). Alveolar-arterial gradients (A-a) were calculated using the following formula where all pressures are in mmHg.
A-a gradients were reported as a percentage of the average A-a gradient during the control period for each animal.
Recordings in Unanaesthetized Animals
Unanaesthetized animals were placed in a cylindrical restraining device with an attached nose cone (Kent Scientific, Torrington CT). Oxygen was supplied through a pneumotachometer and end-tidal CO2 detector (see above) attached to the nose cone. The nosecone was retracted down the restraint device until a seal was formed around the animal’s nose. An adequate seal was determined by the strength of the airflow signal through the pneumotachometer. A needle attached to a length of polyethylene tubing was placed subcutaneously through an access port of the restraint device to allow a subcutaneous injection once the animal was restrained. This was accomplished under anesthesia at least 30 minutes prior to initiating the experiment to minimize respiratory changes associated with the needle insertion.
Animals were habituated to the restraining device in a dark quiet environment at least 30 minutes prior to beginning the experiment. No invasive procedures such as those required for hemodynamic monitoring were performed. The animal was removed from the restraining device once airflow through the pneumotachometer ceased and the animal appeared motionless. Visual inspection of the animals outside of the restraint device allowed us to determine if the lack of airflow was secondary to apnea or from dislodgement of the animal’s nose from the nosecone apparatus.
Signal Conditioning and Data Acquisition System
All physiologic recordings were measured continuously over the course of the experiment using a PC computer (Dell, Round Rock, TX) and data acquisition system (ADI instruments, Colorado Springs CO). Physiologic data were sampled at 400 Hz and displayed continuously during the experiment, and subsequently averaged in 15-second bins. Measured and calculated physiologic values were displayed in real time. Airflow and esophageal pressure were amplified and filtered (Molecular Devices, Sunnyvale, CA) prior to recording and display by the data acquisition system. Arterial pressure was amplified and filtered using a separate amplifier (ADI Instruments) controlled by the data acquisition system.
Protocol and Data Analysis
Animals were allowed to reach a physiologic steady state for 15 to 30 minutes following the surgical procedures prior to initiating poisoning. Dichlorvos (Sigma-Aldrich, St Louis MO) was diluted in 0.9% saline from a stock solution in acetonitrile and administered at a dose of 100 mg/kg subcutaneously (roughly 3x LD50) in all groups. Physiologic recordings were continued until blood pressure and pulse rate declined to the study endpoint. The study was terminated at death or 1 hour, whichever came first. Animals were randomized to four groups (Table 1). Animals in Group I (10 animals) were anesthetized and breathed 100% oxygen spontaneously. Animals in Group II (7 animals) were anesthetized. They initially breathed spontaneously but received mechanical ventilation that was initiated when the animal developed apnea, as defined by a lack of airflow and concomitant absence of respiratory effort. The fraction of inspired oxygen was titrated during the control period to achieve a PaO2 of 100–115 mmHg, and was not changed throughout the remainder of the experiment. Arterial blood gases were measured at three times on surviving animals: prior to the poisoning (control), at point of apnea and later during mechanical ventilation.
Table 1.
Interventions for Experimental Groups
| Group I (n=10) | Group II (n=7) | Group III (n=5) | Group IV (n=4) | |
|---|---|---|---|---|
| Anesthesia | Isoflurane | Isoflurane | Isoflurane | None |
| FIO2 during experiment | 100% | Titrated to PAO2 of 100–115mmHg | Titrated to PAO2 of 100–115mmHg | 100% |
| Pharmacologic Paralysis | None | None | Gallamine | None |
| Mechanical Ventilation | None | At apnea | Throughout experiment | None |
| 1hour survival | 0/10 | 5/7 | 4/6 | 0/4 |
| Functional Measurements | ETCO2, Vi, Ve, esophageal pressure, arterial pressure, pulse oximetry, PaO2, PaCO2 | ETCO2, Vi, Ve, esophageal pressure, arterial pressure, pulse oximetry, PaO2, PaCO2 | ETCO2, Vi, Ve, arterial pressure, pulse oximetry, PaO2, PaCO2 | ETCO2, Vi, Ve |
FIO2 - fraction of inspired oxygen
ETCO2 - end tidal carbon dioxide
Vi - volume of inspired gas
Ve – volume of expired gas
PaO2 – arterial partial pressure of oxygen
PaCO2 – arterial partial pressure of carbon dioxide
Animals in Group III (6 animals) were anesthetized, pharmacologically paralyzed and mechanically ventilated throughout the experiment. Adequacy of anesthesia was determined prior to paralysis and anesthesia was maintained at a constant level pre- and post- paralysis. Animals were paralyzed with gallamine hydrochloride (Sigma-Aldrich, St Louis MO) (6.2 mg/kg bolus and 9.3 mg/kg continuous venous infusion) and allowed to reach a physiologic steady state prior to initiating the research protocol. Inspired oxygen concentration was titrated to a target PaO2 concentration of 100–115mmHg prior to the poisoning as described above. Arterial blood gases were measured every 3 minutes for the first 24 minutes (8 times) followed by every 6 minutes for the next 42 minutes (7 times).
Animals in Group IV (4 animals) were poisoned while unanaesthetized and spontaneously breathing. 100% oxygen was supplied through the nose cone and recording apparatus during the entire experiment. Respiratory recordings were obtained from an in-line pneumotachometer and end tidal CO2 detector attached to the nose cone. The animals were removed from the restraining device following apnea and observed for 30 minutes to detect any resumption of sustained respiratory activity.
Statistics
Cardiorespiratory effects of dichlorvos poisoning are expressed in the text as mean +/− standard error of the entire cohort unless otherwise specified. Between-group comparisons were performed using an unpaired Student’s t-test or Fisher’s Exact test where appropriate [17].
RESULTS
Cardiorespiratory parameters during the control period showed no substantial difference between Groups I and the other anesthetized Groups (II and III) (see table 2) with the exception of PETCO2 and tidal volume. Group III animals were paralyzed and mechanically ventilated which precludes measurement of respiratory rate, tidal volume and effort. However data from end-tidal CO2, blood pressure, and pulse rate were included. PETCO2 levels were slightly lower in Group I, corresponding to slightly higher tidal volumes most likely due to lower levels of anesthesia. These small differences did not affect respiratory effort or time to apnea (see below).
Table 2.
Initial Respiratory and Hemodynamic characteristics of ventilated and non-ventilated animals
| Non-ventilated | Ventilated | p value | |
|---|---|---|---|
| Animal Weight | 320gm (+/− 8) | 336 gm (+/− 18) | 0.37 |
| Initial Respiratory Rate | 56 bpm (+/− 3) | 63 bpm (+/− 4) | 0.2 |
| Initial Tidal Volume | 2.84 cc (+/− .19) | 2.38 cc (+/− .37) | 0.25 |
| Initial Blood Pressure (MAP)’ | 90 mmHg (+/− 3) | 88 mmHg (+/− 3) | 0.64 |
| Initial Respiratory Effort* | −6.1 mmHg (+/− 2.2) | −5.6 mmHg (+/− 1.3) | 0.49 |
| Initial Pulse’ | 354 bpm (+/− 10) | 379 bpm (+/− 14) | 0.19 |
| Initial ET PCO2’ | 49 mmHg (+/− 1.1) | 53 mmHg (+/− 1.1) | 0.02 |
Respiratory Effort is measured as peak inspiratory pressure
‘ = Includes group III - paralyzed and ventilated animals (n=13)
Values are reported as mean (+/− standard error)
MAP = mean arterial pressure
Animals in Group I demonstrated a central apnea characterized by a simultaneous loss of tracheal airflow and respiratory effort prior to circulatory collapse with respiratory rate decreasing prior to the point of apnea. Figure 1 shows representative recordings from one animal. Animals in Group I showed an average respiratory rate that began declining 1 minute after poisoning and reached apnea an average of 4 min 57 sec (+1min 33sec) post-poisoning. Hemodynamic variables were robust over 20 minutes longer, gradually declining to the study endpoint (see materials and methods). Figure 2 plots respiratory rate and blood pressure over time for Group I and Group II. At the time of apnea the average mean arterial pressure (90mmHg + 10mmHg) was in the normal range and there was no systemic hypoxia (pulse oximetry >95%). A-a gradients measured at this time were also in the normal range for a rat. Animals who received mechanical ventilation (group II and III) lived longer then animals with no intervention (group I) but mechanical ventilation did not prevent all mortality (Figure 3).
Figure 1. Sample tracing of OP poisoned rat.
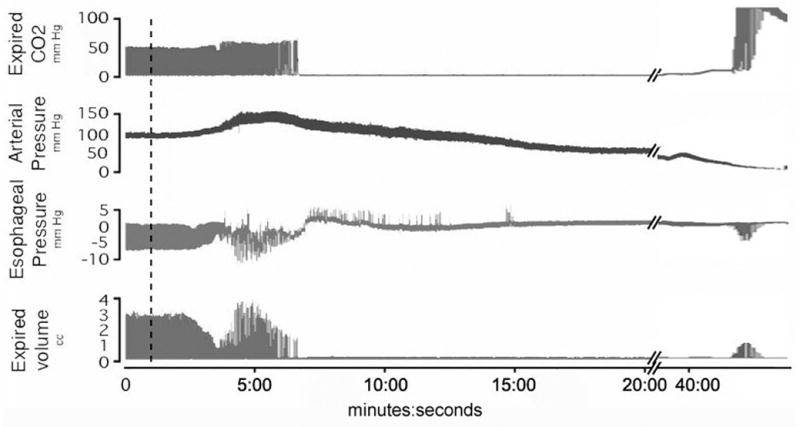
A sample tracing of a single organophosphate poisoned rat from group 1 shows apnea occurring at 6:45 with a long period of no respiratory effort. OP injected at broken line. A break in the time scale allows us to see the terminal gasping that occurs as blood pressure approached zero. The positive deflections in the esophageal tracing represent retching.
Figure 2. Blood pressure and respiratory rate in OP poisoned animals with and without mechanical ventilation.
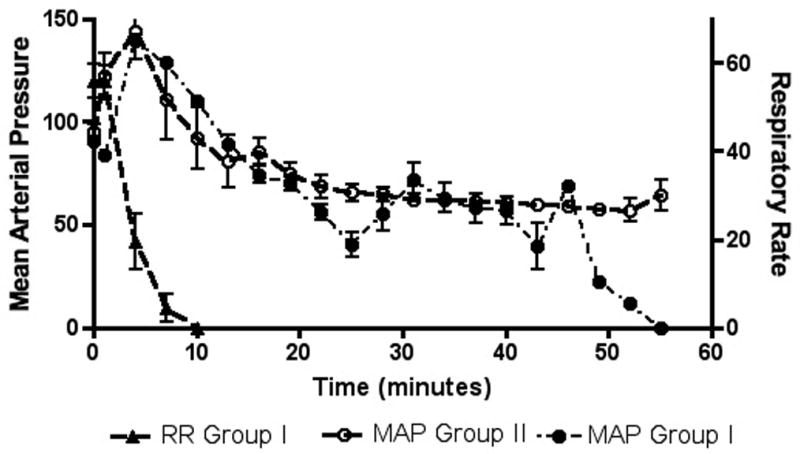
Grouped data sets show respiratory rate and mean arterial pressure for animals with acute OP and no further intervention (Group I) and mean arterial pressure for animals with acute OP and mechanical ventilation initiated at the point of apnea (Group II). Results are shown as mean value +/− standard error with respiratory rate represented on the right axis and mean arterial pressure on the left axis. The respiratory rate of Group II is not shown, as it was almost identical to the respiratory rate curve of Group I. In all groups poisoning occurred at 1 minute (black arrow).
Figure 3. Survival histogram ventilated and non-ventilated animals.
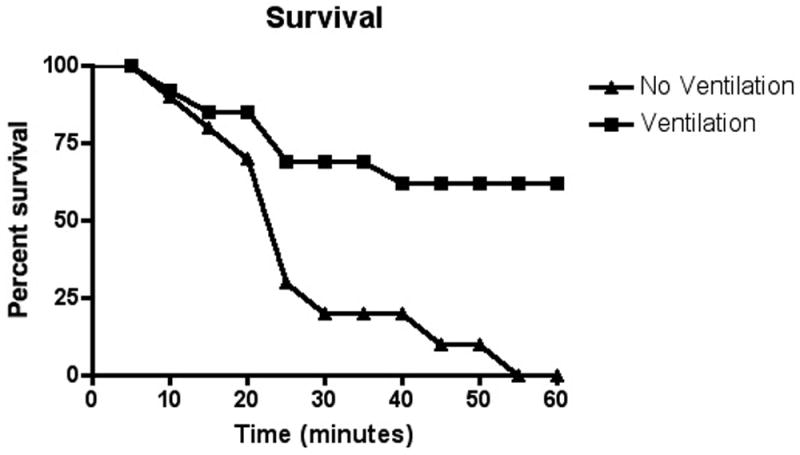
Grouped data sets for animals with OP exposure but no intervention (Group I) and all animals with OP exposure but mechanical ventilation (Group II and III) are displayed as mortality rate over time. Data is binned into 5-minute time blocks and presented as the percent of animals that survived to the end of the time block. Group IV (unanaesthetized) data not available secondary to lack of invasive cardiovascular monitoring.
Animals in all groups that survived the initial apnea showed signs of pulmonary insufficiency. Animals in Group II (rescue mechanical ventilation) and group III (mechanical ventilation throughout) showed a significant increase in survival at one hour post poisoning (69.2% vs. 0%). The animals that did not survive despite mechanical ventilation were unable to be ventilated and uniformly had fluid filling their tracheal tube at the time of death. Markers of pulmonary dysfunction such as A-a gradient and changes in the VE/VI ratio were significantly worse in animals that died (figure 4).
Figure 4. Alveolar-arterial gradient and VE/VI ratio in animals that lived and died despite mechanical ventilation (Groups II and III).
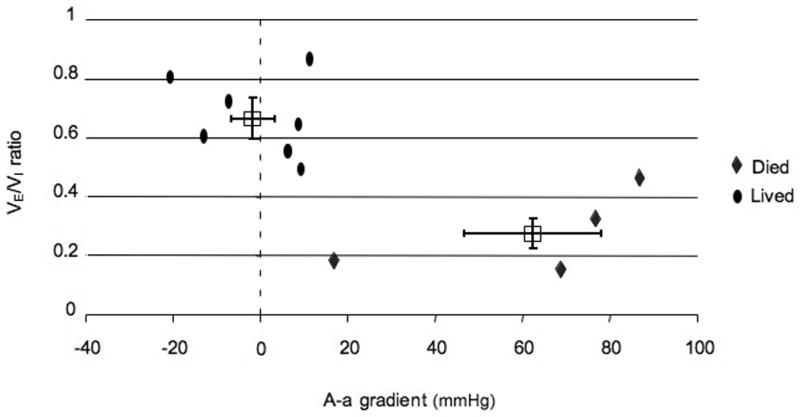
Data for animals receiving mechanical ventilation (Groups II and III) are plotted with VE/VI ratio on the Y axis and A-a gradient on the X axis. Individual animal data are represented as ovals (animals that lived to study endpoint) and diamonds (animals that did not live to study endpoint). Group averages for animals that lived and died are presented at boxes with SEM as bars. P value for comparison of VE/VI ratio between groups is 0.0014. P value for comparison of A-a gradient between groups is 0.0004. Note, three animals from Group II and III without ABG measurements are not included in this graph (one died and two lived).
During normal mechanical ventilation the (VE)/(VI) ratio is expected to be close to one. Mechanical ventilation supplies a constant VI so a reduction in this ratio is a result of decreased VE possibly due to severe loss of pulmonary compliance or outright obstruction of the lower airways resulting in a rupture of the tracheal seal, thereby causing a reduction in expired volume compared to inspired volume. Future studies using this animal model could benefit from measurement of airway pressure, which we would expect to increase due to pulmonary toxicity of OP[10, 18].
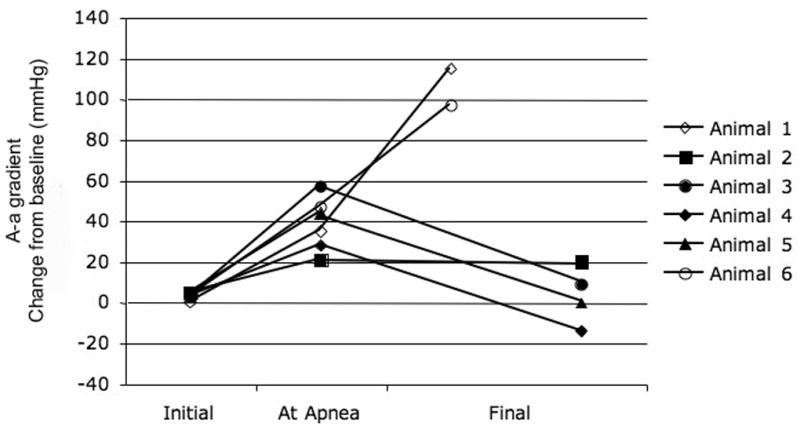
Arterial blood gas measurements in Groups II and III showed that the pulmonary effects of the OP were variable. Comparing animals that lived with those that died despite mechanical ventilation shows a difference between the two groups. In animals that did not survive to the study endpoint the A-a gradient began increasing around the point of apnea and progressively worsened during the post-apneic period. Two of the 6 animals with mechanical ventilation throughout the experiment (Group III) died before 1 hour with secretions filling the tracheal tube (Figure 5a). One of these animals showed increasing A-a gradients starting around the projected point of apnea. The other animal showed a normal A-a gradient at the time of death but a VE/VI ratio < 0.2. ABG measurements in animals in Group II (rescue ventilation) showed that abnormal pulmonary gas exchange began around the time of apnea. The animals showed an elevated A-a gradient over baseline around the time of apnea (35mmHg +/− 15) with some animals (2 of 7) demonstrating a widening A-a gradient that culminated in death from a fluid filled trachea (figure 5b). Animals that lived to one hour (5 of 7) demonstrated abnormal A-a gradients at the point of apnea (33mmHg) but normal A-a gradients at the termination of the experiment (1mmHg). The change in A-a gradient (Group II and III) was variable with animals that did not survive demonstrating a significant increase in A-a gradient over those that lived to the study endpoint (63 vs. −1.3 mmHg, p=0.0004 Figure 4).
Figure 5. Alveolar-arterial gradient in animals receiving mechanical ventilation.
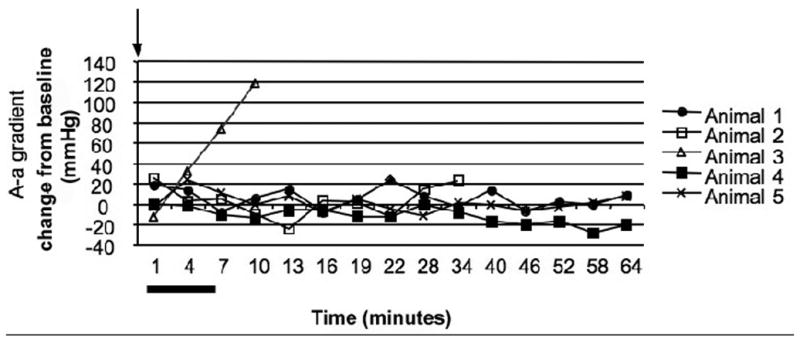
A - A graphical depiction of alveolar-arterial gradient for each animal that was exposed to OP and received mechanical ventilation throughout the experiment (Group III) is plotted over time. One of the animals in this group is not included due to inability to obtain the necessary data points. Arterial blood gas measurements were obtained on a pre-determined schedule with a measurement every 3 minutes initially (8 times) and then every 6 minutes (7 times). The alveolar-arterial gradient is presented as change from baseline levels. All animals were poisoned at zero minutes (black arrow). Although the animals in this figure were paralyzed, the range of point of apnea in other groups is represented by a black bar under the X axis. Data points for animals that survived to the study endpoint are solid shapes with data points for animals that died indicated by open shapes.
B - A graphical depiction of alveolar-arterial gradient for each animal that was exposed to OP and received mechanical ventilation at the point of apnea (Group II) is plotted for control period, at the point of apnea, and study endpoint. Six of the animals that received rescue mechanical ventilation had arterial blood gas measurements at these time points. The final endpoint was obtained just prior to cardiovascular collapse. A-a gradients are presented as change from baseline. Data points for animals that survived are represented as solid shapes and data points for animals that died are open shapes.
Anesthesia had a limited effect on the characteristics of the apnea following acute OP poisoning. None of the animals in Group IV (no anesthesia) survived and the time to respiratory arrest occurred over a similar time course as in Group I animals (4min vs. 4min 57sec, P=0.723).
Some animals in Group I (7 of 10) demonstrated auto-resuscitative breathing post apnea. Although some authors use gasping and auto-resuscitative breathing interchangeably[19], we use the term to refer to post apneic breathing that supports cardio-pulmonary activity[20]. The post-apneic breathing was characterized by a weak respiratory effort at 20 bpm that occurred once blood pressure dropped close to the study endpoint. Animals with autoresuscitative breathing showed a prolonged time to circulatory collapse (31 vs. 12 minutes, p=0.025). Post-apneic respiratory activity was not seen in any of the other groups. It should be noted that Group III animals were paralyzed so post-apneic respiratory activity would not have been recognized and Group IV animals were removed from the restraining device (which also recorded breathing) shortly after apnea onset precluding any record of late respiratory activity. Visual observation of animals removed from the restraining device showed no resumption of respiratory activity. There was no visible respiratory effort once animals were removed from the restraint device. The end point for Group IV was respiratory arrest rather than circulatory collapse since arterial pressure was not recorded.
DISCUSSION
In our animal model of acute organophosphate poisoning, dichlorvos at 3 times the LD50 caused a central failure of breathing in all animals. The key finding was rapidly progressive bradypnea leading to apnea due to loss of respiratory effort. Respiratory muscle weakness is an unlikely mechanism of respiratory failure because apneic animals exhibited retching, intermittent flexing of the torso, and gasping respirations during the post apneic period. The retching was identified as strong positive deflections of the esophageal pressure transducer. Although other muscular activities such as forced exhalation, thoracic wall contraction or abdominal wall contraction would increase esophageal pressure; all of these activities are accompanied with tracheal airflow, which was not seen during retching. Esophageal contractions cause increased esophageal pressure without tracheal airflow but differentiating this from retching would require esophageal and gastric electromyelograms.
The lack of paralysis of the respiratory muscles is also supported by other studies that demonstrated intact diaphragmatic contraction following OP poisoning [4]. We excluded systemic hypotension as a cause of central apnea because arterial pressure was in the normal range at the time of apnea onset. We also excluded apnea due to acute upper airway obstruction since this would have manifested as increasing respiratory effort during apnea, whereas in all our experiments hypopnea and apnea was associated with reduction followed by absence of respiratory effort, respectively. Our findings are consistent with other studies of OP poisoning in experimental animal models that demonstrate loss of central inspiratory drive due to poisoning [4, 6, 21].
Central apnea has not been documented in clinical studies; rather case series of human OP poisoning emphasize respiratory failure due to toxic cholinergic effects on the lung [13, 22–24]. It is possible that central apnea is not prevalent in the clinical literature because either it is masked by mechanical ventilation or patients with central apnea die before reaching the hospital. Another possibility is that the human central respiratory oscillator (CRO) is resistant to cholinergic toxicities. It is less likely that the lack of central apnea is due to ingestions less then the LD50. There is limited data concerning the degree of most exposures due to circumstances of the ingestion (suicide, accidental exposure…) but the published survival rate post OP poisoning is 30% despite aggressive anti-cholinergic therapy and supportive care. Anti-cholinergic therapy is considered very effective and aggressive therapy in patients who ingested the LD50 of an OP would likely be less than 30%.
The mechanism of central apnea from increased acetylcholine remains unclear. Peripheral feedback to the CRO, feed-forward inhibition to the CRO, disruption of pontomedullary circuits or disruption of the CRO itself all remain possibilities. Inputs such as the vagus nerve, glossopharyngeal nerve or pontomedullary inputs may be involved. Mechanoreceptors in the lung that could be activated by bronchoconstriction or fasciculations provide feedback to the CRO and can result in apnea [25]. Acetylcholine receptors have been shown to be active in modulating respiratory rhythm [26] and over-stimulation may result in loss of rhythmic output of the CRO. Further studies are needed to address the primary source of central inspiratory inhibition due to cholinergic excess. The second phase of the OP poisoning, progressive pulmonary insufficiency, was variable across animals. Although all poisoned animals exhibited signs of pulmonary compromise, with either reduction in VE/VI ratio and/or widening of the alveolar-arterial gradient, the degree of pulmonary dysfunction was highly variable and only one third of the animals died from pulmonary secretions filling their lungs. It is unclear what factors led to this variability but it is interesting to note that the percentage of animals dying from the pulmonary secretions (33%) is similar to the percentage of human patients that die despite intensive care (10–35%) [13, 23].
Gasping respirations were recorded in some poisoned animals that lived on average almost 20 minutes longer then animals that showed no gasping respiration. However it is unlikely that the gasping respirations prolonged life because the respiratory activity occurred almost immediately before the point of death with mean arterial pressures averaging around 10 mmHg at the time of gasping. Prior studies of gasping have noted an association of gasping activity with hypoxia [27] but this was not consistently found in our study as hypoxia greatly preceded gasping in many of the animals.
Extrapolation of these results to the clinical treatment of human OP poisonings should be done with extreme caution but there are two aspects of our data that deserve discussion. Apnea occurred significantly prior to cardiac arrest so that in battlefield areas where triage is important, individuals in respiratory arrest may survive for a period of time prior to ventilatory support. Studies of patients who survive the initial stages of acute OP poisoning to make it to the intensive care unit describe long periods of treatment requiring anticholinergics [13, 23, 24] but as discussed above, this patient population may not be identical to patients encountered in the pre-hospital setting or a mass casualty event. Patients encountered immediately after a poisoning may show a precipitous collapse of respiratory effort. Despite aggressive anticholinergics therapy and intensive supportive care, severe organophosphate poisonings show a mortality rate around 30%[13, 24]. These patients eventually die due to inability to maintain oxygenation despite ventilation or inability to maintain adequate perfusion[13].
A potential problem with our model is the use of inhaled anesthetics. Inhaled anesthetics have a well-documented effect of respiratory depression. It could be argued that the apnea seen in our study was secondary to the inhaled anesthetic and not the OP itself. If isoflurane was wholly or partially responsible for the apnea in our experimental model then we would have found a significant differences between the outcome of Group IV (unanaesthetized animals) and that of Groups I and II. Both anesthetized and unanaesthetized groups showed 100% mortality with no differences in the time to onset of apnea.
An additional potential problem relates to the use of gallamine as a paralytic agent in mechanically ventilated animals. Gallamine is a known antagonist of muscarinic agonists and acts non-competitively via allosteric binding of M1 and M2 muscarinic receptors in the brain and lung [28, 29]. Both M1 and M2 receptors are present in the pre-Botzinger complex [30] but gallamine has been used extensively in respiratory research and has no effect on the output of the CRO [31]. In previous studies gallamine has resulted in potentiation of vagally mediated bronchoconstriction [32] and could theoretically increase pulmonary secretions following acute OP exposure. It is important to note that there were no pulmonary effects of gallamine during the control period prior to the poisoning, as determined by A-a gradient and VEVI ratio. Future studies in this model should be performed with neuromuscular blocking agents that have no effects on muscarinic receptors.
Acknowledgments
This study was supported in part by the National Institutes of Health (grant 1K08 NSO48857). The contents of this article are solely the responsibility of the authors and do not necessarily represent the official views of the NIH.
RG would also like to recognize the support of the Millenium MD/PhD program of UMass Medical School.
List of Abbreviations
- A-a
Alveolar-arterial
- CRO
Central respiratory oscillator
- VE
Volume of expired gas
- PaO2
Partial arterial oxygen concentration
- CO2
Carbon dioxide
- OP
Organophosphate
- VI
Volume of inspired gas
Footnotes
Publisher's Disclaimer: This is a PDF file of an unedited manuscript that has been accepted for publication. As a service to our customers we are providing this early version of the manuscript. The manuscript will undergo copyediting, typesetting, and review of the resulting proof before it is published in its final citable form. Please note that during the production process errors may be discovered which could affect the content, and all legal disclaimers that apply to the journal pertain.
Contributor Information
Romolo J Gaspari, Assistant Professor, Department of Emergency Medicine, University of Massachusetts School of Medicine, 55 Lake Ave North, Worcester, MA 01655.
David Paydarfar, Professor, Departments of Neurology and Physiology, University of Massachusetts School of Medicine, 55 Lake Ave North, Worcester, MA 01655.
References
- 1.Gillis RA, Walton DP, Quest JA, et al. Cardiorespiratory effects produced by activation of cholinergic muscarinic receptors on the ventral surface of the medulla. J Pharmacol Exp Ther. 1988;247(2):765–73. [PubMed] [Google Scholar]
- 2.Chang FC, Foster RE, Beers ET, et al. Neurophysiological concomitants of soman-induced respiratory depression in awake, behaving guinea pigs. Toxicol Appl Pharmacol. 1990;102(2):233–50. doi: 10.1016/0041-008x(90)90023-n. [DOI] [PubMed] [Google Scholar]
- 3.Adams GK, 3rd, Yamamura HI, O’Leary JF. Recovery of central respiratory function following anticholinesterase intoxication. Eur J Pharmacol. 1976;38(1):101–12. doi: 10.1016/0014-2999(76)90206-5. [DOI] [PubMed] [Google Scholar]
- 4.Rickett DL, Glenn JF, Beers ET. Central respiratory effects versus neuromuscular actions of nerve agents. Neurotoxicology. 1986;7(1):225–36. [PubMed] [Google Scholar]
- 5.Tuovinen K. Organophosphate-induced convulsions and prevention of neuropathological damages. Toxicology. 2004;196(1–2):31–9. doi: 10.1016/j.tox.2003.10.013. [DOI] [PubMed] [Google Scholar]
- 6.Takahashi H, Kojima T, Ikeda T, et al. Differences in the mode of lethality produced through intravenous and oral administration of organophosphorus insecticides in rats. Fundam Appl Toxicol. 1991;16(3):459–68. doi: 10.1016/0272-0590(91)90086-j. [DOI] [PubMed] [Google Scholar]
- 7.Dettbarn WD. Pesticide induced muscle necrosis: mechanisms and prevention. Fundam Appl Toxicol. 1984;4(2 Pt 2):S18–26. doi: 10.1016/0272-0590(84)90134-9. [DOI] [PubMed] [Google Scholar]
- 8.Fryer AD, Lein PJ, Howard AS, et al. Mechanisms of organophosphate insecticide-induced airway hyperreactivity. Am J Physiol Lung Cell Mol Physiol. 2004;286(5):L963–9. doi: 10.1152/ajplung.00343.2003. [DOI] [PubMed] [Google Scholar]
- 9.Okudera H. Clinical features on nerve gas terrorism in Matsumoto. J Clin Neurosci. 2002;9(1):17–21. doi: 10.1054/jocn.2001.1020. [DOI] [PubMed] [Google Scholar]
- 10.Segura P, Chavez J, Montano LM, et al. Identification of mechanisms involved in the acute airway toxicity induced by parathion. Naunyn Schmiedebergs Arch Pharmacol. 1999;360(6):699–710. doi: 10.1007/s002109900101. [DOI] [PubMed] [Google Scholar]
- 11.Tafuri J, Roberts J. Organophosphate poisoning. Ann Emerg Med. 1987;16(2):193–202. doi: 10.1016/s0196-0644(87)80015-x. [DOI] [PubMed] [Google Scholar]
- 12.Hayes W, Laws E. In: Handbook of Pesticide Toxicology. Hayes W, Laws E, editors. San Diego, CA: Academic Press; 1991. [Google Scholar]
- 13.Munidasa UA, Gawarammana IB, Kularatne SA, et al. Survival pattern in patients with acute organophosphate poisoning receiving intensive care. J Toxicol Clin Toxicol. 2004;42(4):343–7. doi: 10.1081/clt-120039539. [DOI] [PubMed] [Google Scholar]
- 14.Burton MD, Nouri M, Kazemi H. Acetylcholine and central respiratory control: perturbations of acetylcholine synthesis in the isolated brainstem of the neonatal rat. Brain Res. 1995;670(1):39–47. doi: 10.1016/0006-8993(94)01249-h. [DOI] [PubMed] [Google Scholar]
- 15.Anzueto A, Berdine GG, Moore GT, et al. Pathophysiology of soman intoxication in primates. Toxicol Appl Pharmacol. 1986;86(1):56–68. doi: 10.1016/0041-008x(86)90399-6. [DOI] [PubMed] [Google Scholar]
- 16.Davis GM, Coates AL, Dalle D, et al. Measurement of pulmonary mechanics in the newborn lamb: a comparison of three techniques. J Appl Physiol. 1988;64(3):972–81. doi: 10.1152/jappl.1988.64.3.972. [DOI] [PubMed] [Google Scholar]
- 17.Armitage P, Berry G. Statistical Methods in Medical Research. 2. Boston, MA: Blackwell Scientific; 2001. p. 832. [Google Scholar]
- 18.Abbrecht PH, Kyle RR, Bryant HJ. Pulmonary mechanical responses to cholinesterase inhibitor. Fundam Appl Toxicol. 1989;13(3):593–604. doi: 10.1016/0272-0590(89)90297-2. [DOI] [PubMed] [Google Scholar]
- 19.Perkin RM, Resnik DB. The agony of agonal respiration: is the last gasp necessary? J Med Ethics. 2002;28(3):164–9. doi: 10.1136/jme.28.3.164. [DOI] [PMC free article] [PubMed] [Google Scholar]
- 20.Sanocka UM, Donnelly DF, Haddad GG. Autoresuscitation: a survival mechanism in piglets. J Appl Physiol. 1992;73(2):749–53. doi: 10.1152/jappl.1992.73.2.749. [DOI] [PubMed] [Google Scholar]
- 21.Fleming NW, Henderson TR, Dretchen KL. Mechanisms of respiratory failure produced by neostigmine and diisopropyl fluorophosphate. Eur J Pharmacol. 1991;195(1):85–91. doi: 10.1016/0014-2999(91)90384-3. [DOI] [PubMed] [Google Scholar]
- 22.Asari Y, Kamijyo Y, Soma K. Changes in the hemodynamic state of patients with acute lethal organophosphate poisoning. Vet Hum Toxicol. 2004;46(1):5–9. [PubMed] [Google Scholar]
- 23.Emerson GM, Gray NM, Jelinek GA, et al. Organophosphate poisoning in Perth, Western Australia, 1987–1996. J Emerg Med. 1999;17(2):273–7. doi: 10.1016/s0736-4679(98)00191-7. [DOI] [PubMed] [Google Scholar]
- 24.Goswamy R, Chaudhuri A, Mahashur AA. Study of respiratory failure in organophosphate and carbamate poisoning. Heart Lung. 1994;23(6):466–72. [PubMed] [Google Scholar]
- 25.Bonham AC, McCrimmon DR. Neurones in a discrete region of the nucleus tractus solitarius are required for the Breuer-Hering reflex in rat. J Physiol. 1990;427:261–80. doi: 10.1113/jphysiol.1990.sp018171. [DOI] [PMC free article] [PubMed] [Google Scholar]
- 26.Shao XM, Feldman JL. Cholinergic neurotransmission in the preBotzinger Complex modulates excitability of inspiratory neurons and regulates respiratory rhythm. Neuroscience. 2005;130(4):1069–81. doi: 10.1016/j.neuroscience.2004.10.028. [DOI] [PMC free article] [PubMed] [Google Scholar]
- 27.St John WM, Knuth KV. A characterization of the respiratory pattern of gasping. J Appl Physiol. 1981;50(5):984–93. doi: 10.1152/jappl.1981.50.5.984. [DOI] [PubMed] [Google Scholar]
- 28.Stockton JM, Birdsall NJ, Burgen AS, et al. Modification of the binding properties of muscarinic receptors by gallamine. Mol Pharmacol. 1983;23(3):551–7. [PubMed] [Google Scholar]
- 29.Lazareno S, Popham A, Birdsall NJ. Allosteric interactions of staurosporine and other indolocarbazoles with N-[methyl-(3)H]scopolamine and acetylcholine at muscarinic receptor subtypes: identification of a second allosteric site. Mol Pharmacol. 2000;58(1):194–207. doi: 10.1124/mol.58.1.194. [DOI] [PubMed] [Google Scholar]
- 30.Lai J, Shao XM, Pan RW, et al. RT-PCR reveals muscarinic acetylcholine receptor mRNA in the pre-Botzinger complex. Am J Physiol Lung Cell Mol Physiol. 2001;281(6):L1420–4. doi: 10.1152/ajplung.2001.281.6.L1420. [DOI] [PubMed] [Google Scholar]
- 31.Morin-Surun MP, Champagnat J, Denavit-Saubie M, et al. The effects of acetylcholine on bulbar respiratory related neurones. Consequences of anaesthesia by pentobarbital. Naunyn Schmiedebergs Arch Pharmacol. 1984;325(3):205–8. doi: 10.1007/BF00495944. [DOI] [PubMed] [Google Scholar]
- 32.Fryer AD, Maclagan J. Pancuronium and gallamine are antagonists for pre- and post-junctional muscarinic receptors in the guinea-pig lung. Naunyn Schmiedebergs Arch Pharmacol. 1987;335(4):367–71. doi: 10.1007/BF00165549. [DOI] [PubMed] [Google Scholar]