Abstract
The activity of the c-Src protein tyrosine kinase is regulated by phosphorylation of a tyrosine residue (Tyr-527) in the C-terminal tail of the molecule. Phosphorylation of Tyr-527 promotes association of the tail with the SH2 domain and a concomitant reduction of the enzymatic activity of Src. We asked the question whether regulation by C-terminal phosphorylation was accompanied by a change in the quaternary structure of the enzyme or if it occurred within a monomeric form of Src. For this purpose we purified to homogeneity a chicken Src form lacking the unique domain from Schizosaccharomyces pombe cells. The cells were engineered to express Src along with Csk, a protein kinase able to phosphorylate Tyr-527 efficiently. Mass spectrometric analysis showed that purified Src was homogeneously phosphorylated at Tyr-527. The enzyme was in the regulated form, because it could be activated by a phosphorylated peptide able to bind the SH2 domain with high affinity. Using gel filtration chromatography, dynamic light scattering, and ultracentrifugation, we found that the regulated form of Src was a monomer. We have obtained crystals diffracting to 2.4 Å with space group P212121 and one molecule per asymmetric unit, in agreement with the monomeric state. These results indicate that the structural rearrangements of regulated Src are of an intramolecular nature.
Tyrosine phosphorylation plays an important role in the regulation of many cellular processes. The activity of the enzymes governing this modification, protein tyrosine kinases and phosphatases, needs to be tightly controlled for tyrosine phosphorylation to proceed orderly (1). Improper phosphorylation, due to misfunction of protein tyrosine kinases or phosphatases, can lead to diseases in humans and animals, including immunodeficiencies and cancer. c-Src was the first cellular protein tyrosine kinase identified almost 20 years ago and since has served as a prototype for this class of enzymes (2). Src is a member of the family of protein tyrosine kinases of the same name that is distinguished by a conserved arrangement of functional domains. These are, from N to C terminus, a poorly conserved region called unique domain, two protein–protein interaction modules called Src-homology 2 and 3 (SH2 and SH3) domains, a catalytic domain, and a short tail containing a tyrosine residue important for regulation. The activity of c-Src is regulated in a complex way that involves phosphorylation and protein–protein interactions (reviewed in refs. 3, 4). A key regulatory switch in c-Src operates by phosphorylation and dephosphorylation of tyrosine residue 527 in the C-terminal tail of the molecule. Most Src molecules in a cell are phosphorylated at this residue by the action of the Csk family of protein tyrosine kinases (reviewed in refs. 3 and 5). Dephosphorylation of this residue leads to a severalfold increase in the activity of Src (ref. 6, reviewed in ref. 7). Active forms of Src, on the other hand, are phosphorylated at Tyr416 in the catalytic domain, mainly by autophosphorylation (see ref. 3). There is extensive experimental evidence to support the hypothesis, first suggested by Matsuda et al. (8), that phosphorylated Tyr-527 undergoes an interaction with the SH2 domain of Src and that this interaction is accompanied by a conformational change that reduces kinase activity (reviewed in refs. 3, 4). No structural data to prove this model, however, has yet been produced. The ligand binding surface of the SH3 domain is also necessary for this intramolecular association and regulation of the enzyme, presumably by binding to some other region of Src (reviewed in ref. 4). The unique domain, on the other hand, is not involved in regulation by C-terminal phosphorylation (9). Binding of heterologous proteins to the SH2 and/or SH3 domain is thought to displace the intramolecular interactions and activate Src. In vivo such activating associations have been documented for some growth factor receptors (reviewed in ref. 10) and for the cellular substrate Sin (11). Activation by Src SH2 domain ligands has been reproduced in vitro (12, 13). Eck et al. (14) have published the crystal structure of the SH3-SH2 domains of the Src family member Lck, complexed to a peptide derived from the tail containing phosphorylated Tyr-505, corresponding to Tyr-527 of Src. In the crystal structure, the Lck regulatory domains form a dimer with the phosphopeptide binding at the interface. No further evidence for the existence of dimers of Src family kinases in the regulated state is known.
Transient dimerization of activated protein tyrosine kinases is well documented for receptor-type kinases upon ligand binding and usually results in phosphorylation of tyrosine residues in the activation loop through a trans mechanism (reviewed in ref. 15). Whether cytoplasmic protein tyrosine kinases such as Src dimerize in the cell to autophosphorylate is still not clear. Occurrence of both mechanisms has been reported for Src (reviewed in ref. 3). While the unique domain does not appear to be required for regulation of Src by C-terminal phosphorylation, it is possible that in vivo the unique domain may be implicated in the formation of Src dimers, be they in the regulated or active configuration.
We previously have used fission yeast Schizosaccharomyces pombe to study the regulation of c-Src in an organism devoid of specific Src regulators (9, 16, 17). Moreover, using S. pombe cells we have expressed, purified, and characterized the catalytic domain of Src including the tail (Src-CD; ref. 18). Here we present a biochemical, physicochemical, and preliminary structural analysis of a purified form of Src (without the unique domain; Src-ΔU) phosphorylated at Tyr-527 and catalytically repressed.
MATERIALS AND METHODS
Expression and Purification.
Plasmids pRSP-Src-ΔU, pRSP-Src-kinonly (encoding Src-CD), and pAU-Csk have been described previously (9, 16). The Src-ΔU construct starts with methionine followed by Ala-81 to Leu-533. The coding region has been entirely sequenced. S. pombe strain SP200 (h−s leu1.32 ura4 ade210) was used as host. Expression of Src and preparation of extract was done as described previously (18). Protein purification was performed at 4°C. The cell suspension was centrifuged (30 min at 6,000 g), and the supernatant applied to a Q-Sepharose column (100 ml) and eluted in buffer A (50 mM triethanolamine, pH 7.6/1 mM phenylmethylsulfonyl fluoride/0.1 mM sodium orthovanadate/1 mM sodium azide/5 mM DTT) with a linear gradient from 0 to 1 M NaCl. Fractions containing Src were detected by immunoblotting using cst1 antibody as described (16). Pooled fractions were dialyzed against buffer A, applied to a second 30-ml Q-Sepharose column, and eluted with a linear gradient from 0 to 250 mM NaCl. The fractions containing Src then were pooled and passed over an ATP affinity column (19). The column was washed with buffer A plus 50 mM MgCl2 and 1 M NaCl. Src was eluted with buffer A containing 1 M NaCl and run over a G75 gel-filtration column in buffer A containing 40 mM NaCl. Finally, the protein was purified over a MonoQ column in buffer A and eluted with a gradient of NaCl from 25 to 90 mM. The purity of each batch was tested by mass spectrometry. Approximately 5–10 mg of Src-ΔU protein phosphorylated at Tyr-527 could be obtained from 100 liters of cells. The protein was frozen in liquid nitrogen and stored for several months without detectable changes in crystallization and activity properties.
Mass Spectrometry and Mapping of Phosphorylation Sites.
Mass spectra were acquired on an API III triple quadrupole mass spectrometer equipped with an updated collision cell (Perkin–Elmer; Sciex Instruments, Thornhill, Canada) and a nanoelectrospray source (20, 21). For the intact molecular mass measurement the sample was diluted to 3–6 μM in 50% methanol and 10% formic acid. For the phosphorylation mapping, the Src-ΔU preparation was digested with trypsin after reduction and alkylation as previously described (18). The resulting peptide solution was diluted to a final concentration of 1 μM with 50% methanol. The phosphopeptide was selectively detected in the unseparated mixture by a parent ion scan of m/z 79, and the phosphopeptide was sequenced in the positive ion mode (18, 22). Less than 1 pmol of sample was used for each measurement.
Kinase Assays.
Kinase assays were performed in kinase buffer (20 mM Hepes, pH 7.6/10 mM MnCl2/1 mM DTT) using the Src peptide substrate (AEEEIYGEFEAAKKKKK; ref. 23) as described (18). Three peptides were used for the activation experiments: (i) phosphorylated, (ii) unphosphorylated hamster polyoma virus middle T antigen peptide (EPQYEEIPI, refs. 12, 13, 24), and (iii) phosphorylated Src tail peptide (TEPQYQPGENL). All peptides were synthesized by the EMBL peptide unit, were acetylated at the N terminus, and contained an amide group at the C terminus. Determination of kinase concentrations was done using the Bradford assay with BSA as standard (25). In the activation experiments, preincubation with the different peptides was carried out for 30 min at 4°C. The reactions were started by adding the diluted [γ-32P]ATP solution (2 Ci/mmol; 1 Ci = 37 GBq) and incubating at 30°C.
Crystalization.
Src-ΔU protein stored in liquid nitrogen was thawed at 4°C and aggregates were removed by a brief centrifugation. The protein solution (5 mg/ml), contained 10 mM triethanolamine (pH 7.6), 200 mM NaCl, 1 mM DTT, 1 mM sodium azide, and 0.1 mM sodium orthovanadate. Crystals initially were obtained by vapor diffusion using the hanging drop technique at 4°C with 1 ml of mother liquor in the well solution. The drop was made by mixing 1 μl of the protein solution with 1 μl of the well solution. The well solution consisted of 20–25% PEG2000, 100 mM Tris·HCl (pH 8), 200 mM NaCl, 0.1 mM sodium orthovanadate, 5 mM DTT, 1 mM sodium azide, and sometimes as additive 1-octanol (5% vol/vol) or 2-methyl-2,4-pentanediol (5% vol/vol). Macroseeding then was used to yield crystals of the order 400 × 200 × 100 μm3 reproducibly.
Analytical Ultracentrifugation.
Sedimentation velocity and sedimentation equilibrium runs with purified Src-CD and Src-ΔU were performed with a Beckman analytical ultracentrifuge XLA, equipped with absorption optics. The Src-CD protein used was in the monophosphorylated form (18). The runs were performed in 50 mM triethanolamine, pH 7.6/200 mM NaCl/5 mM DTT/1 mM sodium azide. All runs were done at 20°C. Sedimentation velocity runs were done at 56,000 rpm and 1.1 A276 for Src-CD and 0.2 A276 for Src-ΔU. Sedimentation equilibrium runs were done at 22,000 rpm and 0.4 A278 for Src-CD and 0.2 A278 for Src-ΔU. The molecular masses were calculated from sedimentation equilibrium runs using a computer program that adjusts the baseline absorbance to obtain the best linear fit of lnA versus r2 (A is absorbance, and r is radial distance in the cell). In all cases a partial specific volume of 0.73 cm3/g was used.
Dynamic Light Scattering.
Dynamic light scattering experiments were performed at 4°C with a DynaPro 801 device (ProteinSolutions, United Kingdom). Src-ΔU protein (2 mg/ml) was in buffer A including 200 mM NaCl.
Gel Filtration.
Gel filtration was carried out at 4°C in a column (106 × 1.99 cm2) using Sephadex G75 (Pharmacia) as matrix. The column was equilibrated and eluted with buffer A. Src-ΔU protein (0.5 mg) was loaded on the column. Protein concentration in the fractions was determined by absorbance at 280 nm. Alcohol dehydrogenase (150 kDa), BSA (67 kDa), and chymotrypsinogen (25 kDa) (all about 0.5 mg) were used as standards. The molecular mass of the eluted proteins in the different fractions was confirmed by SDS gel electrophoresis, using low molecular mass standards (Bio-Rad) as reference.
RESULTS
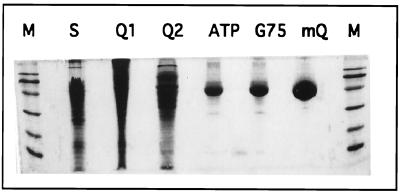
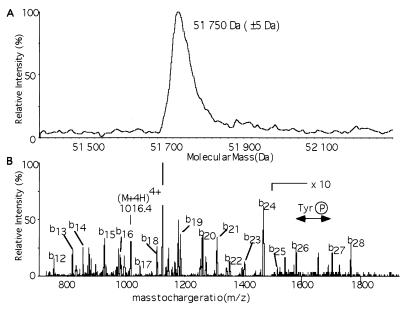
The induction of c-Src expression in fission yeast results in a lethal phenotype. Coexpression of the Csk protein tyrosine kinase causes efficient phosphorylation of Tyr-527, reduction of Src activity, and rescue of the lethal phenotype (16). Using this assay, investigation of the minimal structural requirements within Src for regulation by C-terminal phosphorylation produced Src-ΔU lacking the 80 residue-long unique domain at the N terminus, which was fully active and perfectly regulated by Csk action (9). Expression of Src-ΔU in fission yeast cells corresponded to approximately 1% of the total protein. Five chromatographic steps were required to purify the protein to homogeneity (Table 1 and Fig. 1). The fifth and last step was a MonoQ column that separated Src-ΔU phosphorylated at Tyr-527 from residual contaminations of Csk and Src-ΔU bearing different posttranslational modifications (data not shown). Sequencing by mass spectrometry of the purified Src-ΔU N-terminal tryptic peptide (AGGVTTFVALYDYESR) showed that the N-terminal methionine was missing. The molecular mass of Src-ΔU determined by mass spectrometry was 51,750 ± 5 Da (Fig. 2A), in agreement with the expected value of 51,746.3 Da. The latter was obtained by subtracting the mass of a methionine residue (131 Da, from the N terminus) and adding the mass of a phosphate group (80 Da) to the mass inferred from the amino acid sequence of Src-ΔU (51,797.3 kDa). After tryptic digestion of Src-ΔU only one phosphopeptide was detected by parent ion scan of m/z 79 (data not shown). Sequencing of this peptide confirmed phosphorylation of Tyr-527 (Fig. 2B).
Table 1.
Purification of Src-ΔU
| Step | Total activity, cpm ×10−9 | Total protein, mg | Specific actitivy, (cpm/mg) × 10−5 | Purification factor |
|---|---|---|---|---|
| Supernatant | 88 | 10,000 | 88 | 1 |
| Q-Sepharose 1 | 82 | 4,400 | 186 | 2.1 |
| Q-Sepharose 2 | 76 | 1,800 | 222 | 2.5 |
| ATP affinity | 66 | 35 | 18,860 | 214 |
| G75 gel filtration | 58 | 30 | 19,333 | 220 |
| MonoQ | 14 | 7 | 20,000 | 227 |
Kinase activity was measured in the presence of 1 mM activation peptide (phosphorylated middle T peptide) in 20 μl of reaction mixture and 100 μM of Src substrate peptide. The reaction was carried out for 3 min at 30°C; 15 μl of reaction mixture was pipetted on phosphocellulose units and washed twice with 75 mM phosphoric acid. The radioactivity bound to the filter was counted in a Beckman scintillator. Background incorporation obtained in the absence of enzyme was subtracted from all values.
Figure 1.
Purification of Src-ΔU to homogeneity. Samples from the different purification steps were separated by SDS/PAGE (15%) and stained with Coomassie brilliant blue. The lane designations are: M, molecular mass marker (sizes from top to bottom: 107 kDa, 76 kDa, 52 kDa, 36.8 kDa, 27.2 kDa, 19 kDa); S, supernatant; Q1, first Q Sepharose column; Q2, second Q Sepharose column; ATP, ATP affinity column; G75, G75 gel filtration; MQ, final MonoQ column.
Figure 2.
Mass spectrometric analysis. (A) Deconvoluted mass spectrum of Src-ΔU. The measured molecular mass corresponds to the predicted sequence without the N-terminal methionine and with one phosphorylation site. (B) Product ion scan of the detected phosphopeptide. After the phosphopeptide was detected by parent ion scan for the loss of PO3− in negative ion mode (not shown), the mode of acquisition was switched from negative to positive, and the quadruply charged ion of the detected phosphopeptide (4,062 kDa) was fragmented. Phosphorylation of Tyr-527 was confirmed by a doubly charged b-ion series as indicated.
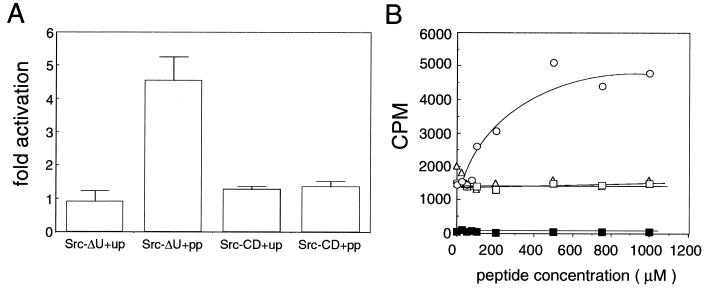
It has been shown previously that incubation of a regulated form of Src with phosphorylated peptides able to bind the SH2 domain results in activation of the enzyme by displacement of the phosphorylated tail from the SH2 domain (12, 13). The same assay was used to investigate whether Src-ΔU, phosphorylated at Tyr-527, was still in the regulated conformation (Fig. 3). The catalytic activity of Src-ΔU phosphorylated at Tyr-527 was approximately 20 times lower than the activity of Src-CD. This basic activity increased about 3- to 4.5-fold by preincubating the enzyme with the phosphorylated middle T antigen peptide (Fig. 3). This agrees well with the 3-fold activation observed with the same peptide using Src either immunoprecipitated from fibroblasts (12) or purified from insect cells and phosphorylated by Csk in vitro (13). The same peptide in the unphosphorylated state showed no activation of Src (Fig. 3). A different phosphorylated peptide, corresponding to the tail of Src showed no activation of Src-ΔU at concentrations up to 10 mM (Fig. 3B and data not shown). This was also observed by Liu et al. (12). Affinity studies performed using peptides very similar to the ones used in this study showed an approximately 45- to 80-fold higher affinity of the middle T peptide for the Src SH2 domain compared with a Src tail peptide (26, 27). Moreover, in competition studies, the Src tail peptide was 104 times less potent in displacing its own interaction with the Src SH2 domain than a middle T peptide (28). Comparison of the phosphorylation kinetics of Src-ΔU and Src-CD (lacking the SH3 and SH2 domain) (Fig. 3A) in the presence of phosphorylated middle T peptide indicated that Src-ΔU, but not Src-CD, could be activated. Src-CD lacks the SH3 and SH2 domain and is not regulated (9). This result confirmed that the effect of the middle T peptide was on regulation of the enzyme by the SH2 domain and not on the catalytic domain itself.
Figure 3.
Activation of Src-ΔU by phosphopeptides. (A) Influence of different peptides on the activity of Src-ΔU and Src-CD. Kinase assays using purified Src-ΔU and Src-CD were carried out in 60 μl of kinase buffer containing 100 μM substrate peptide, 0.02 μM enzyme, and 1 mM activation peptide. After 30 min of preincubation the reaction was started as described in Materials and Methods. After 2, 4, 6, and 8 min, 10-μl samples were pipetted on phosphocellulose units and washed twice with 75 mM phosphoric acid, and treated as described in Table 1. Incorporation was linear over the time range of the experiment. Fold activation for the four different time points was calculated as follows. The counts obtained in the presence of unphosphorylated (up) or phosphorylated (pp) middle T peptide were divided by the counts obtained in the absence of activating peptide. Error bars represent the standard deviation of the four time points. Counts obtained from the control experiments (without enzyme) were subtracted and corresponded to about 0.5% of the Src-CD values and 10% of the Src-ΔU values. (B) Phosphopeptide titration. Different peptides were tested for their ability to activate Src at different concentrations. Assay conditions were the same as in Fig. 3A except that reaction volumes were 20 μl and the reaction time was 3 min. Counts per minute incorporated into the substrate were plotted against the peptide concentration. Phosphorylated (○), unphosphorylated (▵), and polyoma middle T peptide or phosphorylated tail peptide (□) were included in the preincubation at different concentrations as indicated. Control reactions were carried out without enzyme (▪).
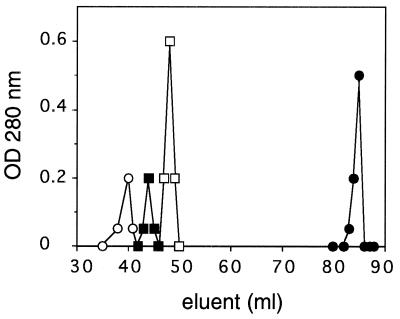
We then set out to test the quaternary structure of regulated Src-ΔU. The crystal structure of the regulatory domains of the Src family member Lck suggested that to achieve regulation, Src family members may form dimers (14). If the regulated Src-ΔU preparation consists of dimers, then it should elute from a G75 gel filtration column at double the value of its molecular mass. Src-ΔU, however, eluted at the monomeric size between BSA (67 kDa) and chymotrypsinogen (25 kDa) (Fig. 4).
Figure 4.
Molecular mass analysis of Src-ΔU by gel filtration. The G75 gel filtration column was calibrated with alcohol dehydrogenase (○, 150 kDa), BSA (▪, 67 kDa), and chymotrypsinogen (•, 30 kDa) in elution buffer (50 mM triethanolamine, pH 7.6/200 mM NaCl/5 mM DTT/1 mm sodium azide). Src-ΔU (□, 0.2 mg/ml) eluted between BSA and chymotrypsinogen.
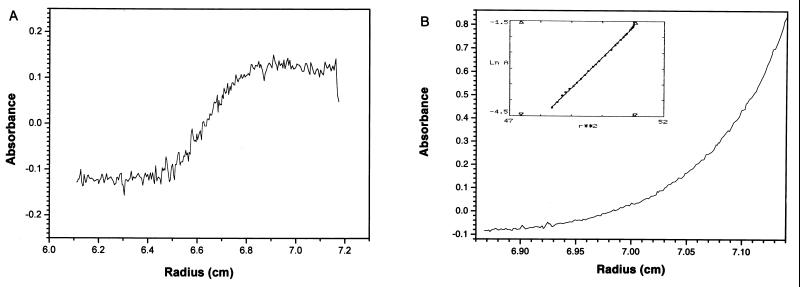
To analyze the oligomeric state of Src in our preparation by a different method, we used dynamic light scattering. This experiment indicated a protein with a radius of 32 ± 7 Å and an approximate molecular mass of 49 kDa. Subsequently we performed sedimentation velocity and sedimentation equilibrium measurements (Fig. 5). The single 3.9S sedimentation boundary of the sedimentation velocity experiment (Fig. 5A) shows that the moving boundary represents a single pure species with no indication for higher aggregates. The sedimentation equilibrium run yielded a plot with a linear relationship of lnA versus r2 (the linear correlation coefficient is 0.99965) representing a single protein species with a molecular mass of 50 ± 2 kDa (Fig. 5B). From the S-value and the molecular mass the f/f0 (f is the frictional coefficient) is calculated to be 1.28, indicating that Src-ΔU is close to spherical in shape. In similar experiments Src-CD also behaved as a monomer and showed a molecular mass of 32 ± 2 kDa.
Figure 5.
Molecular mass analysis of Src-ΔU by analytical ultracentrifugation. (A) Sedimentation velocity. The sedimentation velocity profile of Src-ΔU scanned at 276 nm is taken at 56,000 rpm, 20°C, 112 min after the rotor achieved maximum speed. No higher aggregates or traces of a lower sedimentation fraction can be seen. (B) Sedimentation equilibrium. The sedimentation equilibrium profile of Src-ΔU is recorded at 278 nm, 18,000 rpm, 20°C. The lnA versus r2 plot (A is absorbance and r is the radial distance in the cell) is shown in the Inset.
Finally, Src-ΔU protein was crystalized by vapor diffusion using the hanging drop technique (Fig. 6). The crystals were of an average size of 0.15 × 0.15 × 0.1 mm3, but occasionally grew to 0.4 × 0.2 × 0.1 mm3. The use of a synchrotron x-ray beam allowed the collection of high-resolution data sets from these crystals. However, severe radiation damage made it necessary to establish cryocooling conditions. Good results were obtained by serial transfer of the crystals in drops containing increasing amounts of PEG400 in standard mother liquor (5–30% in steps of 5%). Crystals manipulated in this way diffracted beyond 2.4 Å (1 Å = 10−10 m) resolution. Analysis of the symmetry and systematic extinction of the data sets revealed the space group to be P212121. The spacegroup P212121 has 2-fold screw axes but no crystallographic 2-fold axis. The cell dimensions were a = 54.3 Å, b = 89.0 Å, c = 98.2 Å. For one molecule per asymmetric unit the Matthew’s volume (Vm) was 2.3 Å3/Da. Altogether we therefore could exclude that the Src-ΔU crystals contained dimers, in which the monomers are related by a 2-fold axis.
Figure 6.
Crystal of Src-ΔU phosphorylated at Tyr-527. The crystal was grown in a hanging drop and grew in 3 days at 4°C. The drop contained 100 mM Tris·HCl, 20% PEG2000, 5% 2-methyl-2,4-pentanediol, 200 mM NaCl, 5 mM DTT, 1 mM sodium azide, and 0.1 mM sodium orthovanadate. In the longest dimension the crystal measures 0.4 mm.
DISCUSSION
A considerable amount of information is available about the structural requirements for regulation of Src family protein tyrosine kinases by C-terminal phosphorylation (reviewed in refs. 3 and 4). A large proportion of the data concerns Src, but several important findings either have been confirmed or have originally been obtained with Lck (see ref. 3). The two proteins appear to be regulated the same way. Most likely the same will apply for other members of the family as well, although peculiar features of individual members have been reported (29–31). Moreover, regulation of Src family members by C-terminal phosphorylation appears to be evolutionarily conserved, as both the two Drosophila Src proteins characterized (Src64B and Src41) are at least partially activated by mutation of the tail (32, 33).
In chicken c-Src, absolute requirements for regulation by C-terminal regulation are Tyr-527 in the tail (7), an intact SH2 domain (34, 35), and an intact SH3 domain (reviewed in refs. 3 and 4). SH2 domains interact with phosphotyrosine-containing motifs with different affinities, depending on the sequence context (reviewed in ref. 36). Discovery of the phosphotyrosine-binding property of SH2 domains taken together with the inhibitory role of Tyr-527 phosphorylation, led to the hypothesis that the SH2 domain and Tyr-527 interact to regulate the activity of the enzyme (8). Indeed, Src phosphorylated at Tyr-527 binds more weakly to peptides able to bind its SH2 domain than does the dephosphorylated form, suggesting that the SH2 domain binds to the phosphorylated tail (37). Displacement of this interaction by peptides binding the SH2 domain or by antibodies binding to the C terminus results in an increase in the activity of the enzyme (12, 38). Moreover, experiments of protease sensitivity have produced evidence for a conformational change between the Tyr-527-phosphorylated form and the dephosphorylated form of Src (39).
Point mutations or deletions of the SH3 domain render c-Src oncogenic in chicken embryo fibroblasts (40–42) and destabilize the SH2-phosphorylated tail interaction (16, 43, 44). Detailed mutagenic analysis has shown that it is the ligand binding surface of the SH3 domain to be involved in Src regulation (17). Physical interactions and cooperative binding between the SH3 and SH2 domain of Src family members have been detected and potentially could explain the involvement of the SH3 domain in Src regulation (27, 28). However, the structural constraints imposed by the short linker between the two domains, revealed by the crystal structure of the SH3-SH2 domain of Lck, makes it extremely unlikely that the SH3 domain binds to the SH2 domain of the same molecule (14). The same crystal structure shows an interaction of the phosphorylated Lck tail peptide with the SH2 and SH3 domains of two different molecules, suggesting that regulated Src family members may be dimers (14). The data presented here strongly argue against this. We have purified a form of Src that is perfectly regulated by Csk action in a yeast functional assay (9). Throughout the purification, phosphorylation at Tyr-527 was maintained. To test the state of the regulated form we performed what we consider the most stringent assay, i.e. reactivation of catalytic activity with SH2-domain binding peptides. The degree of activation we obtained was comparable with preparations of regulated Src obtained by completely different methods, like immunoprecipitation from mammalian cells (where the vast majority of Src is phosphorylated at Tyr-527, ref. 12) or purified from insect cells and phosphorylated in vitro (13). We performed three independent assays to test the monomeric/dimeric state of this form of Src. In all assays, Src behaved unequivocally as a monomer both at 4°C and at room temperature. Finally, the Src protein crystals we obtained do not contain Src dimers. Intramolecular interaction of a phosphotyrosine residue and an SH2 domain has been demonstrated directly within the Crk adapter molecule using a combination of physical techniques (45). While the Crk study very conclusively demonstrated the occurrence of intramolecular SH2-phosphotyrosine interactions, it may bear only limited relevance to Src regulation. Besides the SH2 and SH3 domains, Crk bears no homology to Src, has no known catalytic activity, and the phosphotyrosine-SH2 domain interaction is much stronger than in Src (46). The data presented here argue that Src regulation occurs within a monomer. This implies that not only the SH2 domain-phosphorylated tail interaction, but also the SH3 domain interaction with a yet unidentified part of Src, are intramolecular in nature. Thus, phosphorylation of Src at the C-terminal tyrosine triggers a structural rearrangement that has multiple functional consequences. The catalytic activity of the kinase domain is reduced, and the protein–protein interaction domains SH2 and SH3 become inert through intramolecular engagements. While solving the structure of the crystals described here will show the molecular details of the Src intramolecular interactions, it also may reveal general mechanisms of protein kinase regulation.
Acknowledgments
We thank Katarina Jönsson for help in the manipulation of yeast strains, Andy Thompson at the European Synchrotron Radiation Facility, Grenoble, and Ana Gonzalez at Deutsches Elektronen Synchrotron in Hamburg for the data collection. We are also very grateful to Ariel Lustig, Biozentrum Basel, for the analytical ultracentrifugation experiments. A.W. and J.W. are recipients of a European Community Fellowship and a von Humboldt Fellowship, respectively.
References
- 1.Hunter T. Cell. 1995;80:225–236. doi: 10.1016/0092-8674(95)90405-0. [DOI] [PubMed] [Google Scholar]
- 2.Collett M S, Brugge J S, Erikson R L. Cell. 1978;15:1363–1369. doi: 10.1016/0092-8674(78)90061-2. [DOI] [PubMed] [Google Scholar]
- 3.Brown M T, Cooper J A. Biochim Biophys Acta. 1996;1287:121–149. doi: 10.1016/0304-419x(96)00003-0. [DOI] [PubMed] [Google Scholar]
- 4.Superti-Furga G. FEBS Lett. 1995;369:62–66. doi: 10.1016/0014-5793(95)00636-n. [DOI] [PubMed] [Google Scholar]
- 5.Lowell C A, Soriano P. Genes Dev. 1996;10:1845–1857. doi: 10.1101/gad.10.15.1845. [DOI] [PubMed] [Google Scholar]
- 6.Courtneidge S A. EMBO J. 1985;4:1471–1477. doi: 10.1002/j.1460-2075.1985.tb03805.x. [DOI] [PMC free article] [PubMed] [Google Scholar]
- 7.Hunter T. Cell. 1987;49:1–4. doi: 10.1016/0092-8674(87)90745-8. [DOI] [PubMed] [Google Scholar]
- 8.Matsuda M, Mayer B J, Fukui Y, Hanafusa H. Science. 1990;248:1537–1539. doi: 10.1126/science.1694307. [DOI] [PubMed] [Google Scholar]
- 9.Koegl M, Courtneidge S A, Superti-Furga G. Oncogene. 1995;11:2317–2329. [PubMed] [Google Scholar]
- 10.Erpel T, Courtneidge S A. Curr Biol. 1995;7:176–182. doi: 10.1016/0955-0674(95)80025-5. [DOI] [PubMed] [Google Scholar]
- 11.Alexandropoulos K, Baltimore D. Genes Dev. 1996;10:1341–1355. doi: 10.1101/gad.10.11.1341. [DOI] [PubMed] [Google Scholar]
- 12.Liu X, Brodeur S R, Gish G, Songyang Z, Cantley L C, Laudano A P, Pawson T. Oncogene. 1993;8:1119–1126. [PubMed] [Google Scholar]
- 13.Alonso G, Koegl M, Mazurenko N, Courtneidge S A. J Biol Chem. 1995;270:9840–9848. doi: 10.1074/jbc.270.17.9840. [DOI] [PubMed] [Google Scholar]
- 14.Eck M J, Atwell S K, Shoelson S E, Harrison S C. Nature (London) 1994;368:764–769. doi: 10.1038/368764a0. [DOI] [PubMed] [Google Scholar]
- 15.Heldin C-H. Cell. 1995;80:213–223. doi: 10.1016/0092-8674(95)90404-2. [DOI] [PubMed] [Google Scholar]
- 16.Superti-Furga G, Fumagalli S, Koegl M, Courtneidge S A, Draetta G. EMBO J. 1993;12:2625–2634. doi: 10.1002/j.1460-2075.1993.tb05923.x. [DOI] [PMC free article] [PubMed] [Google Scholar]
- 17.Erpel T, Superti-Furga G, Courtneidge S A. EMBO J. 1995;14:963–975. doi: 10.1002/j.1460-2075.1995.tb07077.x. [DOI] [PMC free article] [PubMed] [Google Scholar]
- 18.Weijland A, Neubauer G, Courtneidge S A, Mann M, Wierenga R K, Superti-Furga G. Eur J Biochem. 1996;240:756–764. doi: 10.1111/j.1432-1033.1996.0756h.x. [DOI] [PubMed] [Google Scholar]
- 19.Haystead C M, Gregory P, Sturgill T W, Haystead T A. Eur J Biochem. 1993;214:459–467. doi: 10.1111/j.1432-1033.1993.tb17942.x. [DOI] [PubMed] [Google Scholar]
- 20.Wilm M, Mann M. Int J Mass Spectrom Ion Processes. 1994;136:167–180. [Google Scholar]
- 21.Wilm M, Mann M. Anal Chem. 1996;66:1–8. doi: 10.1021/ac9509519. [DOI] [PubMed] [Google Scholar]
- 22.Wilm M, Neubauer G, Mann M. Anal Chem. 1996;68:527–533. doi: 10.1021/ac950875+. [DOI] [PubMed] [Google Scholar]
- 23.Songyang Z, Carraway K L I, Eck M J, Harrison S C, Feldman R A, Mohammadi M, Schlessinger J, Hubbard S R, Smith D P, Eng C, Lorenzo M J, Ponder B A J, Mayer B J, Cantley L C. Nature (London) 1995;373:536–539. doi: 10.1038/373536a0. [DOI] [PubMed] [Google Scholar]
- 24.Songyang Z, Shoelson S E, Chaudhuri M, Gish G, Pawson T, Haser W G, King F, Roberts T, Ratnofsky S, Lechleider R J, Neel B G, Birge R B, Fajardo J E, Chou M M, Hanafusa H, Schaffhausen B, Cantley L C. Cell. 1993;72:767–778. doi: 10.1016/0092-8674(93)90404-e. [DOI] [PubMed] [Google Scholar]
- 25.Bradford M M. Anal Biochem. 1976;72:248–254. doi: 10.1016/0003-2697(76)90527-3. [DOI] [PubMed] [Google Scholar]
- 26.Payne G, Shoelson S E, Gish G D, Pawson T, Walsh C T. Proc Natl Acad Sci USA. 1993;90:4902–4906. doi: 10.1073/pnas.90.11.4902. [DOI] [PMC free article] [PubMed] [Google Scholar]
- 27.Panchamoorthy G, Fukazawa T, Stolz L, Payne G, Reedquist K, Shoelson S, Songyang Z, Cantley L, Walsh C, Band H. Mol Cell Biol. 1994;14:6372–6385. doi: 10.1128/mcb.14.9.6372. [DOI] [PMC free article] [PubMed] [Google Scholar]
- 28.Bibbins K B, Boeuf H, Varmus H E. Mol Cell Biol. 1993;13:7278–7287. doi: 10.1128/mcb.13.12.7278. [DOI] [PMC free article] [PubMed] [Google Scholar]
- 29.Ruzzene M, James P, Brunati A M, Donella-Deana A, Pinna L A. J Biol Chem. 1994;269:15885–15891. [PubMed] [Google Scholar]
- 30.Rivero-Lezcano O M, Marcilla A, Robbins K C. Oncogene. 1995;11:2675–2679. [PubMed] [Google Scholar]
- 31.Abrams C S, Zhao W. J Biol Chem. 1995;270:333–339. doi: 10.1074/jbc.270.1.333. [DOI] [PubMed] [Google Scholar]
- 32.Kussick S J, Basler K, Cooper J A. Oncogene. 1993;8:2791–2803. [PubMed] [Google Scholar]
- 33.Takahashi F, Endo S, Kojima T, Saigo K. Genes Dev. 1996;10:1645–1656. doi: 10.1101/gad.10.13.1645. [DOI] [PubMed] [Google Scholar]
- 34.O’Brien M C, Fukui Y, Hanafusa H. Mol Cell Biol. 1990;10:2855–2862. doi: 10.1128/mcb.10.6.2855. [DOI] [PMC free article] [PubMed] [Google Scholar]
- 35.Hirai H, Varmus H E. Mol Cell Biol. 1990;10:1307–1318. doi: 10.1128/mcb.10.4.1307. [DOI] [PMC free article] [PubMed] [Google Scholar]
- 36.Pawson T. Nature (London) 1995;373:573–580. doi: 10.1038/373573a0. [DOI] [PubMed] [Google Scholar]
- 37.Roussel R R, Brodeur S R, Shalloway D, Laudano A P. Proc Natl Acad Sci USA. 1991;88:10696–10700. doi: 10.1073/pnas.88.23.10696. [DOI] [PMC free article] [PubMed] [Google Scholar]
- 38.Cooper J A, King C S. Mol Cell Biol. 1986;6:4467–4477. doi: 10.1128/mcb.6.12.4467. [DOI] [PMC free article] [PubMed] [Google Scholar]
- 39.MacAuley A, Cooper J A. Mol Cell Biol. 1989;9:2648–2656. doi: 10.1128/mcb.9.6.2648. [DOI] [PMC free article] [PubMed] [Google Scholar]
- 40.Kato J, Takeya T, Grandori C, Iba H, Levy J B, Hanafusa H. Mol Cell Biol. 1986;6:4155–4160. doi: 10.1128/mcb.6.12.4155. [DOI] [PMC free article] [PubMed] [Google Scholar]
- 41.Potts W M, Reynolds A B, Lansing T J, Parsons J T. Oncogene Res. 1988;3:343–355. [PubMed] [Google Scholar]
- 42.Seidel-Dugan C, Meyer B E, Thomas S M, Brugge J S. Mol Cell Biol. 1992;12:1835–1845. doi: 10.1128/mcb.12.4.1835. [DOI] [PMC free article] [PubMed] [Google Scholar]
- 43.Murphy S M, Bergman M, Morgan D O. Mol Cell Biol. 1993;13:5290–5300. doi: 10.1128/mcb.13.9.5290. [DOI] [PMC free article] [PubMed] [Google Scholar]
- 44.Okada M, Howell B, Broome M A, Cooper J A. J Biol Chem. 1993;268:18070–18075. [PubMed] [Google Scholar]
- 45.Rosen M K, Yamazaki T, Gish G D, Kay C M, Pawson T, Kay L E. Nature (London) 1995;374:477–479. doi: 10.1038/374477a0. [DOI] [PubMed] [Google Scholar]
- 46.Feller S M, Knudsen B, Hanafusa H. EMBO J. 1994;13:2341–2351. doi: 10.1002/j.1460-2075.1994.tb06518.x. [DOI] [PMC free article] [PubMed] [Google Scholar]


