

Abstract
The repair of DNA double-strand breaks (DSBs) is facilitated by the phosphorylation of H2AX, which organizes DNA damage signaling and chromatin remodeling complexes in the vicinity of the lesion (Pilch, D.R., O.A. Sedelnikova, C. Redon, A. Celeste, A. Nussenzweig, and W.M. Bonner. 2003. Biochem. Cell Biol. 81:123–129; Morrison, A.J., and X. Shen. 2005. Cell Cycle. 4:568–571; van Attikum, H., and S.M. Gasser. 2005. Nat. Rev. Mol. Cell. Biol. 6:757–765). The disruption of DNA integrity induces an alteration of chromatin architecture that has been proposed to activate the DNA damage transducing kinase ataxia telangiectasia mutated (ATM; Bakkenist, C.J., and M.B. Kastan. 2003. Nature. 421:499–506). However, little is known about the physical properties of damaged chromatin. In this study, we use a photoactivatable version of GFP-tagged histone H2B to examine the mobility and structure of chromatin containing DSBs in living cells. We find that chromatin containing DSBs exhibits limited mobility but undergoes an energy-dependent local expansion immediately after DNA damage. The localized expansion observed in real time corresponds to a 30–40% reduction in the density of chromatin fibers in the vicinity of DSBs, as measured by energy-filtering transmission electron microscopy. The observed opening of chromatin occurs independently of H2AX and ATM. We propose that localized adenosine triphosphate–dependent decondensation of chromatin at DSBs establishes an accessible subnuclear environment that facilitates DNA damage signaling and repair.
Introduction
A longstanding question in the study of the cellular response to DNA damage is how the complex structural environment of chromatin is altered in the presence of DNA lesions (Bakkenist and Kastan, 2004; Peterson and Cote, 2004). The basic repeating unit of chromatin, the nucleosome, consists of DNA wrapped around an octamer of core histones, which is composed of two molecules each of the histones H2A, H2B, H3, and H4. Nucleosomal DNA is dynamically packaged to varying degrees, resulting in different levels of chromatin compaction ranging from the 10-nm fiber to higher order structures such as the condensed mitotic chromosomes. Prior biochemical evidence suggests that chromatin structure is remodeled in the presence of double-strand breaks (DSBs; Smerdon et al., 1978; Jaberaboansari et al., 1988; Sidik and Smerdon, 1990). Similarly, the exposure of cells to UV irradiation appears to relax bulk chromatin structure within the entire nucleus (Hittelman and Pollard, 1984; Ljungman, 1989; Rubbi and Milner, 2003). In addition to these global changes, local perturbations in chromatin, such as the exposure of preexisting methylated residues in core histones in the vicinity of the break (Huyen et al., 2004; Sanders et al., 2004) as well as DNA damage–induced histone modifications, may provide docking sites for DNA damage response proteins (Peterson and Cote, 2004). For example, dynamic changes in histone acetylation (Bird et al., 2002; Qin and Parthun, 2002; Downs et al., 2004; Jazayeri et al., 2004; Tamburini and Tyler, 2005; Murr et al., 2006) and phosphorylation (Rogakou et al., 1998; Fernandez-Capetillo et al., 2004a; Kusch et al., 2004) on chromatin flanking DSBs may control the accessibility of damaged regions of DNA to repair/signaling proteins, including chromatin remodeling complexes.
The best characterized DNA damage–induced histone modification is the phosphorylation of the core histone variant H2AX (γ-H2AX; Rogakou et al., 1998; Fernandez-Capetillo et al., 2004b), which extends to large chromatin domains flanking each DSB (Rogakou et al., 1999; Downs et al., 2004; Shroff et al., 2004). Although the presence of H2AX is not required for the initial recognition of DSBs (Celeste et al., 2003), γ-H2AX organizes the dynamic assembly of multiprotein complexes into cytologically visible nuclear foci (Paull et al., 2000; Bassing et al., 2002; Celeste et al., 2002). The physical structure and composition of γ-H2AX–containing chromatin domains is unknown, but the phosphorylation of H2AX has been linked to an increased chromatin relaxation in Saccharomyces cerevisiae (Downs et al., 2000), whereas in contrast, mouse H2AX is required for chromatin condensation and transcriptional silencing of the male sex chromosomes during spermatogenesis (Fernandez-Capetillo et al., 2003). In addition, several chromatin remodeling complexes, including INO80 (Morrison et al., 2004; van Attikum et al., 2004) and NuA4/Tip60 (Downs et al., 2004; Kusch et al., 2004; Tsukuda et al., 2005), as well as key structural components (such as cohesin; Strom et al., 2004; Unal et al., 2004) assemble on chromatin in a γ-H2AX–dependent manner. Together, these observations indicate that the phosphorylation of H2AX may directly or indirectly modulate chromatin architecture in the vicinity of a DSB, which is a hypothesis tested in this study.
Results
Mobility of chromatin containing DNA DSBs in living cells
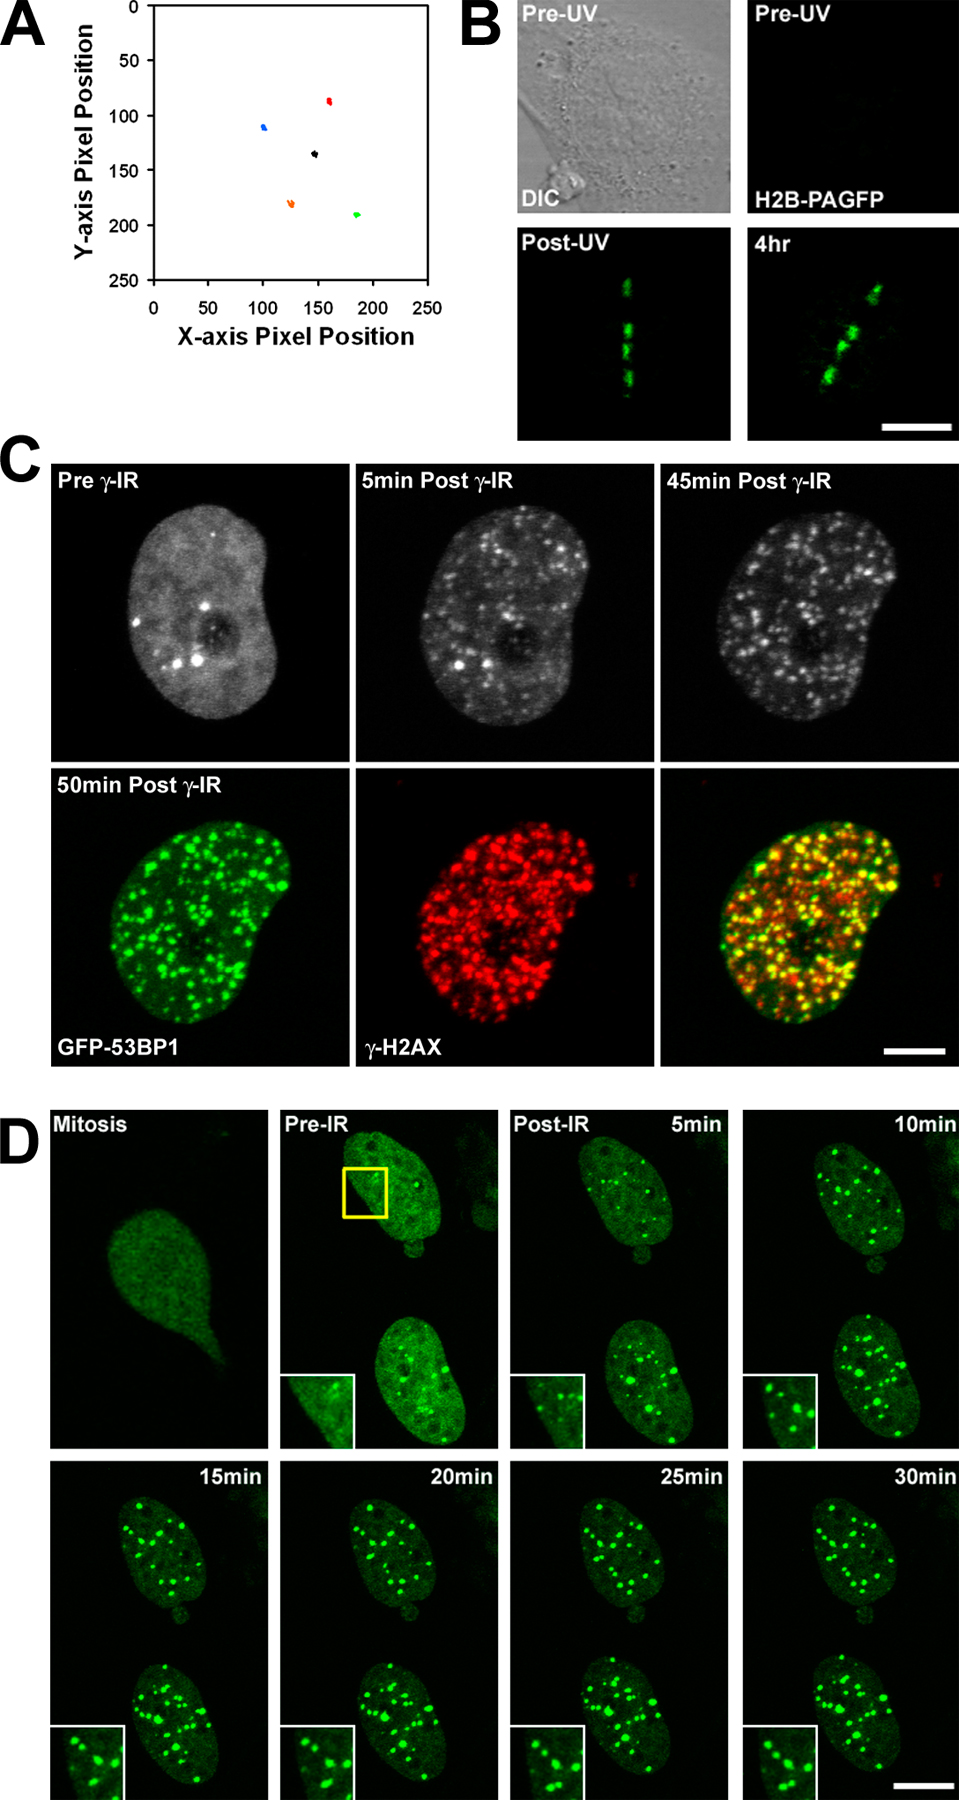
DNA damage–induced chromatin remodeling may account for the movement of DSB-containing chromatin domains, which is indicated by the congregation of multiple DSBs into DNA repair centers in S. cerevisiae (Lisby et al., 2003) and by the clustering of γ-H2AX foci within tracks of DSBs in mammalian cells (Aten et al., 2004). To directly monitor the mobility of chromatin containing DSBs in vivo, we expressed histone H2B tagged with a photoactivatable version of GFP (PAGFP; Patterson and Lippincott-Schwartz, 2002) in wild-type (WT) and H2AX−/− mouse embryo fibroblasts (MEFs; Celeste et al., 2002). All of the core histones, including H2B, are tightly bound to DNA and are immobile over relatively long time periods and, thereby, provide excellent markers for chromatin in living cells (Kanda et al., 1998; Kimura and Cook, 2001; Siino et al., 2002). By using the 364-nm emission from a UV laser on a confocal microscope, we simultaneously introduced localized DNA DSBs within the nucleus of cells and photoactivated H2B-PAGFP. As expected, the introduction of DSBs, monitored by the formation of γ-H2AX and the recruitment of Nbs1 in fixed cells, was dependent on sensitizing the cells with the Hoechst 33342 DNA-binding dye (WT + Hoechst and H2AX−/− + Hoechst; Celeste et al., 2003), whereas H2B-PAGFP was photoactivated regardless of the presence of the dye (Fig. 1 A).
Figure 1.

The distribution and mobility of DSBs in living WT and H2AX−/− MEFs. (A) WT and H2AX−/− MEFs expressing H2B-PAGFP were photoactivated with UV laser microirradiation in specific regions (circles and lines) within the nucleus (first row). DNA DSBs were introduced when cells were incubated with Hoechst 33342 DNA-binding dye (fourth row), as shown by γ-H2AX staining in WT cells (second row) and Nbs1 staining in WT and H2AX−/− cells (third row). Bar, 30 μm. (B) WT MEFs expressing H2B-PAGFP were UV laser irradiated to photoactivate PAGFP and introduce DNA DSBs in subnuclear regions that were monitored over a 60-min time period. In the pre-UV panel, the green outline denotes the boundary of the nucleus, and the red circles denote UV laser–irradiated regions. Bar, 15 μm. (C) Mean squared displacement of the center of mass intensities of circular photoactivated and DSB-containing or solely photoactivated regions from their original position immediately after exposure to UV laser microirradiation until 10 min after irradiation. Image series were corrected for background and overall cellular migration by image registration before the calculation of center of mass intensities. Displacement values were calculated for WT with DSBs (triangles), WT without DSBs (circles), H2AX−/− with DSBs (Xs), and H2AX−/− without DSBs (squares). At least 40 cells were examined for each genotype and treatment. No significant difference was found between the mean squared displacement of regions containing or lacking DSBs (P > 0.25). Error bars represent SD. (D) WT MEFs expressing GFP-53BP1 were irradiated with 10 Gy γ irradiation and immediately placed on a heating stage of the LSM microscope. Foci, which appeared within 5 min, were tracked for 50 min. The yellow box denotes the region zoomed in the top right corner inset. The insets show multiple IRIF within close proximity to each other that frequently interact but then subsequently separate (yellow arrow). Bar, 5 μm.
To evaluate the dynamics of chromatin domains containing DSBs in living cells, we photoactivated and induced DNA damage in specific subregions in the nucleus with distinctive patterns of circles and lines that allowed us to observe and quantify any potential dynamic movement or change in shape (Fig. 1, B and C; Figs. S1 and S2; and Videos 1 and 2; available at http://www.jcb.org/cgi/content/full/jcb.200510015/DC1). After compensating for cell migration and rotation, we measured the center of intensity mass for each lased region and calculated the mean squared displacement over a 10-min time period in samples in which DSBs were either introduced or not introduced (Fig. 1 C and Fig. S1). In both WT and H2AX−/− cells (+Hoechst), the overall pattern and position of photoactivated regions did not change significantly (mean squared displacement of <0.5 μm2) even though the chromatin domains exhibited some small-scale constrained dynamics. Moreover, we did not detect significant movement of chromatin regions containing DSBs over longer time periods, including up to 4 h after irradiation (Fig. 1 B and Fig. S1). Thus, the positioning of chromatin domains containing DSBs generated by UV laser microirradiation is stable over time.
To examine the mobility of γ-irradiation–induced foci (IRIF) immediately after they form, we introduced DNA damage by γ-irradiation and monitored the spatial position of GFP-53BP1 (Huyen et al., 2004). Like endogenous 53BP1, GFP-53BP1 forms foci within minutes at sites of DSBs as determined by staining with γ-H2AX (Fig. S1; Huyen et al., 2004). After their initial appearance, GFP-53BP1 IRIF exhibited limited diffusional motion with a mean squared displacement of 0.9 μm2 over the 50-min time period monitored (3 × 10⁻⁴ μm2/s). This is similar to the range of movement of individual loci observed in undamaged human cells (Chubb et al., 2002). Although IRIF did not congregate within common sites in the nucleus, they did exhibit local small-scale dynamics, with IRIF within close proximity to each other frequently interacting but subsequently separating to their own nuclear space (Fig. 1 D, Fig. S1, and Video 3, available at http://www.jcb.org/cgi/content/full/jcb.200510015/DC1). This behavior occurred in a cell cycle–independent manner. In cells (n = 10) that we followed through mitosis and into early G1 and subsequently γ irradiated, we found that 53BP1 foci did not exhibit significant mobility compared with other irradiated interphase cells, nor did the foci appear to exhibit an increased propensity to associate in distinct subregions of the nucleus (Fig. S1). Similarly, early interphase cells exposed to localized UV laser microirradiation did not exhibit increased chromatin mobility compared with other interphase cells (not depicted). Collectively, our results indicate that DSBs generated by UV laser or γ irradiation do not exhibit large-scale mobility or strong cohesiveness.
Changes in chromatin upon the introduction of DNA DSBs
Despite the lack of large-scale genomic repositioning, simple visual inspection revealed that the photoactivated and DSB-containing chromatin regions underwent local expansion of photoactivated chromatin outside of the initial damaged zone (Fig. 2 A, Fig. S2, and Video 1). This expansion occurred immediately upon the introduction of DSBs and continued until 180 s after exposure to UV microirradiation, corresponding to a time interval in which DNA repair factors such as Nbs1 (Fig. 1 A) and ataxia telangiectasia mutated (ATM; see Fig. 4) are recruited to sites of DSBs. The persistence of photoactivated H2B in defined DNA damaged regions 4 h after UV laser microirradiation indicates that minimal amounts of H2B are released from chromatin containing DSBs (Fig. S1). Furthermore, we observed a similar expansion of H3-GFP in chromatin containing DSBs, which was confined to areas immediately surrounding regions exposed to UV laser microirradiation (Fig. 2 B). Importantly, these changes in chromatin structure were dependent on the presence of DSBs because they did not occur in photoactivated regions in cells lacking Hoescht sensitizing dye (Fig. S2 and Video 2). The change in area occupied by photoactivated chromatin corresponded to a 30% increase relative to the initial damaged area and occurred similarly in WT, H2AX−/−, and ATM−/− cells (Fig. 2 F). Thus, DSBs induce a local chromatin expansion that does not depend on the presence of either H2AX or ATM.
Figure 2.

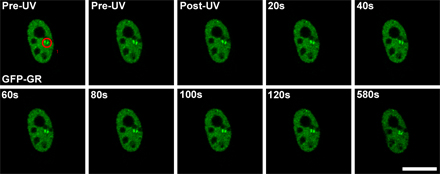
Local expansion in chromatin structure upon the introduction of DSBs. (A) Specific subnuclear regions were photoactivated, and DSBs were introduced in H2AX−/− cells by UV laser microirradiation. A nucleus with four circular and one rectangular region is shown with the arrow in the post-UV image, denoting the zoomed circular region presented in the top right and bottom left corner insets. Binary maps for each time point were generated, and the map for the post-UV image (set as white) was superimposed onto the maps (set as green) for each subsequent time point (bottom left inset). The pre-UV image shows the outline of the nucleus in green and the prephotoactivated and DSB-containing regions in red. Bar, 15 μm. (B) H2AX−/− MEFs expressing H3-GFP were incubated with Hoechst dye, and a subregion of the GFP signal was photobleached using the 488-nm laser (red square, left). Subsequently, two flanking regions were exposed to UV laser microirradiation (two white squares, left), and the cell was followed for 180 s after UV laser microirradiation (right). Binary maps for the GFP signal above background were generated and colored white for the pre-488/pre-UV and post-488/pre-UV images (shown in the second row and at higher magnification in the bottom row). Binary maps for the post-UV and 180 s post-UV images were colored green and super imposed onto the white binary map from the post-488/pre-UV image. The difference in area between the post-UV and 180 s post-UV images is shown in green relative to the white images in the bottom two rows. The chromatin regions containing DSBs expand into the nondamaged region, whereas the nondamaged regions above the photobleached GFP square do not display any expansion. Bar, 5 μm. (C) A nucleus containing two copies of the MMTV gene array and expressing GFP-GR localized to the nucleus was exposed to UV laser microirradiation in only one of the two gene arrays, shown as a red circle in the left image and in the top corner inset. The nondamaged gene array is denoted by the white arrow and in the bottom corner inset. Bar, 15 μm. (D) MMTV gene array–containing cells similar to those described in Fig. 2 C, but 90 s after exposure to UV laser microirradiation, they were fixed and DNA FISH was performed probing for the gene array, as shown in the right panel. The two cells shown have a single copy of the gene array. Red circles in the left image denote gene arrays exposed to UV laser microirradiation. Bar, 15 μm. (E) Area of nondamaged MMTV arrays and DNA FISH. Cells containing the MMTV gene array and expressing GFP-GR localized to the nucleus were sensitized by the Hoechst dye but not exposed to UV laser microirradiation. DNA FISH was performed using MMTV gene array–specific probes, and fluorescence images were collected. Bar, 10 μm. (F) Measurements of the expansion in area for photoactivated H2B-PAGFP subnuclear regions in damaged and nondamaged WT (with or without ATP depletion), H2AX−/−, and ATM−/− live cells. Measured starting area of circular regions was ∼7.08 μm2 for all samples. (G) Area occupied by MMTV gene arrays in living cells and after DNA FISH in both damaged and nondamaged gene arrays.
Figure 4.

ATM kinase at chromatin containing DSBs. (A) HeLa cells expressing H2B-PAGFP were fixed either 15, 60, 150, or 600 s after exposure to UV laser microirradiation and stained for both ATM phospho-Ser 1981 (ATM-1981p, top) and γ-H2AX (bottom). A control, non–UV laser–irradiated nucleus is shown in the first column. Line profiles of background-corrected mean pixel intensities were plotted for ATM-1981p staining in each nucleus (middle). The arrows (top) indicate the direction of the individual line scans. Bar, 15 μm. (B) Intensity of ATM-1981p in different subregions of UV laser–irradiated HeLa cells relative to cells not exposed to the UV laser at different time points after UV as displayed in A. Background-corrected mean pixel intensity of areas within the UV laser–irradiated region (in), outside the laser-exposed region of the same cell (out), and in a nucleus not exposed to the UV laser (non) were used to calculate the ratios shown (in/out, in/non, and out/non, respectively). Ratios were calculated for 15 s (black), 60 s (gray), 2.5 min (white), 10 min (forward slash), and 15 min (back slash) after exposure to UV laser irradiation. Error bars represent SD.
To determine whether a linear stretch of transcriptionally active chromatin reacts in a similar manner, we targeted DSBs to tandem gene arrays containing a series of promoter binding sites for the gluccocorticoid receptor (GR) in a cell line expressing the GFP-tagged GR (GFP-GR; McNally et al., 2000). Upon incubation with the steroid hormone dexamethasone, GFP-GR translocates to the nucleus and binds to the gene array, allowing for visual detection of the array inside the nucleus. We observed that localized DNA damage caused a rapid dispersion of the GFP-GR signal assembled at the gene array (Fig. 2 C). By examining a cell with two gene arrays and introducing DSBs in only one of the arrays, we determined that the introduction of DSBs in a subregion of the nucleus did not cause a global change in chromatin structure because the nondamaged gene array did not exhibit any significant changes in morphology (Fig. 2 C). Moreover, there was no dispersion of GFP-GR signal when cells were UV microirradiated in the absence of Hoechst (Fig. S3, available at http://www.jcb.org/cgi/content/full/jcb.00510015/DC1). Thus, chromatin changes that occur in the damaged gene array are localized to that subregion of the nucleus, whereas the chromatin configuration in nonlased or nondamaged gene arrays did not change over the same period.
The observed change in chromatin gene array density may be caused by DNA damage–induced chromatin opening such that the bound GFP-GR signal is no longer concentrated sufficiently to detect above background nucleoplasmic levels of GFP-GR fluorescence. A nonmutually exclusive possibility is that GFP-GR may dissociate from the array. To discriminate between these possibilities, we performed DNA FISH with gene array–specific probes and measured the relative area occupied by the nondamaged (pre-UV) and damaged regions within the same nuclei (Fig. 2 D). As summarized in Fig. 2 G, the FISH signal (180 s after UV) occupied a greater area than that occupied by GFP-GR before exposure to UV microirradiation and a greater area than control FISH signals in cells not exposed to UV microirradiation (Fig. 2 E). The finding that damaged gene arrays occupied a greater area than before UV laser microirradiation indicates that specific chromatin regions that are transcriptionally competent undergo further remodeling upon the introduction of DSBs. We conclude that the changes observed in the gene arrays in living cells are the result, at least in part, of chromatin decondensation.
The laser microirradiation experiments were performed at the lowest doses (∼0.86 nJ/pixel) that yielded a consistent γ-H2AX signal. By measuring the whole cell γ-H2AX response to γ irradiation, we established a standard curve that was used to calibrate the extent of DNA damage induced by the UV laser (Fig. S4, available at http://www.jcb.org/cgi/content/full/jcb.200510015/DC1). By this method, we estimate that the level of γ irradiation required to induce the same density of H2AX phosphorylation throughout the nucleus as laser microirradiation within the circular regions (Fig. 2, A, C, and D) is ∼2.5 Gy. Assuming that 1 Gy produces 35 DSBs, this equates to 85 DSBs localized to a specific subregion of the nucleus, corresponding to a density of ∼1 DSB for every 0.95 Mb DNA. This degree of DNA damage would not be expected to extensively fragment the chromatin; otherwise, H2B-PAGFP would have been mobile, and the signal would have eventually dispersed. Instead, we found that the H2B-PAGFP signal remained within the locally irradiated region and that the integrated intensity of fluorescence did not change over time. The most likely explanation for the expansion is that DSBs induce a local decondensation of chromatin. Examining the damaged regions in greater detail by electron microscopy further supported this interpretation.
Changes in chromatin containing DSBs monitored at high resolution by EFTEM
To monitor chromatin changes associated with DSBs at high resolution, we used correlative fluorescence and energy-filtering transmission EM (EFTEM; Spencer et al., 2000; Ren et al., 2003; Dellaire et al., 2004). In brief, electron spectroscopic imaging (ESI) with an energy-filtering transmission electron microscope generates element-specific maps of the specimen. Nucleic acid–containing structures are both phosphorus and nitrogen rich, whereas protein-based structures are nitrogen rich and phosphorus poor. By obtaining phosphorus and nitrogen image maps and examining the phosphorus and nitrogen content, nucleic acid–containing structures such as chromatin can be distinguished from primarily protein-based structures in intact nuclei (Bazett-Jones and Hendzel, 1999; Hendzel et al., 1999). Combining fluorescence microscopy with ESI, we were able to monitor specific subregions of the nucleus in living cells and examine the same regions at high resolution by EM. WT and H2AX −/− cells exposed to γ irradiation or UV laser microirradiation were analyzed using this correlative ESI method.
After introducing DSBs with the UV laser, WT and H2AX−/− cells were fluorescently labeled with anti−γ-H2AX or -Nbs1 antibodies and embedded, and ultrathin sections of the cells were imaged using the light microscope to collect a fluorescence map of the chromatin regions containing DSBs. The same sections were then imaged using the ESI mode of EFTEM, and nitrogen (Fig. 3, green) and phosphorus (Fig. 3, red) elemental maps were generated. The fluorescence image of the γ-H2AX or Nbs1 signal was resampled and overlaid onto a low magnification composite ESI-generated net phosphorus image map (Fig. 3, grayscale; white signal on black background). Subsequently, specific regions were examined at high magnification that were sufficient to resolve individual chromatin fibers.
Figure 3.

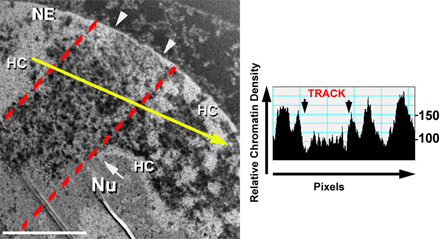
Ultrastructure of chromatin containing DSBs. (A) WT cells exposed to UV laser microirradiation and containing DSBs were labeled against γ-H2AX to mark DSBs, which is shown by green fluorescence track overlaid onto the low magnification ESI net phosphorus image in the top left panel. The ESI image is also in the top right panel with three asterisks denoting the right-most boundary of the track exposed to UV laser microirradiation (two gray lines traversing the laser track are EM sectioning artifacts). The yellow box denotes the region imaged at higher magnification by ESI in the bottom four panels. The middle row in green is the high magnification net nitrogen image map and in red is the net phosphorus image map. The bottom left panel is a net phosphorous/nitrogen overlay image, with the yellow arrow denoting the region containing DSBs and the white arrow denoting part of the heterochromatin region just adjacent to the laser-irradiated region. The bottom right panel is the same net phosphorous/nitrogen overlay image but with a threshold mask applied to highlight, on a pixel by pixel basis, the areas of the image containing a phosphorous/nitrogen ratio representative of chromatin, which is shown in white. The yellow outline denotes the region containing DSBs that was used to calculate the chromatin density coefficients. Bar, 500 nm. (B) Ultrastructure of chromatin containing DSBs in UV laser–irradiated H2AX−/− cells. (top) Fluorescence images of Hoechst-stained DNA and Nbs1 (left and middle panels, respectively) in fixed cells after UV laser microirradiation. The Nbs1 staining in green highlights the subnuclear region exposed to UV microirradiation. The right panel in the top row is a resampled fluorescence image of the same nucleus but from the ultrathin section of the embedded cells, which is overlaid onto a low magnification net phosphorous image montage of the same nucleus imaged by ESI. The yellow arrows denote two heterochromatic regions exposed to UV laser microirradiation, and the red arrow points to an equivalent region not exposed to UV laser irradiation. The following three rows show the higher magnification ESI net phosphorous/nitrogen overlay (left column) and phosphorous/nitrogen ratio threshold mask plus overlay (right column) images as described in Fig. 3 A. The bottom row displays the region not exposed to UV laser microirradiation, whereas the middle two rows display the two regions exposed to UV laser irradiation. DSBs reduce the density of chromatin fibers (white) within heterochromatin by ∼40%. The yellow outlines denote the regions used to calculate the chromatin density coefficients. Bar, 500 nm. (C) ESI images of IRIF in WT cells. The left panel shows a resampled fluorescence image map of the sectioned nucleus, subsequently imaged by ESI at high magnification. The white arrow denotes the single focus presented in the high magnification ESI net phosphorous/nitrogen overlay image (middle) and phosphorous/nitrogen ratio threshold mask plus overlay image (right) as described in Fig. 3 A. The cluster of silver-enhanced immunogold particles is shown in white in the net phosphorous/nitrogen overlay image (middle). The yellow outline denotes the IRIF area containing gold particles, which was used to calculate the IRIF chromatin density coefficient. Bar, 380 nm. (D) Quantitation of phosphorous/nitrogen chromatin density coefficients in UV and γ-irradiated samples compared with regions not exposed to irradiation (at least 10 cells were analyzed for each genotype and treatment).
In Fig. 3 A, WT cells exposed to UV laser microirradiation and containing DSBs were labeled against γ-H2AX to mark DSBs, which are shown by green fluorescence track overlaid onto the low magnification ESI net phosphorus image in the top left panel. The ESI image is shown again in the top right panel of Fig. 3 A but with three yellow asterisks denoting the right-most boundary of the track exposed to UV laser microirradiation (the two gray lines traversing the laser track are EM sectioning artifacts). In this low magnification image, a general decrease in phosphorus density (lower signal intensity) was found specifically in the γ-H2AX–containing domains compared with the neighboring undamaged regions (higher signal intensity). This was confirmed by line scans through the UV microirradiated regions (Fig. S5, available at http://www.jcb.org/cgi/content/full/jcb.200510015/DC1). To determine whether this change affected chromatin structure specifically, we examined at higher magnification an area in which DSBs were introduced by the UV laser in only a subregion of heterochromatin (Fig. 3 A, bottom; arrows; the yellow box in the top panel denotes the region imaged at higher magnification by ESI). We found the regions containing DSBs displayed 10–30 nm chromatin fibers and appeared less condensed (Fig. 3 A, yellow arrow) relative to neighboring heterochromatin that was not exposed to laser-directed damage (Fig. 3 A, white arrow). In addition, the chromatin fibers in the DNA-damaged regions had significant accompanying nitrogen-only content (Fig. 3 A, green) surrounding the chromatin fibers compared with the adjacent region not containing DSBs, which likely represents the accumulation of DNA damage response proteins.
To determine whether H2AX is required for chromatin opening at DSBs, we examined the ultrastructure of chromatin containing DSBs in H2AX−/− MEFs. Because Nbs1 is recruited to DSBs independently of H2AX (Fig. 1 A; Celeste et al., 2003), UV laser–irradiated H2AX−/− cells were immunolabeled against Nbs1 to mark sites of DSBs (Fig. 3 B). Introducing DSBs specifically in regions of heterochromatin (Hoechst-rich regions in mouse cells) allowed us to directly compare the difference in chromatin opening within the damaged regions (Fig. 3 B, yellow arrows) to an equivalent heterochromatin region not containing DSBs (Fig. 3 B, red arrow). We found that DSBs induced a decondensation of heterochromatin characterized by the same 10–30-nm chromatin fibers observed in the damaged WT cells. Moreover, there was significantly more protein surrounding these decondensed chromatin fibers relative to the undamaged ∼2-μm diameter condensed heterochromatin blocks. Thus, consistent with the local chromatin expansion observed in live H2AX−/− cells (Fig. 2 F), the initial remodeling of damaged chromatin determined at high resolution occurs independently of H2AX.
We then compared the chromatin topology observed by UV laser–induced DNA damage to that introduced by γ irradiation, which results in a lower density of DSBs. WT MEFs were incubated 16 h after 8 Gy irradiation and were subsequently fixed and labeled for γ-H2AX (Fig. 3 C). Individual IRIF were easily discernable by immunofluorescence microscopy (Fig. 3 C, left). Immunogold labeling with silver enhancement was used to locate the IRIF regions within the nucleus in the high magnification ESI images. The gold particles are shown in the net nitrogen and net phosphorus overlay image as white dots (Fig. 3 C, middle). This cluster of white dots represents one IRIF observed by immunofluorescence microscopy (Fig. 3 C, arrow), which likely corresponds to a single DSB. Decondensed chromatin fibers on the order of 10–30 nm and nitrogen-rich/phosphorus-poor regions were characteristic of the focus (Fig. 3 C, right), which is consistent with the nature of the chromatin observed in the UV laser–irradiated regions in the aforementioned WT and H2AX−/− cells. Thus, a similar relaxation in higher order chromatin structure is observed both within IRIF and in UV laser–irradiated regions.
To quantify the density of chromatin fibers in DNA-damaged areas, we calculated the range of phosphorus/nitrogen intensity ratios that were representative of chromatin from nonirradiated control cells (not depicted). The phosphorus/nitrogen ratios measured for nondamaged chromatin was used as a minimum threshold for display purposes, and any pixel within subsequent combined net phosphorus/nitrogen overlay images that contained a phosphorus/nitrogen ratio within this range (representative of chromatin) was displayed as white (Fig. 3). In both WT and H2AX−/− cells, the damaged regions were more open, with chromatin fibers shown as white and phosphorus-poor and nitrogen-rich areas interdispersed among the chromatin fibers. By measuring the number of pixels containing the phosphorus/nitrogen ratio representative of chromatin compared with the total number of pixels within both damaged and nondamaged regions of the image (for example, see yellow outlines in Fig. 3, A–C), chromatin density coefficients (see Materials and methods) were calculated. In both UV laser–irradiated WT and H2AX−/− cells, the chromatin density coefficient decreased by ∼0.4 (on a scale of 0–1.0) for the regions containing DSBs compared with the nondamaged regions (Fig. 3 D), indicating that the density of chromatin fibers in the vicinity of DSBs is reduced by ∼40%. In addition, in the γ-irradiated WT cells, the chromatin density coefficient in the IRIF focus was 40% lower than in the region immediately outside of the focus (Fig. 3 D). Thus, the ultrastructure of chromatin within IRIF and UV laser–irradiated regions represents a consistent change that is related to the presence of DSBs.
Phosphorylation of ATM is initially restricted near sites of DNA damage
Given that the decrease in chromatin density was confined to a region surrounding DSBs, regardless of the method used to introduce DSBs, we were interested in determining how these changes related to the activation of DNA damage signaling. Specifically, it has been documented that alterations in chromatin structure rapidly induce the global nuclear activation of the ATM kinase (Bakkenist and Kastan, 2003). A marker of ATM activation is the autophosphorylation at residue Ser 1981 (Bakkenist and Kastan, 2003). To determine the spatio-temporal dynamics of ATM phosphorylation relative to the DNA damage–induced chromatin decondensation, HeLa cells expressing H2B-PAGFP were exposed to UV laser microirradiation in specific subregions of the nucleus, fixed with PFA at different time points after UV, and costained for ATM-1981P and γ-H2AX. Cells were relocated after staining based on the presence of the photoactivated H2B-PAGFP, and confocal images were collected using identical imaging parameters. As shown in Fig. 4 A, the phosphorylated ATM was initially confined to the laser-irradiated region, and both ATM-1981P and γ-H2AX accumulated at the DSB sites during the first minute. Similarly, the chromatin expansion was detectable within 20 s after UV microirradiation and continued until ∼180 s after irradiation (Fig. 2 A and not depicted). At 5 min after UV exposure, the phosphorylated form of ATM began to spread out from the damaged zone to the surrounding nucleoplasm, whereas the γ-H2AX signal was restricted to the original UV-exposed region (Fig. 4 A).
Background-corrected mean fluorescence intensity ratios for phosphorylated ATM signals were calculated from three different nuclear areas: inside the UV laser–exposed region (Fig. 4 B, in), outside the UV laser–exposed region but in the nucleus containing the DSBs (Fig. 4 B, out), and from neighboring nuclei not exposed to UV laser microirradiation (Fig.4 B, non). These measurements confirmed that the phosphorylated form of ATM was present first at the damaged area containing DSBs. For example, 15 s after UV, there was a threefold greater intensity of phosphorylated ATM in the DSB region compared with the surrounding nucleoplasm of the same nucleus not containing DSBs (Fig. 4 B, in/out ratio) or compared with the background nondamaged nucleoplasm of a control cell (Fig. 4 B, in/non ratio). At this early time point, there were equally low levels of phosphorylated ATM in the surrounding nucleoplasm of the UV-treated cell and the control non–UV-treated cell (Fig. 4 B, out/non ratio), indicating that initially, ATM had not been phosphorylated away from the damage region. However, after the ATM-1981P signal accumulated at the damaged region, it began to spread to the surrounding nucleoplasm, which is indicated by the steady increase in the out/non ratio over time (Fig. 4 B). Based on the finding that the initial local concentration of phosphorylated ATM is established with the same spatio-temporal dynamics as the changes in chromatin structure induced by DSBs (Fig. 2 A), our observations support the hypothesis that local alterations in chromatin structure are associated with the activation of ATM (Bakkenist and Kastan, 2003).
Remodeling of chromatin upon the introduction of DSBs is energy dependent
DNA damage response proteins are thought to move in a passive, energy-independent manner, scanning the nuclear volume for high-affinity binding sites (Nelms et al., 1998; Houtsmuller et al., 1999). To determine whether DSB-induced chromatin expansion occurs via an energy-dependent mechanism, we treated cells with the metabolic inhibitors 2-deoxyglucose and sodium azide (Platani et al., 2002). In contrast to normal cells, when energy-depleted cells were subjected to DSBs, a minimal amount of H2B-PAGFP expanded to outside the initial damaged region after 180 s (Figs. 5 A and 2 F). Thus, DSB-induced chromatin expansion is dependent on ATP. To determine whether DNA damage response proteins can still detect DSBs under energy-depleting conditions, we examined the recruitment of Nbs1 and 53BP1 to UV laser–irradiated regions and IRIF, respectively. Although γ-H2AX formed weakly in ATP-depleted cells (not depicted; but also see Fig. 5 C), Nbs1 (Fig. 5 B) and 53BP1 (Fig. 5 C) failed to accumulate at sites of DSBs. Moreover, combined irradiation followed by GFP photobleaching experiments confirmed that ATP depletion did not significantly alter the mobility of Nbs1 and 53BP1 (Fig. 5 B and not depicted). Thus, both 53BP1 and Nbs1 diffuse through the nuclear space but do not accumulate on chromatin containing DSBs in energy-depleted cells possibly because of a lack of available high-affinity binding sites or the impediment of ATP-dependent chromatin remodeling complexes. Alternatively, PI-3 kinase–related phosphorylation events may be required, although we have demonstrated chromatin decondensation in ATM−/− MEFs. Regardless, initial changes in chromatin that occur as a result of the presence of DSBs are dependent on processes that metabolize ATP.
Figure 5.

Chromatin remodeling and DNA damage repair factor recruitment are ATP dependent. (A) DSBs were introduced in WT HeLa cells expressing H2B-PAGFP in the presence (top) or absence (bottom) of ATP-depleting conditions of 10 mM 2-deoxyglucose and 10 mM Na-azide. Pre-UV, post-UV, and 180 s post-UV time series images are shown. Bar, 15 μm. (B) DSBs were introduced in WT MEFs expressing Nbs1-GFP (incubated with Hoechst dye) either in the presence (bottom) or absence (top) of ATP-depleting conditions (regions denoted by yellow rectangles), followed for 10 min by photobleaching of the Nbs1-GFP signal in regions covering both DNA-damaged and nondamaged chromatin (denoted by red squares) and the recovery of the Nbs1-GFP signal monitored over time (right). NBS1-GFP is not recruited to the UV laser–exposed region in the ATP-depleted cells; however, the protein exhibits rapid mobility in both the damaged and nondamaged regions in normal and ATP-depleted cells. Bar, 8 μm. (C) WT MEFs expressing GFP-53BP1 were incubated in ATP-depleting conditions, exposed to 2 Gy γ irradiation, and monitored for 20 min after irradiation before being fixed and immunolabeled against γ-H2AX. GFP-53BP1 failed to be recruited to IRIF even though a weak γ-H2AX–containing IRIF response exists. Bar, 8 μm.
Discussion
The movement of interphase chromatin in mammalian cells is confined to submicrometer regions for periods of >1 h (Abney et al., 1997). Although the mechanism that limits chromosome movement is unclear, the tethering of chromatin to nuclear substructures may contribute to the spatial constraints on diffusion (Chubb et al., 2002). Using real-time fluorescence microscopy, we have been able to unambiguously track the movement of chromatin containing DSBs in living cells. We find that the disruption of chromatin architecture by DSBs does not influence the large-scale mobility of chromatin, providing evidence against the hypothesis that DSBs in mammalian cells generally move in a directed manner over large distances to congregate in common repair centers. Even when neighboring IRIF interact transiently, we have shown that they do so without exhibiting strong cohesiveness. This indicates that the time-dependent increase in the size of individual foci is unlikely to be caused by the coalescence of multiple DSBs. Rather, the spreading of H2AX phosphorylation over a large chromatin domain may provide additional docking sites for a multitude of DNA damage response proteins that accumulate distal to the lesion. Because the nucleus in S. cerevisiae is relatively smaller and homologous recombination is the primary repair mechanism, the probability for interaction between DSBs in yeast may be proportionately greater than in mammalian cells (Lisby et al., 2003).
Although DNA damage generated by UV laser or γ irradiation does not alter the nuclear volume explored by chromosomes, chromatin containing DSBs undergoes a local expansion in the vicinity of the break. As determined by correlative fluorescence and EFTEM, these nuclear regions are characterized by lower order fibers that are morphologically reminiscent of euchromatin regions found in nondamaged nuclei. Although the mechanism that determines the boundary of this DSB-induced chromatin opening or that limits the expanse of H2AX phosphorylation is unclear, neighboring heterochromatin may provide a physical block to the spreading of the damaged chromatin domain. Because a DSB interrupts the continuous chromosome fiber, it is possible that the unfolding of the damaged chromatin region is established by the break itself, which could relieve some of the torsional stress imposed during the packaging of DNA. However, we have found that the DSB-induced chromatin alteration is dependent on ATP. Therefore, it is more likely that primary DSB sensors with ATP-dependent chromatin unwinding activities, which associate with DSBs in an H2AX-independent manner, play an active role in the initial alteration of chromatin folding. Such damage sensors would thereby link the recognition of a DSB to chromatin decondensation and the local activation of the DNA damage response, which is indicated by the initial accumulation of phosphorylated ATM within close proximity to regions containing DSBs.
H2AX is dispensable for the initial recruitment of DSB response proteins to DSBs and the signaling of DNA damage (Celeste et al., 2003). As shown in this study, the decondensation of chromatin at sites of DSBs also occurs independently of H2AX. Nevertheless, we have found that after the initial recruitment of DNA damage response proteins, they fail to stably associate with DSBs in H2AX−/− cells and “fall off” of chromatin (Celeste et al., 2003). Furthermore, H2AX dephosphorylation turns off DNA damage signaling, thereby triggering exit from cell cycle arrest (Keogh et al., 2005). Therefore, we speculate that γ-H2AX, although dispensable for the initial remodeling of chromatin, may be essential for maintaining the decondensed accessible state of chromatin. At late time points after DNA damage, the attenuation of γ-H2AX may allow chromatin to revert to a configuration that no longer permits access to DNA damage response proteins, thereby interrupting damage signaling even in cases in which DNA damage has not been adequately repaired (Keogh et al., 2005; Nussenzweig and Paull, 2006). This hypothesis can now be tested with the aforementioned methodology, which permits direct assessment of the physical state of damaged chromatin.
Materials and methods
Microscopy
A confocal microscope (LSM510 META; Carl Zeiss MicroImaging, Inc.) equipped with continuous wave multiline (351 and 364 nm) argon ion UV and multiline (458, 477, 488, and 514 nm) argon ion visible lasers along with a 40× C-Apochromat NA 1.2 water immersion lens (Carl Zeiss MicroImaging, Inc.) was used primarily for fluorescence and live cell imaging experiments. A heated stage (Carl Zeiss MicroImaging, Inc.) with an objective lens heater (Bioptechs) was used to keep the cells at the appropriate temperature (37°C) and growth conditions during imaging. ESI was performed using an energy-filtering transmission electron microscope (Tecnai 200keV or CM120keV; Philips) equipped with an imaging filter electromagnetic spectrometer (Gatan) and Digital Micrograph software (Gatan). Net phosphorus and nitrogen elemental maps were obtained by collecting pre- and post-edge images specific for either phosphorus or nitrogen. The jump ratio method was used to calculate the resulting net elemental maps (Bazett-Jones and Hendzel, 1999). Correlative light and ESI microscopy were performed with the following steps: imaging samples using the LSM510 confocal microscope, immunolabeling the samples when applicable, embedding in a Quetol 651 epoxy-based resin (Electron Microscopy Sciences) suitable for EFTEM, sectioning the samples to be picked up on copper finder grids, imaging the sectioned samples using an upright wide-field epifluorescence microscope (Axioplan2; Carl Zeiss MicroImaging, Inc.) equipped with a 12-bit CCD camera (model ORCA ER; Hamamatsu), and collecting element-specific images using the ESI mode of an energy-filtering transmission electron microscope.
Photoactivating GFP and introducing DNA DSBs
The 364-nm emission of the UV laser described above was used to photoactivate GFP and to induce DNA damage. Incubation of cells with 7.5 μg/ml of the DNA-binding dye Hoechst 33342 (Sigma-Aldrich) was necessary for the UV laser to induce DSBs. However, the Hoechst dye was not necessary to photoconvert the PAGFP to the activated form using the UV laser. Cells were incubated in phenol red–free DME containing 10% FBS (Invitrogen) with or without Hoechst dye while imaging experiments were performed. The bleaching algorithm provided with the LSM510 software (Carl Zeiss MicroImaging, Inc.) was used to perform GFP photobleaching, PAGFP photoactivation, and to introduce DNA damage at specific sites within nuclei. The UV laser intensity was set to 0.86 nJ/pixel (measured at the specimen; see next section) for introducing DSBs and photoactivating PAGFP. We generally observed an ∼25-fold increase in PAGFP signal intensity upon photoconversion.
The calculated equivalence of UV laser microirradiation to Gy of γ irradiation
Multiple populations of cells were irradiated either with γ irradiation over a range of doses (0–20 Gy) or exposed to different levels of UV laser microirradiation (50% laser output with 5, 10, 20, or 50% Acuosto optical tunable filter–modulated transmission; equivalent to 0.29, 0.48, 0.86, and 2.05 nJ/pixel, respectively, measured at the specimen plane) in specific subregions of the nucleus, fixed and immunolabeled against γ-H2AX, and imaged using consistent imaging parameters on the LSM 510 confocal microscope (described in Microscopy). The resultant confocal fluorescence images were corrected for background, and the integrated fluorescence intensity was measured for the entire nucleus in the case of γ-irradiated cells or for each individual subnuclear region in the case of UV laser–irradiated cells. A standard curve of relative integrated intensity to the amount of γ irradiation (Gy) was plotted (Fig. S4). A linear best-fit curve was calculated, and the resultant integrated intensity values were measured from the UV laser–irradiated samples fitted to the curve. The equivalent number of Gy was obtained from the equation of the best-fit curve. The 0.86 nJ/pixel level of UV laser microirradiation was used consistently for the experiments performed, which corresponds to the introduction of one DSB for every 941 kb of DNA. The density of DSBs within the UV laser–irradiated regions was measured as follows: the density of DNA within the nucleus was calculated by taking the volume of the cell nucleus to be 523.60 μm3 based on a 10-μm diameter sphere and the amount of DNA present in a nonreplicated nucleus to be 6 × 10⁹ bp DNA, therefore resulting in 1.14 × 10⁷ bp DNA/um3. The volume of the subregions used and measured in the test sample was 15.2 μm3, thereby providing ∼1.73 × 10⁸ bp DNA exposed to UV laser microirradiation. From the γ irradiation (Gy) standard curve, the DNA within this subnuclear region was exposed to 5.25 Gy of irradiation, which corresponds to ∼184 DSBs given that 1 Gy introduces ∼35 DSBs in whole-cell γ-irradiated cells. This provides a density of DSBs in the UV laser–irradiated subregions of one DSB for every 941 kb DNA. The UV laser–irradiated regions in the H2B-PAGFP–expressing cells were approximately half (7.08 μm3) that used in the aforementioned test cells, which, based on the same UV laser microirradiation conditions, corresponded to 2.45 Gy of γ irradiation in the subregions of H2B-PAGFP–expressing cells or ∼85 DSBs in 81 Mb DNA.
Cell lines, GFP-tagged protein constructs, FISH, immunolabeling, and ATP depletion
WT, H2AX−/−, and ATM−/− MEFs as well as HeLa and mouse 3617 cells were used for imaging experiments. The H2AX−/− and ATM −/− cell lines were generated from embryonic day 13.5 embryos derived from intercrosses between H2AX+/− or ATM+/− mice as previously described (Celeste et al., 2002). The mouse 3617 mammary tumor virus (MMTV) gene tandem array–containing cell line has been described previously (Walker et al., 1999). Cells were grown overnight in the presence of tetracycline to allow expression of the GFP-tagged GR protein. The following day and 30 min before exposing cells to UV laser microirradiation, 100 nM dexamethasone was added to the culture medium to induce translocation of GFP-GR to the nucleus and subsequent binding to promoter sequences in the MMTV gene array. For DNA FISH, MMTV gene array–containing cells were grown on gridded coverslips (Bellco Glass, Inc.). After UV laser microirradiation, cells were fixed in 4% PFA, and DNA FISH was performed as described previously (Muller et al., 2001). The H2B-PAGFP gene construct was modified from the H2B-GFP and PAGFP constructs described previously (Kanda et al., 1998; Patterson and Lippincott-Schwartz, 2002), which were supplied by T. Misteli (National Cancer Institute [NCI]) and G. Patterson (National Institute of Child Health and Human Development [NICHD]), respectively. GFP-53BP1 was generously provided by T. Halazonetis (Wistar Institute, Philadelphia, PA; Huyen et al., 2004). H3-GFP was provided by H. Kimura (Kyoto University, Kyoto, Japan; Kimura and Cook, 2001). NBS1-GFP was generated by cloning GFP in frame with mouse Nbs1. All cell transfections were conducted using FuGENE6 (Roche) with cells growing on either gridded on nongridded chambered coverglass (MatTek Corp.). Cells were transfected with either GFP-53BP1, Nbs1-GFP, H3-GFP, or H2B-PAGFP and exposed to UV laser microirradiation or 1–10 Gy of γ irradiation. Antibodies used in the immunofluorescence labeling protocol included anti-Nbs1 (1:1,000; Chen et al., 2000), anti-γH2AX (1:1,000; Upstate Biotechnology), and anti-ATM1981p (1:300; Rockland Immunochemicals). ATP depletion was achieved by incubating cells for 30 min before imaging in media composed of PBS supplemented with 10% FBS, 10 mM 2-deoxyglucose, 10 mM sodium azide (Platani et al., 2002), and 7.5 μg/ml Hoechst dye, and ATP depletion was confirmed by the morphology and staining of mitochondria with 50 nM Mitotracker red CMXRos (Invitrogen).
Image processing and analysis
The Medical Imaging, Processing, and Visualization (MIPAV) software package (Matthew McAuliffe and coworkers, Center for Information Technology [CIT]/National Institutes of Health [NIH]) was used for area, center of intensity mass, and mean squared displacement measurements. Image series registration was performed using an optimized automatic 2.5D registration algorithm based on bilinear interpolation and least squares cost function. Region of interest statistics were generated using the statistics generator function in MIPAV. Area and volume measurements were also made using Imaris image processing and analysis software (Bitplane AG). Background-subtracted mean fluorescence intensities, line scan profiles, and particle tracking were also measured using MetaMorph image processing and analysis software (Universal Imaging Corp.). For H2B-PAGFP time series images, the intensity histogram was stretched for each time point to optimize viewing of the morphology of photoactivated regions for display purposes. Measurements were made on background-corrected raw data before or after image registration, with threshold levels set at an intensity value 10% greater than background and regions demarcated using the levelset volume of interest tool in the MIPAV software. Maximum intensity projections and phosphorus/nitrogen ratio (chromatin density) coefficients were generated and measured using the colocalization module of the LSM510 software. Chromatin density coefficients were calculated as follows: the phosphorus and nitrogen signal intensities representative of chromatin (taken from images of control nondamaged cells) were used as minimum signal thresholds for subsequent phosphorous/nitrogen overlay image sets. Nuclear pore complexes were used as a protein-only internal control representative of legitimate high nitrogen signal and low phosphorus signal above background. Within specific regions of the image sets, either in the irradiated areas (damaged) or adjacent to the irradiated areas (nondamaged), the number of pixels containing the phosphorus and nitrogen signal intensities representative of chromatin were added and divided by the total number of pixels within the region, which yielded the chromatin density coefficient. This method is similar to the procedure used to calculate colocalization coefficients (Manders et al., 1993). Regions included in measuring the phosphorous/nitrogen chromatin density coefficients were chosen based on whether the region was inside the γ-H2AX or Nbs1 fluorescence map or contained immunogold particles, in the case of the γ-irradiated sample. Equivalent areas adjacent and outside the irradiated regions were chosen for calculating the chromatin density coefficients of nondamaged chromatin except for the H2AX−/− sample, where a distant region of heterochromatin was included.
Online supplemental material
Fig. S1 shows the mobility of chromatin regions containing DNA DSBs. Fig. S2 shows the mobility and expansion of chromatin in WT living cells. Fig. S3 shows the changes in specific chromatin structure upon UV laser microirradiation. Fig. S4 shows a comparison of γ irradiation (Gy) with UV laser microirradiation. Fig. S5 shows a line scan through a net phosphorus ESI micrograph. Video 1 shows the mobility of photoactivated chromatin containing DNA DSBs. Video 2 shows the mobility of photoactivated chromatin without DNA DSBs. Video 3 shows the mobility of GFP-53BP1–containing IRIF in living cells. Online supplemental material is available at http://www.jcb.org/cgi/content/full/jcb.200510015/DC1.
Supplementary Material
Acknowledgments
We are grateful to George Patterson for providing the PAGFP construct and for technical assistance; Tom Misteli for helpful discussions and for providing the H2B-GFP construct; Thanos Halazonetis for the gift of the GFP-53BP1 construct; Hiroshi Kimura for the H3-GFP plasmid; Robert Bonner (NICHD) for help in acquiring UV laser power measurements; Richard Leapman (NIH) for providing access to his EFTEM microscope and for valuable discussions; Ren Li and Guofeng Zhang for sectioning our EFTEM samples; Owen Schwartz (National Institute of Allergy and Infectious Diseases) for providing access to Imaris image processing and analysis software; Matt McAuliffe and coworkers for accommodating our needs in their continuing development of the MIPAV software package; and Michael Lichten, Michael Kastan, and Michael Difilippantonio for helpful comments on the manuscript. The MMTV-GFPGR 3617 cell line was developed and provided by Dawn Walker and Gordon Hager (NCI).
D.P. Bazett-Jones holds a Canada Research Chair in Molecular and Cellular Imaging, and G. Dellaire holds a Senior Research Fellowship from the Canadian Institutes of Health Research. This research was supported in part by the Intramural Research Program of the NCI's Center for Cancer Research and a grant from the AT Children's Project to A. Nussenzweig.
O. Fernandez-Capetillo's present address is Genomic Instability Group, Spanish National Cancer Center, Madrid 28029, Spain.
Abbreviations used in this paper: ATM, ataxia telangiectasia mutated; DSB, double-strand break; EFTEM, energy-filtering transmission EM; ESI, electron spectroscopic imaging; GR, gluccocorticoid receptor; IRIF, irradiation-induced foci; MEF, mouse embryo fibroblast; MMTV, mouse mammary tumor virus; PAGFP, photoactivatable GFP; WT, wild type.
References
- Abney, J.R., B. Cutler, M.L. Fillbach, D. Axelrod, and B.A. Scalettar. 1997. Chromatin dynamics in interphase nuclei and its implications for nuclear structure. J. Cell Biol. 137:1459–1468. [DOI] [PMC free article] [PubMed] [Google Scholar]
- Aten, J.A., J. Stap, P.M. Krawczyk, C.H. van Oven, R.A. Hoebe, J. Essers, and R. Kanaar. 2004. Dynamics of DNA double-strand breaks revealed by clustering of damaged chromosome domains. Science. 303:92–95. [DOI] [PubMed] [Google Scholar]
- Bakkenist, C.J., and M.B. Kastan. 2003. DNA damage activates ATM through intermolecular autophosphorylation and dimer dissociation. Nature. 421:499–506. [DOI] [PubMed] [Google Scholar]
- Bakkenist, C.J., and M.B. Kastan. 2004. Initiating cellular stress responses. Cell. 118:9–17. [DOI] [PubMed] [Google Scholar]
- Bassing, C.H., K.F. Chua, J. Sekiguchi, H. Suh, S.R. Whitlow, J.C. Fleming, B.C. Monroe, D.N. Ciccone, C. Yan, K. Vlasakova, et al. 2002. Increased ionizing radiation sensitivity and genomic instability in the absence of histone H2AX. Proc. Natl. Acad. Sci. USA. 99:8173–8178. [DOI] [PMC free article] [PubMed] [Google Scholar]
- Bazett-Jones, D.P., and M.J. Hendzel. 1999. Electron spectroscopic imaging of chromatin. Methods. 17:188–200. [DOI] [PubMed] [Google Scholar]
- Bird, A.W., D.Y. Yu, M.G. Pray-Grant, Q. Qiu, K.E. Harmon, P.C. Megee, P.A. Grant, M.M. Smith, and M.F. Christman. 2002. Acetylation of histone H4 by Esa1 is required for DNA double-strand break repair. Nature. 419:411–415. [DOI] [PubMed] [Google Scholar]
- Celeste, A., S. Petersen, P.J. Romanienko, O. Fernandez-Capetillo, H.T. Chen, O.A. Sedelnikova, B. Reina-San-Martin, V. Coppola, E. Meffre, M.J. Difilippantonio, et al. 2002. Genomic instability in mice lacking histone H2AX. Science. 296:922–927. [DOI] [PMC free article] [PubMed] [Google Scholar]
- Celeste, A., O. Fernandez-Capetillo, M.J. Kruhlak, D.R. Pilch, D.W. Staudt, A. Lee, R.F. Bonner, W.M. Bonner, and A. Nussenzweig. 2003. Histone H2AX phosphorylation is dispensable for the initial recognition of DNA breaks. Nat. Cell Biol. 5:675–679. [DOI] [PubMed] [Google Scholar]
- Chen, H.T., A. Bhandoola, M.J. Difilippantonio, J. Zhu, M.J. Brown, X. Tai, E.P. Rogakou, T.M. Brotz, W.M. Bonner, T. Ried, and A. Nussenzweig. 2000. Response to RAG-mediated VDJ cleavage by NBS1 and gamma-H2AX. Science. 290:1962–1965. [DOI] [PMC free article] [PubMed] [Google Scholar]
- Chubb, J.R., S. Boyle, P. Perry, and W.A. Bickmore. 2002. Chromatin motion is constrained by association with nuclear compartments in human cells. Curr. Biol. 12:439–445. [DOI] [PubMed] [Google Scholar]
- Dellaire, G., R. Nisman, and D.P. Bazett-Jones. 2004. Correlative light and electron spectroscopic imaging of chromatin in situ. Methods Enzymol. 375:456–478. [DOI] [PubMed] [Google Scholar]
- Downs, J.A., N.F. Lowndes, and S.P. Jackson. 2000. A role for Saccharomyces cerevisiae histone H2A in DNA repair. Nature. 408:1001–1004. [DOI] [PubMed] [Google Scholar]
- Downs, J.A., S. Allard, O. Jobin-Robitaille, A. Javaheri, A. Auger, N. Bouchard, S.J. Kron, S.P. Jackson, and J. Cote. 2004. Binding of chromatin-modifying activities to phosphorylated histone H2A at DNA damage sites. Mol. Cell. 16:979–990. [DOI] [PubMed] [Google Scholar]
- Fernandez-Capetillo, O., S.K. Mahadevaiah, A. Celeste, P.J. Romanienko, R.D. Camerini-Otero, W.M. Bonner, K. Manova, P. Burgoyne, and A. Nussenzweig. 2003. H2AX is required for chromatin remodeling and inactivation of sex chromosomes in male mouse meiosis. Dev. Cell. 4:497–508. [DOI] [PubMed] [Google Scholar]
- Fernandez-Capetillo, O., C.D. Allis, and A. Nussenzweig. 2004. a. Phosphorylation of histone H2B at DNA double-strand breaks. J. Exp. Med. 199:1671–1677. [DOI] [PMC free article] [PubMed] [Google Scholar]
- Fernandez-Capetillo, O., A. Lee, M. Nussenzweig, and A. Nussenzweig. 2004. b. H2AX: the histone guardian of the genome. DNA Repair (Amst.). 3:959–967. [DOI] [PubMed] [Google Scholar]
- Hendzel, M.J., F. Boisvert, and D.P. Bazett-Jones. 1999. Direct visualization of a protein nuclear architecture. Mol. Biol. Cell. 10:2051–2062. [DOI] [PMC free article] [PubMed] [Google Scholar]
- Hittelman, W.N., and M. Pollard. 1984. Visualization of chromatin events associated with repair of ultraviolet light-induced damage by premature chromosome condensation. Carcinogenesis. 5:1277–1285. [DOI] [PubMed] [Google Scholar]
- Houtsmuller, A.B., S. Rademakers, A.L. Nigg, D. Hoogstraten, J.H. Hoeijmakers, and W. Vermeulen. 1999. Action of DNA repair endonuclease ERCC1/XPF in living cells. Science. 284:958–961. [DOI] [PubMed] [Google Scholar]
- Huyen, Y., O. Zgheib, R.A. Ditullio Jr., V.G. Gorgoulis, P. Zacharatos, T.J. Petty, E.A. Sheston, H.S. Mellert, E.S. Stavridi, and T.D. Halazonetis. 2004. Methylated lysine 79 of histone H3 targets 53BP1 to DNA double-strand breaks. Nature. 432:406–411. [DOI] [PubMed] [Google Scholar]
- Jaberaboansari, A., G.B. Nelson, J.L. Roti Roti, and K.T. Wheeler. 1988. Postirradiation alterations of neuronal chromatin structure. Radiat. Res. 114:94–104. [PubMed] [Google Scholar]
- Jazayeri, A., A.D. McAinsh, and S.P. Jackson. 2004. Saccharomyces cerevisiae Sin3p facilitates DNA double-strand break repair. Proc. Natl. Acad. Sci. USA. 101:1644–1649. [DOI] [PMC free article] [PubMed] [Google Scholar]
- Kanda, T., K.F. Sullivan, and G.M. Wahl. 1998. Histone-GFP fusion protein enables sensitive analysis of chromosome dynamics in living mammalian cells. Curr. Biol. 8:377–385. [DOI] [PubMed] [Google Scholar]
- Keogh, M.C., J.A. Kim, M. Downey, J. Fillingham, D. Chowdhury, J.C. Harrison, M. Onishi, N. Datta, S. Galicia, A. Emili, et al. 2005. A phosphatase complex that dephosphorylates gammaH2AX regulates DNA damage checkpoint recovery. Nature. 439:497–501. [DOI] [PubMed] [Google Scholar]
- Kimura, H., and P.R. Cook. 2001. Kinetics of core histones in living human cells: little exchange of H3 and H4 and some rapid exchange of H2B. J. Cell Biol. 153:1341–1353. [DOI] [PMC free article] [PubMed] [Google Scholar]
- Kusch, T., L. Florens, W.H. Macdonald, S.K. Swanson, R.L. Glaser, J.R. Yates III, S.M. Abmayr, M.P. Washburn, and J.L. Workman. 2004. Acetylation by Tip60 is required for selective histone variant exchange at DNA lesions. Science. 306:2084–2087. [DOI] [PubMed] [Google Scholar]
- Lisby, M., U.H. Mortensen, and R. Rothstein. 2003. Colocalization of multiple DNA double-strand breaks at a single Rad52 repair centre. Nat. Cell Biol. 5:572–577. [DOI] [PubMed] [Google Scholar]
- Ljungman, M. 1989. Pretreatment with UV light renders the chromatin in human fibroblasts more susceptible to the DNA-damaging agents bleomycin, gamma radiation and 8-methoxypsoralen. Carcinogenesis. 10:447–451. [DOI] [PubMed] [Google Scholar]
- Manders, E.M.M., F.J. Verbeek, and J.A. Aten. 1993. Measurement of co-localization of objects in dual-colour confocal images. J. Microsc. 169:375–382. [DOI] [PubMed] [Google Scholar]
- McNally, J.G., W.G. Muller, D. Walker, R. Wolford, and G.L. Hager. 2000. The glucocorticoid receptor: rapid exchange with regulatory sites in living cells. Science. 287:1262–1265. [DOI] [PubMed] [Google Scholar]
- Morrison, A.J., and X. Shen. 2005. DNA repair in the context of chromatin. Cell Cycle. 4:568–571. [PubMed] [Google Scholar]
- Morrison, A.J., J. Highland, N.J. Krogan, A. Arbel-Eden, J.F. Greenblatt, J.E. Haber, and X. Shen. 2004. INO80 and gamma-H2AX interaction links ATP-dependent chromatin remodeling to DNA damage repair. Cell. 119:767–775. [DOI] [PubMed] [Google Scholar]
- Muller, W.G., D. Walker, G.L. Hager, and J.G. McNally. 2001. Large-scale chromatin decondensation and recondensation regulated by transcription from a natural promoter. J. Cell Biol. 154:33–48. [DOI] [PMC free article] [PubMed] [Google Scholar]
- Murr, R., J.I. Loizou, Y.G. Yang, C. Cuenin, H. Li, Z.Q. Wang, and Z. Herceg. 2006. Histone acetylation by Trrap-Tip60 modulates loading of repair proteins and repair of DNA double-strand breaks. Nat. Cell Biol. 8:91–99. [DOI] [PubMed] [Google Scholar]
- Nelms, B.E., R.S. Maser, J.F. MacKay, M.G. Lagally, and J.H. Petrini. 1998. In situ visualization of DNA double-strand break repair in human fibroblasts. Science. 280:590–592. [DOI] [PubMed] [Google Scholar]
- Nussenzweig, A., and T. Paull. 2006. DNA repair: tails of histones lost. Nature. 439:406–407. [DOI] [PubMed] [Google Scholar]
- Patterson, G.H., and J. Lippincott-Schwartz. 2002. A photoactivatable GFP for selective photolabeling of proteins and cells. Science. 297:1873–1877. [DOI] [PubMed] [Google Scholar]
- Paull, T.T., E.P. Rogakou, V. Yamazaki, C.U. Kirchgessner, M. Gellert, and W.M. Bonner. 2000. A critical role for histone H2AX in recruitment of repair factors to nuclear foci after DNA damage. Curr. Biol. 10:886–895. [DOI] [PubMed] [Google Scholar]
- Peterson, C.L., and J. Cote. 2004. Cellular machineries for chromosomal DNA repair. Genes Dev. 18:602–616. [DOI] [PubMed] [Google Scholar]
- Pilch, D.R., O.A. Sedelnikova, C. Redon, A. Celeste, A. Nussenzweig, and W.M. Bonner. 2003. Characteristics of gamma-H2AX foci at DNA double-strand breaks sites. Biochem. Cell Biol. 81:123–129. [DOI] [PubMed] [Google Scholar]
- Platani, M., I. Goldberg, A.I. Lamond, and J.R. Swedlow. 2002. Cajal body dynamics and association with chromatin are ATP-dependent. Nat. Cell Biol. 4:502–508. [DOI] [PubMed] [Google Scholar]
- Qin, S., and M.R. Parthun. 2002. Histone H3 and the histone acetyltransferase Hat1p contribute to DNA double-strand break repair. Mol. Cell. Biol. 22:8353–8365. [DOI] [PMC free article] [PubMed] [Google Scholar]
- Ren, Y., M.J. Kruhlak, and D.P. Bazett-Jones. 2003. Same serial section correlative light and energy-filtered transmission electron microscopy. J. Histochem. Cytochem. 51:605–612. [DOI] [PubMed] [Google Scholar]
- Rogakou, E.P., D.R. Pilch, A.H. Orr, V.S. Ivanova, and W.M. Bonner. 1998. DNA double-stranded breaks induce histone H2AX phosphorylation on serine 139. J. Biol. Chem. 273:5858–5868. [DOI] [PubMed] [Google Scholar]
- Rogakou, E.P., C. Boon, C. Redon, and W.M. Bonner. 1999. Megabase chromatin domains involved in DNA double-strand breaks in vivo. J. Cell Biol. 146:905–916. [DOI] [PMC free article] [PubMed] [Google Scholar]
- Rubbi, C.P., and J. Milner. 2003. p53 is a chromatin accessibility factor for nucleotide excision repair of DNA damage. EMBO J. 22:975–986. [DOI] [PMC free article] [PubMed] [Google Scholar]
- Sanders, S.L., M. Portoso, J. Mata, J. Bahler, R.C. Allshire, and T. Kouzarides. 2004. Methylation of histone H4 lysine 20 controls recruitment of Crb2 to sites of DNA damage. Cell. 119:603–614. [DOI] [PubMed] [Google Scholar]
- Shroff, R., A. Arbel-Eden, D. Pilch, G. Ira, W.M. Bonner, J.H. Petrini, J.E. Haber, and M. Lichten. 2004. Distribution and dynamics of chromatin modification induced by a defined DNA double-strand break. Curr. Biol. 14:1703–1711. [DOI] [PMC free article] [PubMed] [Google Scholar]
- Sidik, K., and M.J. Smerdon. 1990. Nucleosome rearrangement in human cells following short patch repair of DNA damaged by bleomycin. Biochemistry. 29:7501–7511. [DOI] [PubMed] [Google Scholar]
- Siino, J.S., I.B. Nazarov, M.P. Svetlova, L.V. Solovjeva, R.H. Adamson, I.A. Zalenskaya, P.M. Yau, E.M. Bradbury, and N.V. Tomilin. 2002. Photobleaching of GFP-labeled H2AX in chromatin: H2AX has low diffusional mobility in the nucleus. Biochem. Biophys. Res. Commun. 297:1318–1323. [DOI] [PubMed] [Google Scholar]
- Smerdon, M.J., T.D. Tlsty, and M.W. Lieberman. 1978. Distribution of ultraviolet-induced DNA repair synthesis in nuclease sensitive and resistant regions of human chromatin. Biochemistry. 17:2377–2386. [DOI] [PubMed] [Google Scholar]
- Spencer, C.A., M.J. Kruhlak, H.L. Jenkins, X. Sun, and D.P. Bazett-Jones. 2000. Mitotic transcription repression in vivo in the absence of nucleosomal chromatin condensation. J. Cell Biol. 150:13–26. [DOI] [PMC free article] [PubMed] [Google Scholar]
- Strom, L., H.B. Lindroos, K. Shirahige, and C. Sjogren. 2004. Postreplicative recruitment of cohesin to double-strand breaks is required for DNA repair. Mol. Cell. 16:1003–1015. [DOI] [PubMed] [Google Scholar]
- Tamburini, B.A., and J.K. Tyler. 2005. Localized histone acetylation and deacetylation triggered by the homologous recombination pathway of double-strand DNA repair. Mol. Cell. Biol. 25:4903–4913. [DOI] [PMC free article] [PubMed] [Google Scholar]
- Tsukuda, T., A.B. Fleming, J.A. Nickoloff, and M.A. Osley. 2005. Chromatin remodelling at a DNA double-strand break site in Saccharomyces cerevisiae. Nature. 438:379–383. [DOI] [PMC free article] [PubMed] [Google Scholar]
- Unal, E., A. Arbel-Eden, U. Sattler, R. Shroff, M. Lichten, J.E. Haber, and D. Koshland. 2004. DNA damage response pathway uses histone modification to assemble a double-strand break-specific cohesin domain. Mol. Cell. 16:991–1002. [DOI] [PubMed] [Google Scholar]
- van Attikum, H., and S.M. Gasser. 2005. The histone code at DNA breaks: a guide to repair? Nat. Rev. Mol. Cell Biol. 6:757–765. [DOI] [PubMed] [Google Scholar]
- van Attikum, H., O. Fritsch, B. Hohn, and S.M. Gasser. 2004. Recruitment of the INO80 complex by H2A phosphorylation links ATP-dependent chromatin remodeling with DNA double-strand break repair. Cell. 119:777–788. [DOI] [PubMed] [Google Scholar]
- Walker, D., H. Htun, and G.L. Hager. 1999. Using inducible vectors to study intracellular trafficking of GFP-tagged steroid/nuclear receptors in living cells. Methods. 19:386–393. [DOI] [PubMed] [Google Scholar]
Associated Data
This section collects any data citations, data availability statements, or supplementary materials included in this article.