

Abstract
Estrogen ortho-quinones have been implicated as ultimate carcinogenic metabolites of estrogens. The present conclusion that estrogen ortho-quinones are not substrates for NAD(P)H:quinone oxidoreductase (NQO1) stems from earlier reports. In this investigation, we were successful in circumventing the problem of nonenzymatic reduction of estrogen quinone by NAD(P)H, which led to the above conclusion, and for the first time show that NQO1 catalyzes the reduction of estrogen quinones. Mass spectrometric binding studies involving estradiol-3,4-quinone or menadione with NQO1 clearly support the formation of an enzyme-substrate physical complex. However, the NQO1 mass spectrum did not alter after addition of cholesterol, the control. Two different strategies were employed to ascertain the NQO1 activity in estrogen quinone reduction. First, the ping-pong mechanism of NQO1 catalysis was utilized to overcome the problem of nonenzymatic reduction of the substrate by NADH. Second, tetrahydrofolic acid, which has a lower reducing potential, was used as an alternate cofactor. Both of these methods confirmed the reduction of estradiol-3,4-quinone by NQO1, when assay mixtures were analyzed by UV or liquid chromatography-mass spectrometry. Furthermore, reduction of 9,10-phenanthrene quinone or menadione was observed using the reported assay conditions. Thus, clear evidence for the catalytic reduction of estrogen ortho-quinones by NQO1 has been obtained; its mechanism and implications are discussed.
Keywords: NQO1, estrogen ortho-quinone, enzyme-substrate complex
INTRODUCTION
NAD(P)H:quinone oxidoreductase (NQO1, DT-diaphorase) has an ability to catalyze the two-electron reduction of quinones to hydroquinones, thereby preventing generation of toxic semiquinone radicals, reactive oxygen species and alkylation [1]. Due to its broad substrate specificity, this cytosolic flavoprotein has a significant role in the toxicity and carcinogenicity mediated by various endogenous and exogenous quinones [1-3]. Detoxification of quinones by NQO1 has been confirmed by studies in NQO1-knockout mice that demonstrated the increased menadione and benzene toxicity in NQO1-deficient animals [4,5]. The same animals also showed increased benzo[a]pyrene and 7,12-dimethylbenz[a]anthracene-induced mouse skin carcinogenesis [6]. In humans, NQO1 activity is higher in many extrahepatic tissues and is induced by a variety of agents, including oxidants, antioxidants, xenobiotics, UV light and ionizing radiation [7-10]. Induction of NQO1 has been demonstrated to protect against the cytotoxicity, mutagenicity and carcinogenicity of many compounds [11,12]. Several crystallographic structures of NQO1 and substrates with core 1,4-benzoquinone complexes have been reported to elucidate the catalytic mechanism of NQO1 [13,15]. Owing to its properties, efforts are also being made to use NQO1 as a target for enhancing the cytotoxicity of chemotherapeutic drugs [16].
NQO1 activity is observed in many solid tumors, including lung, colon, liver and breast [17-20]. In fact, our recent studies show that breast tissue from women without breast cancer has higher expression of the NQO1 enzyme than does breast tissue from women with breast cancer [20]. Estrogens are metabolized to reactive catechol estrogen quinones. These quinones, which react with DNA to form depurinating N7Gua and N3Ade adducts, have been implicated as the ultimate metabolites responsible for estrogen carcinogenesis (Scheme 1) [21,22]. Abasic sites that are formed by depurination of adducts are thought to be responsible for inducing mutations critical for cancer initiation [23]. Thus, the levels and activity of NQO1 might play a significant role in estrogen-induced carcinogenesis.
Scheme 1.

Proposed redox cycle operating in estrogen metabolism.
Earlier studies have investigated the role of NQO1 in estrogen metabolism. It was noted that estradiol-3,4-quinone (E2-3,4-Q) is spontaneously reduced to its catechol by the cofactor NADH or NADPH, with or without the presence of NQO1. Since the sequence of reaction events taking place in the assay mixture were not taken into account, this observation was interpreted as E2- 3,4-Q not being a substrate for NQO1 [24,25]. In fact, E2-3,4-Q might have been reduced by the cofactor before it could reach the NQO1 active site. The presence of a large amount of NADH also made it difficult to differentiate between the spontaneous and NQO1-catalyzed reduction of E2-3,4-Q. This logical analysis of the earlier work prompted us to design an experiment in which the E2-3,4-Q is allowed to interact with the NQO1, enabling us to know the real enzyme activity.
The present studies were undertaken to revisit the problem and establish, if any, the link between estrogen metabolism and NQO1. This manuscript accurately pinpoints problems in earlier assay methods that led to the conclusion that E2-3,4-Q is not a substrate for NQO1 and describes the novel strategies that we have used to successfully overcome them. For the first time, we have shown the binding of an ortho-quinone, in particular E2-3,4-Q, with NQO1 using a soft ionization ESI-MS method. Finally, the evidence for reduction of E2-3,4-Q by NQO1 is presented.
EXPERIMENTAL PROCEDURES
NQO1, dicumarol, tetrahydrofolic acid (THF), NADH, and horse myoglobin were purchased from Sigma Chemical Co. (St. Louis, MO) Menadione (MD), 9,10-phenanthrene quinone (Phe-Q) and activated MnO2 were obtained from Aldrich Chemical Co. (Milwaukee, WI). All solvents were HPLC grade and all other chemicals used were of the highest grade available. 4-OHE2 was synthesized as previously described [26]. E2-3,4-Q was freshly synthesized using a reported procedure [27] and used immediately. Note that all the quinones used in this study are hazardous and were handled in accordance with NIH guidelines for the laboratory use of chemical carcinogens [28].
ESI-MS
All experiments were performed on a Waters Quattro Micro triple quadruple mass spectrometer by using electrospray ionization (ESI) in positive ion (PI) mode, with an ESI-MS capillary voltage of 3.2 kV, a sample cone voltage of 45 V, an extractor cone voltage of 2 V, and a detector voltage of 650 V. Desolvation gas flow was maintained at 600 L/h. Cone gas flow was set at 60 L/h. Desolvation temperature and source temperature were set to 200 and 100 °C, respectively. The acquisition range was 500-2000 Da. The sample was introduced to the source at a flow rate of 10 μl/min by using an inbuilt pump. For all the complex formation studies, a methanol:water (1:1) and 0.1% formic acid mixture was used as the carrier solution. ESI interface tuning and mass calibration were accomplished in the PI mode by using a standard horse myoglobin solution. The relative abundance of the different charged species present on ESI mass spectra were measured from their respective peak intensities, assuming that the relative intensities displayed by the different species in the ESI mass spectrum reflect the actual distribution of these species in solution. The masses determined through the deconvolution program have an estimated standard deviation of ± 10 Da.
LC/MS-MS
LC/MS analyses were carried out with a Waters Acquity ultraperformance liquid chromatography (UPLC) system connected with a high performance Quattro Micro triple quadrupole mass spectrometer designed for LC/MS-MS operation. Analytical separations on the UPLC system were conducted using an Acquity UPLC BEH C18 1.7 μm column (1 × 100 mm) at a flow rate of 0.15 ml/min. The flow was isocratic with 60% A (0.1% formic acid in H2O) and 40% B (0.1% formic acid in CH3CN), with a total separation time of 3 min. The elutions from the UPLC column were introduced to the Quattro Micro mass spectrometer. The ionization method used for the analysis was ESI in the negative ion (NI) mode. Tandem mass spectrometry (MS-MS) was performed in a multiple reaction monitoring (MRM) mode to produce structural information about 4-OHE2 by fragmenting parent 287.3 m/z ions inside the mass spectrometer and identifying the resulting daughter 160.9 m/z fragment ions. Pure standards were used to optimize the LC/MS conditions prior to analysis.
Formation of NQO1-E2-3,4-Q complex
Ten μl of 50 μM NQO1 and 50 μM test compound (MD, cholesterol or freshly synthesized E2-3,4-Q) were added to 80 μl of 5 mM ammonium acetate, pH 6.8. After mixing at room temperature for 2 min, it was diluted with 400 μl of carrier solution. The complex was taken up in a 250-μl syringe and introduced to MS by direct infusion.
Determination of NQO1 activity using UV-Vis spectroscopy
This was performed with a Perkin-Elmer double beam spectrophotometer. The anaerobic reduction and oxidation of protein-bound FAD was monitored at 450 nm either in the presence or absence of substrate, inhibitor and NADH. To ensure anaerobic conditions, N2 was bubbled continuously for 2 h in the buffer and organic solvents were degassed. The reduction of protein-bound flavin was monitored between 280 and 700 nm. Reoxidation of the flavin was measured by following the increase in absorption at 450 nm. To 1 ml of buffer (25 mM Tris-HCl, pH 6.8) containing 0.7 mg/ml BSA in a 1.5-ml cuvette was added 10 U of freshly prepared NQO1 (1 eq) and the spectrum was recorded, followed by addition of 0.9 eq NADH. In the next step, reoxidation of the enzyme was carried out by addition of E2-3,4-Q or MD (1.2 eq) to the assay mixture. In the inhibitor study, dicumarol (10 μM) was added to both the cuvettes and base line correction was made. Control assays were carried out without E2-3,4-Q, MD, cofactor or dicumarol.
In a separate study, to 1 ml buffer (25 mM Tris-HCl, pH 6.8) containing 0.7 mg/ml BSA in a 1.5-ml cuvette, was added 100 μM NADH and 50 μM Phe-Q or MD. The reaction was initiated by addition of freshly prepared NQO1 (0.2 μg/ml). Control assays were carried out without enzyme or cofactor. The reduction of Phe-Q or MD was monitored as a function of the disappearance of NADH absorbance at 340 nm.
Determination of NQO1 activity using LC/MS-MS
The assays were carried out under anaerobic conditions unless otherwise reported. To ensure anaerobic conditions, N2 was continuously bubbled for 2 h in the buffer and organic solvents were degassed. In the UV experiments, the cuvettes were stoppered and sealed with parafilm.
NADH as cofactor - To 1 ml buffer (25 mM Tris-HCl, pH 6.8) containing 0.7 mg/ml BSA in a 1.5-ml microfuge tube was sequentially added 10 U of freshly prepared NQO1, followed by 0.9 eq of NADH. The reaction was initiated by addition of 1.2 eq of E2-3,4-Q to the assay mixture. Control assays were carried out without E2-3,4-Q or cofactor. The assay mixtures were passed through 5000 MW cutoff filters after 2 min and were directly injected on LC/MS for product analysis.
THF as cofactor - To 1 ml buffer (25 mM Tris-HCl, pH 6.2) containing 0.7 mg/ml BSA in a 1.5-ml microfuge tube was added freshly prepared NQO1 (0.2 μg/ml) and 50 μM E2-3,4-Q. The reaction was initiated by addition of THF (500 μM) to the assay mixture. Control assays were carried out without enzyme or cofactor. The assay mixtures were extracted after 30 min with diethyl ether, and the concentrated extracts were injected on LC/MS for product analysis.
RESULTS
The ability of NQO1 to reduce ortho-quinones, in particular E2-3,4-Q (Figure 1a), was investigated by mass spectrometric determination of the enzyme-substrate complex, as well as by using NADH or THF as the cofactor for the reaction.
Figure 1.

AM1 energy-minimized structures of E2-3,4-Q (a) and cholesterol (b).
Determination of the substrate-NQO1 complex by MS
We optimized the operating conditions of the mass spectrometer to obtain appropriate sensitivity and to prevent dissociation of the enzyme-substrate complex. Both NQO1 alone and its ligand-enzyme complexes were used for this purpose. Multiple charges are observed, as typically seen in ESI-MS [29,30]. Most of the signals from different enzyme charged states appear in the region m/z 700-1000.
The observed molecular masses of intact NQO1 in different charged states (Figure 2a) are presented in Table 1. Deconvolution of the ESI spectrum gave the molecular mass of 30,855 Da for NQO1 (Figure 2b). The mass spectra after incubation of NQO1 with substrate, MD or E2-3,4-Q, are presented in Figures 2e and 2g, respectively. After addition of the substrate, MD or E2-3,4-Q, all the charged species shifted in accordance with the increased m/z ratio, indicating the formation of an NQO1-substrate physical complex (Table 1). The deconvolution of the NQO1-MD and NQO1-E2-3,4-Q spectra resulted in a peak at 31,072 and 31,149 (Figures 2f and 2h), respectively. For MD, with molecular weight 172, the resulting spectrum was expected at 31,027, but the broad peaks of the charged species caused the deconvoluted mass to be off by approximately 45 Da. With NQO1-E2-3,4-Q, the observed mass difference was consistent with the mass of the corresponding proposed physical complex (< 0.03% different), which should result in an increase in mass of 286 Da. Cholesterol was selected as the control compound because it has the same skeletal structure as 4-OHE2 and E2-3,4-Q, with a bulky side chain and a non-aromatic A ring (Figure 1b). Incubation of cholesterol with NQO1 did not result in any change in the spectrum compared to NQO1 alone (Figures 2a and 2c). As indicated by the ESI-MS results, E2-3,4-Q displays strong binding with NQO1, whereas no binding of NQO1 was observed with cholesterol (Figure 2).
Figure 2.
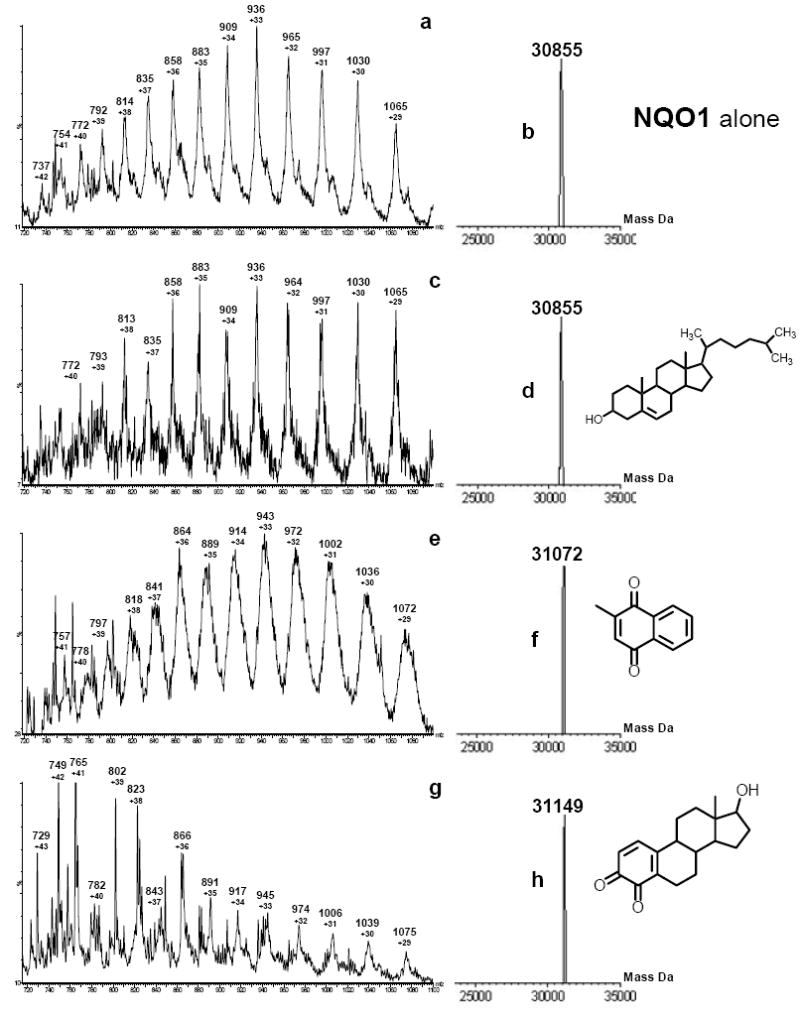
Positive-ion electrospray ionization mass spectrum of 1 μM NQO1 in carrier solution (a), after addition of 1 eq of cholesterol (c), MD (e) or E2-3,4-Q (g). The m/z values of major peaks corresponding to different NQO1 charged states (z) are shown under the spectra. See Table 1 for peak assignments. The molecular mass of NQO1 in carrier solution (b) and after addition of 1 eg of cholesterol (d), MD (f) or E2-3,4-Q (h) is also presented.
Table 1.
Calculated and experimental m/z values for the NQO1-substrate complexes
| Charge(z)
+ |
NQO1 Observed m/z |
NQO1 + E2-3,4-Q Calculated m/z |
NQO1 + E2-3,4-Q Observed m/z |
NQO1 + MD Calculated m/z |
NQO1 + MD Observed m/z |
|---|---|---|---|---|---|
| 29 | 1065 | 1075 | 1075 | 1071 | 1072 |
| 30 | 1030 | 1040 | 1039 | 1036 | 1036 |
| 31 | 997 | 1006 | 1006 | 1003 | 1002 |
| 32 | 965 | 974 | 974 | 970 | 972 |
| 33 | 936 | 945 | 945 | 941 | 943 |
| 34 | 909 | 917 | 917 | 914 | 914 |
| 35 | 883 | 891 | 891 | 888 | 889 |
| 36 | 858 | 866 | 866 | 863 | 864 |
| 37 | 835 | 843 | 843 | 840 | 841 |
| 38 | 814 | 822 | 823 | 819 | 818 |
| 39 | 792 | 799 | 802 | 796 | 797 |
| 40 | 772 | 779 | 782 | 776 | 778 |
| 41 | 754 | 761 | 765 | 758 | 757 |
| 42 | 737 | 744 | 749 | 741 | 741 |
| 43 | 729 |
NQO1 activity in the presence of NADH cofactor
NADH nonenzymatically reduces E2-3,4- Q. Therefore, the activity of NQO1 in reducing E2-3,4-Q could not be ascertained by earlier investigators. To overcome this problem, we took advantage of the ping-pong mechanism of enzyme catalysis. The assay was divided into two steps. First, FAD-NQO1 was reduced with NADH, and, second, the reduced enzyme was used to carry out the reduction of the substrate. The reduction of substrate by the enzyme was studied by monitoring the redox cycle of FAD in the active site of NQO1. The UV-Vis absorption spectrum of native (oxidized) NQO1 is shown in Figure 3a. The stoichiometry of NADH was adjusted to 0.9 eq to avoid spontaneous reduction of the substrate by excess NADH. Upon addition of NADH to the assay mixture containing NQO1, the FAD absorption peak at 450 nm completely disappeared, due to its reduction to FADH2 (Figure 3b). Next, 1.2 eq of E2-3,4-Q or MD was added to the reaction mixture, which caused the peak at 450 nm to reappear (Figure 3c). Excess E2-3,4-Q (1.2 eq) was used in the assay so that it could outnumber any unreacted NADH and sufficient molecules would be available for enzyme catalysis. This observation is consistent with the regeneration of FAD from FADH2 after transfer of hydride. However, it is reasonable to assume that an increase in the peak at 450 nm reports on the reduction of the substrate, because it is the immediate product of hydride transfer from FADH2. At the completion of the substrate reduction, the spectrum of FAD was completely restored (Figure 3c). The UV spectra of controls, NADH, E2-3,4-Q or MD alone, are shown in Figures 3d-3f, respectively.
Figure 3.
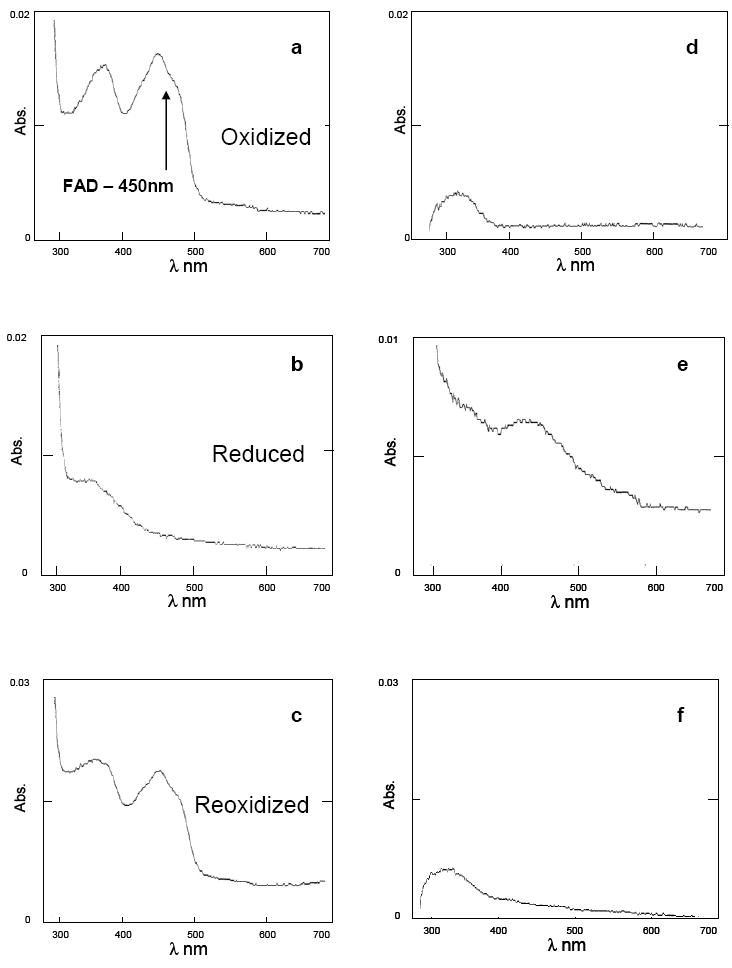
Spectral changes of NQO1 following addition of NADH and substrate (E2-3,4-Q or MD). The absorption spectra were measured after sequential addition of NQO1, NADH and substrate to 1 ml of 25 mM Tris-HCl, pH 6.8 at room temperature. The concentration of the enzyme was 10 U NQO1 (a). The spectra after addition of 0.9 eq NADH (b) and 1.2 eq substrate (c), in that order. The control spectra for 0.9 eq NADH alone (d), 1.2 eq E2-3,4-Q alone (e), and 1.2 eq MD alone (f) were also recorded from 280-700 nm.
When the dicumarol inhibitor was added to the assay mixture prior to addition of the cofactor, the NADH could not reduce FAD completely (Figures 4a-c). To confirm the reduction of E2-3,4-Q, the assay mixture was passed through a filter and subjected to LC/MS-MS analysis. The levels of 4-OHE2 in the assay mixture were ~ 5.1 fold higher compared to the control (Figure 5). When dicumarol, a potent inhibitor of NQO1, was added to the assay mixture, the formation of 4-OHE2 was reduced by 61 % compared to the assay carried out without inhibitor (Figure 5).
Figure 4.
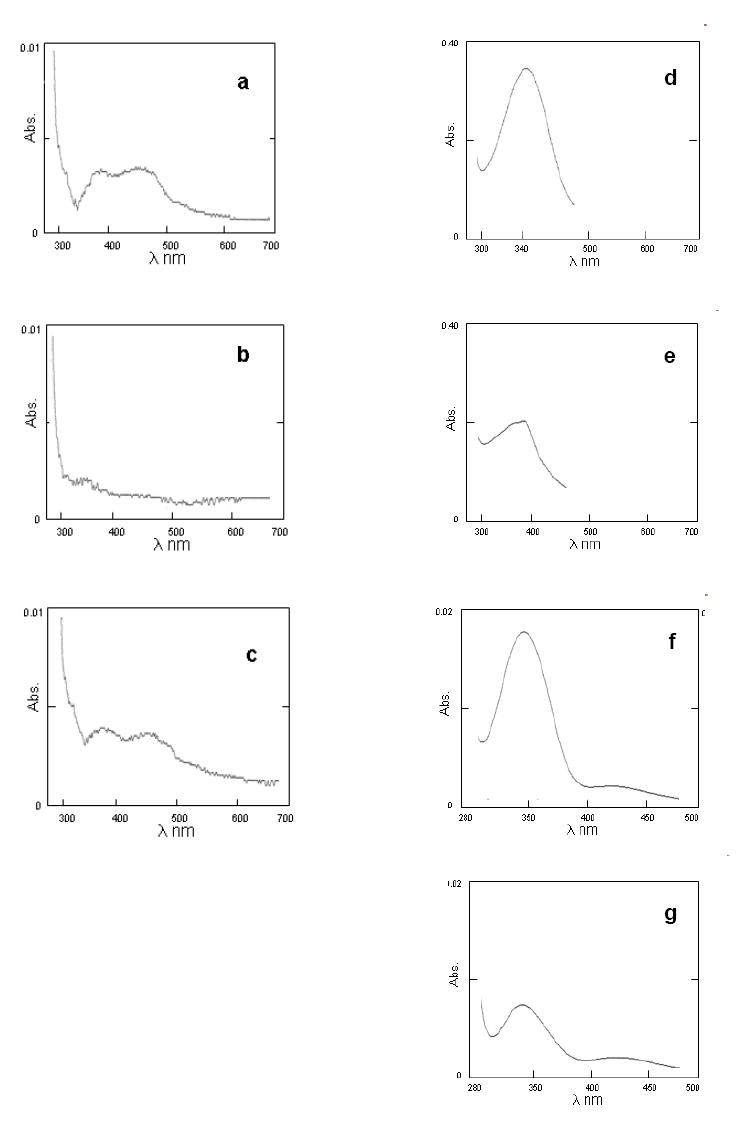
a, b, c. Inhibition of reduction of NQO1-FAD by NADH with dicumarol. The spectroscopic analysis was carried out as described in Methods. The absorption spectrum of 10 U NQO1 was recorded before (a) and after (b) addition of 0.9 eq NADH. In the inhibition studies, 10 μM dicumarol was added to a cuvette containing 10 U NQO1 prior to the addition of 0.9 eq NADH (c). d, e, f, g. Change in absorption spectra of NQO1-catalyzed reduction of MD and Phe-Q. To 1 ml buffer (25 mM Tris-HCl, pH 6.8) containing 0.7 mg/ml BSA in a 1-ml cuvette was added 100 μM NADH and either 50 μM MD (d) or Phe-Q (f) and the spectra were recorded from 280-500 nm. The reaction was initiated by addition of NQO1 (0.2 μg/ml final conc.) and the corresponding spectra were recorded, respectively (e and g).
Figure 5.

NQO1-catalyzed reduction of E2-3,4-Q in the presence of NADH as cofactor. To 1 ml buffer (25 mM Tris-HCl, pH 6.8) containing 0.7 mg/ml BSA in a 1.5-ml microfuge tube was added freshly prepared 10 U NQO1, 0.9 eq NADH and 1.2 eq E2-3,4-Q sequentially (A). Inhibition of NQO1 was obtained by addition of 10 μM dicumarol prior to addition of NADH and E2-3,4-Q (B). Control assays were carried out without substrate (C) or cofactor (D). The assay mixtures were filtered and injected on LC/MS for product analysis.
MD and Phe-Q were not reduced by NADH (Figures 4d and 4f), but after addition of NQO1, there was a significant reduction in the NADH spectrum at 340 nm (Figures 4e and 4g), indicating enzyme-catalyzed reduction.
NQO1 activity in the presence of THF cofactor
To avoid nonenzymatic reduction of E2-3,4-Q, we chose THF as the cofactor. This compound has a lower reducing potential than NADH. LC/MS-MS analysis of the extracted assay mixture shows the formation of 4-OHE2. The reduction of E2-3,4-Q in the assay was increased 1.3-fold compared to the control (Figure 6a). THF also nonenzymatically reduced E2-3,4-Q to some extent (Figure 6a). Involvement of the enzyme in the reduction of E2-3,4-Q was further supported by inhibitor studies. When dicumarol, a potent inhibitor of NQO1, was added to the assay mixture, the formation of 4-OHE2 was reduced by 35% compared to the control without inhibitor (Figure 6b). The enzyme had a maximum activity at pH 6.2 (data not shown) when THF was used as the cofactor.
Figure 6.
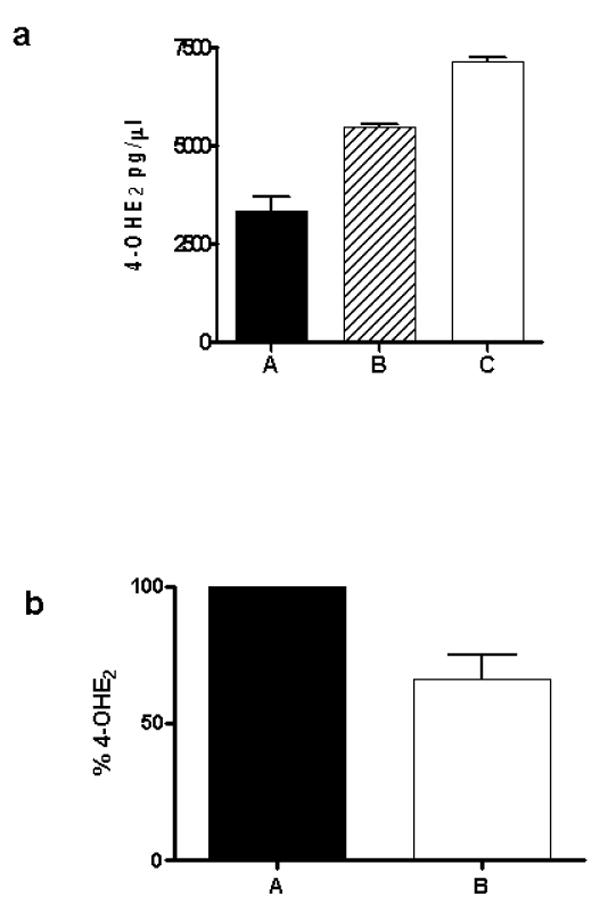
NQO1-catalyzed reduction of E2-3,4-Q in the presence of THF as cofactor (a). To 1 ml buffer (25 mM Tris-HCl, pH 6.2) containing 0.7 mg/ml BSA in a 1.5-ml microfuge tube was added freshly prepared NQO1 (0.2 μg/ml) and 50 μM E2-3,4-Q. The reaction was initiated by addition of the natural cofactor, THF (500 μM) to the assay mixture (C). Control assays were carried out without enzyme (B) or cofactor (A). The assay mixtures were extracted after 30 min with diethyl ether, and the extracts were injected on LC/MS for product analysis. (b) Percentage of 4-OHE2 formed in the absence (A) and presence (B) of 10 μM dicumarol.
DISCUSSION
For the first time, we have shown the non-covalent binding of the estrogen metabolite E2-3,4-Q with NQO1, as well as unequivocally demonstrated the NQO1-catalyzed reduction of E2-3,4-Q. Therefore, not only para-quinones, such as MD, are reduced by NQO1, but also ortho-quinones, such as E2-3,4-Q and Phe-Q (see below). Two strategies were developed to overcome nonenzymatic reduction of E2-3,4-Q by NADH during the NQO1 assay. The first involved reduction of the enzyme with NADH in the initial stage, followed by the use of reduced enzyme as a reducing agent for E2-3,4-Q. The second approach employed the use of a cofactor that has a lower reducing potential than NADH. For additional support of our results, we have also shown the NQO1-catalyzed reduction of a stable ortho-quinone, Phe-Q, which does not undergo nonenzymatic reduction in the presence of NADH.
The ESI-MS technique uses a soft ionization method, which has the advantage that labile ligand-protein, drug-DNA, etc. complexes are successfully analyzed intact [31,32]. The results of the ESI-MS analysis confirmed the binding of E2-3,4-Q with NQO1. The experimental data from MS analysis demonstrated an increase in the mass of 286 Da, which matches the theoretical increase in mass after substrate binding to NQO1 (Figure 2). When cholesterol is added as a control, there is no change in the mass spectrum compared to NQO1 alone. This is expected for the following reasons: one is the long, bulky side-chain at the C-17 position that can hinder the entry of cholesterol, 17.2 Å in length, into the binding pocket of the enzyme (Figure 1b). The second is that the binding site of the enzyme is lined with aromatic amino acids. Thus, it assists the substrate to get stabilized and aligned in the active site [14]. Ring A of cholesterol is non-aromatic; so, it fails to lodge in the binding site of the enzyme by pi-pi stacking with the aromatic amino acids (Figure 1b). It was reported previously that binding either by NADH or substrate causes a change in the conformation of NQO1 [15], which may be the reason why certain charged species have changed abundances in the mass spectra of NQO1-ligand complexes. Both E2-3,4-Q and MD caused a distinct shift in the charged state signals of NQO1 after binding, suggesting the formation of an NQO1-substrate physical complex. Substrate binding was further confirmed by deconvolution of ESI-MS spectra.
The NQO1 activity assay was carried out in two stages. First, in the absence of oxygen, NQO1 was stoichiometrically reduced with NADH, which transferred hydride to the FAD bound to the enzyme (Scheme 2). It has been suggested that the negative charge generated by hydride transfer is delocalized to the oxygen of the isoallozaxine of FAD, which takes a proton from the neighboring amino acid, tyrosine. After hydride transfer, the resulting NAD+ leaves and makes the binding pocket available for substrate binding [14]. Figure 3b reflects that the NQO1 enzyme is readily reduced by NADH, irrespective of a possible need for the presence of the substrate as an activating effector. In principle, FAD-NQO1 could be reduced by a number of natural and non-natural cofactors, as seen with FAD-NQO2 [33]. In the next step, hydride transfer from reduced flavin to ortho-quinone is carried out (Scheme 2). This transfer is primarily dependent upon the correct orientation and approach of the C-4 of the quinone ring of E2-3,4-Q and N-5 of the isoallozaxine. The reoxidation of FAD after addition of E2-3,4-Q, confirming the reduction of E2-3,4-Q in the binding pocket of NQO1, is shown in Figure 3c. The AM1 energy-minimized structure of E2-3,4-Q shows that the length of the molecule is ~10.9 Å, indicating that the catalytic site is big enough to accommodate the molecule with four rings (Figure 1a). After this reduction, the resulting hydroquinolate tautomerizes to catechol, 4-OHE2 (Scheme 2), and the isoallozaxine of FAD returns to the oxidized quinoid form. The regeneration of FAD implies that E2-3,4-Q has reached the binding pocket and it did not alkylate the binding site, corroborating the interpretation of our ESI-MS results. Based on the crystal structure of the NQO1-dicumarol complex, the inhibitor is thought to occupy the position in the binding pocket that is meant for NADH [34]. The effect of the competitive inhibitor dicumarol on the reduction of FAD-NQO1 is depicted in Figure 4. The peak at 450 nm suggests that the FAD is unreduced in the presence of dicumarol. This result corroborates very well the observations from the NQO1-dicumarol complex crystal structure analysis reported earlier [34].
Scheme 2.

Proposed mechanism for reduction of o-quinones by NQO1.
Subsequent LC-MS analysis of the reaction mixtures that were used for the above UV assays confirmed the higher levels of 4-OHE2 in the assay mixtures than in control mixtures, as well as inhibition of NQO1 by dicumarol (Figure 5). In these studies molar equivalents of NQO1, E2-3,4-Q and NADH were used to avoid the nonenzymatic reduction of substrate by NADH. The primary objective, for this modification, was to observe the enzyme catalysis, although in the biological system a different arrangement might be at work. Due to the limited addition of substrate and cofactor, a 5-fold increase of 4-OHE2 formation was observed compared to control.
Recently, it has been reported that THF, a natural cofactor, could be used as a cofactor of NQO2, although the enzyme activity was found to be lower [33]. Nonenzymatic reduction of E2-3,4-Q in the presence of THF was found to some extent (Figure 6a). But the LC/MS-MS analytical method was sensitive enough to show that higher levels of 4-OHE2 formed in the assay mixture than in control, clearly indicating that NQO1 catalyzes reduction of E2-3,4-Q when THF was used as the cofactor. The involvement of the enzyme in the E2-3,4-Q reduction was further confirmed by inhibitor studies. Corroboration of the earlier observation that NQO1 activity with the THF cofactor was significantly lower was evidenced by a marginal increase in catechol formation.
Till now, almost all articles have reported para-quinones such as MD as substrates for NQO1. To further support the reduction of E2-3,4-Q, and in general other ortho-quinones by NQO1, we have used the stable ortho-Phe-Q as a substrate. The UV spectra obtained indicate that NQO1 accepts Phe-Q as its substrate (Figure 4). Our results suggest that NQO1 can catalyze reduction of a variety of both ortho as well as para quinones. In fact, our preliminary studies also indicated that NQO2 might catalyze as well the reduction of estrogen quinones (See Supporting Data). This ability of NQO1 may be due in part to its reasonably wide binding site that can accommodate structurally diverse substrates. In conclusion, E2-3,4-Q is a substrate of NQO1, and NQO1 has a significant role in deactivation of estrogen ortho-quinones that might lead to the initiation of cancer after formation of depurinating DNA adducts. These findings also have broad implications regarding the development of potential inducers of NQO1 that could ultimately prevent estrogen-initiated carcinogenesis.
Acknowledgments
This research was supported by U.S. Public Health Service grant CA 49210 from the National Cancer Institute and DAMD17-03-1-0229 from the U.S. Army Breast Cancer Research Program. Core support at the Eppley Institute was provided by grant P30 CA36727 from the National Cancer Institute.
ABBREVIATIONS
- E2-3,4-Q
estradiol-3,4-quinone
- ESI
electrospray ionization
- LC/MS
liquid chromatography/mass spectrometry
- MD
menadione
- MRM
multiple reaction monitoring
- NI
negative ion
- NQO1
NAD(P)H:quinone oxidoreductase
- 4-OHE2
4-hydroxyestradiol
- Phe-Q
ortho-9,10-phenanthrene quinone
- PI
positive ion
- THF
tetrahydrofolic acid
Footnotes
Publisher's Disclaimer: This is a PDF file of an unedited manuscript that has been accepted for publication. As a service to our customers we are providing this early version of the manuscript. The manuscript will undergo copyediting, typesetting, and review of the resulting proof before it is published in its final citable form. Please note that during the production process errors may be discovered which could affect the content, and all legal disclaimers that apply to the journal pertain.
References
- 1.Ross D, Siegel S. NAD(P)H:Quinone Oxidoreductaes 1 (NQO1, DT-diaphorase), Functions and Pharmacogenetics. Methods in Enzymol. 2004;382:115–144. doi: 10.1016/S0076-6879(04)82008-1. [DOI] [PubMed] [Google Scholar]
- 2.Kiyohara C, Yoshimasu K, Takayama K, Nakanishi Y. NQO1, MPO, and the risk of lung cancer: A HuGE review. Genetics in Medicine. 2005;7:463–478. doi: 10.1097/01.gim.0000177530.55043.c1. [DOI] [PubMed] [Google Scholar]
- 3.Bianco NR, Chaplin LJ, Montano MM. Differential induction of quinone reductase by phytoestrogens and protection against oestrogen -induced DNA damage. Biochem J. 2005;385:279–287. doi: 10.1042/BJ20040959. [DOI] [PMC free article] [PubMed] [Google Scholar]
- 4.Radjendirane V, Joseph P, Lee Y-H, Kimura S, Klein-Szanto A, Gonzalez FJ, Jaiswal AK. Disruption of the DT diaphorase (NQO1) gene in mice leads to increased menadione toxicity. J Biol Chem. 1998;273:7382–7389. doi: 10.1074/jbc.273.13.7382. [DOI] [PubMed] [Google Scholar]
- 5.Bauer AK, Faiola B, Abernethy DJ, Marchan R, Pluta LJ, Wong VA, Roberts K, Jaiswal AK, Gonzalez FJ, Butterworth BE, Borghoff S, Parkinson H, Everitt J, Recio L. Genetic susceptibility to benzene-induced toxicity role of NADPH: Quinone oxidoreductase-1. Cancer Res. 2003;63:929–935. [PubMed] [Google Scholar]
- 6.Long DJ, II, Waikel RL, Wang X-J, Roop DR, Jaiswal AK. NAD(P)H : quinone oxidoreductase 1 deficiency and increased susceptibility to 7,12-Dimethylbenz[a]- anthracene-induced carcinogenesis in mouse skin. J Nat Cancer Inst. 2001;93:1166–1170. doi: 10.1093/jnci/93.15.1166. [DOI] [PubMed] [Google Scholar]
- 7.Hsieh T-C, Lu X, Wang Z, Wu JM. Induction of quinone reductase NQO1 by resveratrol in human K562 cells involves the antioxidant response element ARE and is accompanied by nuclear translocation of transcription factor Nrf2. Med Chem. 2006;2:275–285. doi: 10.2174/157340606776930709. [DOI] [PubMed] [Google Scholar]
- 8.Moon YJ, Wang X, Morris ME. Dietary flavonoids: Effects on xenobiotic and carcinogen metabolism. Toxicol in Vitro. 2006;20:187–210. doi: 10.1016/j.tiv.2005.06.048. [DOI] [PubMed] [Google Scholar]
- 9.Alvarez S, Boveris A. Antioxidant adaptive response in human blood mononuclear cells exposed to UVB. J Photochem Photobiol B: Biology. 1997;38:152–157. doi: 10.1016/s1011-1344(96)07436-2. [DOI] [PubMed] [Google Scholar]
- 10.Suzuki M, Amano M, Choi J, Park HJ, Williams BW, Ono K, Song CW. Synergistic effects of radiation and beta-lapachone in DU-145 human prostate cancer cells in vitro. Radiation Res. 2006;165:525–531. doi: 10.1667/RR3554.1. [DOI] [PubMed] [Google Scholar]
- 11.Ernster L, Atallah AS, Hochstein P. DT diaphorase and the cytotoxicity and mutagenicity of quinone-derived oxygen radicals. Prog Clin Biol Res. 1986;209A:353–363. [PubMed] [Google Scholar]
- 12.Nioi P, Hayes JD. Contribution of NAD(P)H:quinone oxidoreductase 1 to protection against carcinogenesis, and regulation of its gene by the Nrf2 basic-region leucine zipper and the arylhydrocarbon receptor basic helix-loop-helix transcription factors. Mutat Res. 2004;555:149–171. doi: 10.1016/j.mrfmmm.2004.05.023. [DOI] [PubMed] [Google Scholar]
- 13.Faig M, Bianchet MA, Winski S, Hargreaves R, Moody CJ, Hudnott AR, Ross D, Amzel LM. Structure-based development of anticancer drugs. Complexes of NAD(P)H: quinone oxidoreductase 1 with chemotherapeutic quinines. Structure. 2001;9:659–667. doi: 10.1016/s0969-2126(01)00636-0. [DOI] [PubMed] [Google Scholar]
- 14.Li R, Bianchet MA, Talalay P, Amzel LM. The three-dimensional structure of NAD(P)H: quinone reductase, a flavoprotein involved in cancer chemoprotection and chemotherapy: Mechanism of the two-electron reduction. Proc Nat Acad Sci (USA) 1995;92:8846–8850. doi: 10.1073/pnas.92.19.8846. [DOI] [PMC free article] [PubMed] [Google Scholar]
- 15.Winski SL, Faig M, Bianchet MA, Siegel D, Swann E, Fung K, Duncan MW, Moody CJ, Amzel LM, Ross D. Characterization of a mechanism-based inhibitor of NAD(P)H: Quinone oxidoreductase 1 by biochemical, x-ray crystallographic, and mass spectrometric approaches. Biochemistry. 2001;40:15135–15142. doi: 10.1021/bi011324i. [DOI] [PubMed] [Google Scholar]
- 16.Lewis AM, Ough M, Hinkhouse MM, Tsao M-S, Oberley LW, Cullen JJ. Targeting NAD(P)H: quinone oxidoreductase (NQO1) in pancreatic cancer. Molecular Carcinogenesis. 2005;43:215–224. doi: 10.1002/mc.20107. [DOI] [PMC free article] [PubMed] [Google Scholar]
- 17.Malkinson AM, Siegel D, Forrest GL, Gazdar AF, Oie HK, Chan DC, Bunn PA, Mabry M, Dykes DJ, Harrison SD. Elevated DT-diaphorase activity and messenger RNA content in human non-small cell lung carcinoma: Relationship to the response of lung tumor xenografts to mitomycin Cl. Cancer Res. 1992;52:4752–4757. [PubMed] [Google Scholar]
- 18.Cresteil T, Jaiswal AK. High levels of expression of the NAD(P)H:Quinone oxidoreductase (NQO1) gene in tumor cells compared to normal cells of the same origin. Biochem Pharmacol. 1991;42:51021–51027. doi: 10.1016/0006-2952(91)90284-c. [DOI] [PubMed] [Google Scholar]
- 19.Mikami K, Naito M, Ishiguro T, Yano H, Tomida A, Yamada T, Tanaka N, Shirakusa T, Tsuruo T. Immunological quantitation of DT-diaphorase in carcinoma cell lines and clinical colon cancers: Advanced tumors express greater levels of DT-diaphorase. Jpn Cancer Res. 1998;89:910–915. doi: 10.1111/j.1349-7006.1998.tb00648.x. [DOI] [PMC free article] [PubMed] [Google Scholar]
- 20.Singh S, Chakravarti D, Edney JA, Hollins RR, Cavalieri E, Rogan EG. Relative imbalances in the expression of estrogen-metabolizing enzymes in the breast tissue of women with breast carcinoma. Oncol Rep. 2005;14:1091–1096. [PubMed] [Google Scholar]
- 21.Cavalieri E, Chakravarti D, Guttenplan J, Hart E, Ingle J, Jankowiak R, Muti P, Rogan E, Russo J, Santen R, Sutter T. Catechol estrogen quinones as initiators of breast and other human cancers: Implications for biomarkers of susceptibility and cancer prevention. BBA-Reviews on Cancer. 2006;1766:63–78. doi: 10.1016/j.bbcan.2006.03.001. [DOI] [PubMed] [Google Scholar]
- 22.Cavalieri E, Frenkel K, Liehr JG, Rogan E, Roy D. Chapter 4: Estrogens as endogenous genotoxic agents - DNA adducts and mutations. J Nat Cancer Inst. 2000;27:75–94. doi: 10.1093/oxfordjournals.jncimonographs.a024247. [DOI] [PubMed] [Google Scholar]
- 23.Chakravarti D, Mailander PC, Li K-M, Higginbotham S, Zhang HL, Gross ML, Meza JL, Cavalieri EL, Rogan EG. Evidence that a burst of DNA depurination in SENCAR mouse skin induces error-prone repair and forms mutations in the H-ras gene. Oncogene. 2001;20:7945–7953. doi: 10.1038/sj.onc.1204969. [DOI] [PubMed] [Google Scholar]
- 24.Nutter LM, Zhou B, Sierra EE, Wu YY, Rummel MM, Gutierrez P, Abul-Hajj Y. Cellular biochemical determinants modulating the metabolism of estrone 3,4-quinone. Chem Res Toxicol. 1994;7:609–613. doi: 10.1021/tx00041a004. [DOI] [PubMed] [Google Scholar]
- 25.Shen L, Pisha E, Huang Z, Pezzuto JM, Krol E, Alam Z, van Breemen RB, Bolton JL. Bioreductive activation of catechol estrogen-ortho-quinones: aromatization of the B ring in 4-hydroxyequilenin markedly alters quinoid formation and reactivity. Carcinogenesis. 1997;18:1093–1101. doi: 10.1093/carcin/18.5.1093. [DOI] [PubMed] [Google Scholar]
- 26.Saeed M, Zahid M, Rogan E, Cavalieri E. Synthesis of the catechols of natural and synthetic estrogens by using 2-iodoxybenzoic acid (IBX) as the oxidizing agent. Steroids. 2005;70:173–178. doi: 10.1016/j.steroids.2004.11.005. [DOI] [PubMed] [Google Scholar]
- 27.Dwivedy I, Devanesan P, Cremonesi P, Rogan E, Cavalieri E. Synthesis and characterization of estrogen 2,3- and 3,4-quinones. Comparison of DNA adducts formed by the quinones versus horseradish peroxidase-activated catechol estrogens. Chem Res Toxicol. 1992;5:828–833. doi: 10.1021/tx00030a016. [DOI] [PubMed] [Google Scholar]
- 28.Anon . NIH Guidelines for the laboratory use of chemical carcinogens, NIH Publication No. 81-2385. US Govt. Printing Office; Washington, DC: 1981. [Google Scholar]
- 29.van Duijn E, Simmons DA, van den Heuvel RHH, Bakkes PJ, van Heerikhuizen H, Heeren RMA, Robinson CV, van der Vies SM, Heck AJR. Tandem mass spectrometry of intact GroEL-substrate complexes reveals substrate-specific conformational changes in the trans ring. J Am Chem Soc. 2006;128:4694–4702. doi: 10.1021/ja056756l. [DOI] [PubMed] [Google Scholar]
- 30.Vermeiren CL, Pluym M, Mack J, Heinrichs DE, Stillman MJ. Characterization of the heme binding properties of staphylococcus aureus IsdA. Biochemistry. 2006;45:12867–12875. doi: 10.1021/bi0607711. [DOI] [PubMed] [Google Scholar]
- 31.Felitsyn N, Peschke M, Kebarle P. Origin and number of charges observed on multiply-protonated native proteins produced by ESI. Int J Mass Spec. 2002;219:39–62. [Google Scholar]
- 32.Beck JL, Colgrave ML, Ralph SF, Sheil MM. Electrospray ionization mass spectrometry of oligonucleotide complexes with drugs, metals, and proteins. Mass Spec Rev. 2001;20:61–87. doi: 10.1002/mas.1003. [DOI] [PubMed] [Google Scholar]
- 33.Boutin JA, Chatelain-Egger F, Vella F, Delagrange P, Ferry G. Quinone reductase 2 substrate specificity and inhibition pharmacology. Chem-Biol Interact. 2005;151:213–228. doi: 10.1016/j.cbi.2005.01.002. [DOI] [PubMed] [Google Scholar]
- 34.Asher G, Dym O, Tsvetkov P, Adler J, Shaul Y. The crystal structure of NAD(P)H quinone oxidoreductase 1 in complex with its potent inhibitor dicoumarol. Biochemistry. 2006;45:6372–6378. doi: 10.1021/bi0600087. [DOI] [PubMed] [Google Scholar]