Summary
Pathogenic Yersinia spp. possess a protein secretion system, designated as type 3, that plays a clear role in promoting their survival vis-à-vis the macrophage. Inductive expression of the Yersinia type 3 secretion system (T3SS), triggered either by host cell contact, or, in the absence of host cells, by a reduction in extracellular calcium ion levels, is accompanied by a withdrawal from the bacterial division cycle. Here we analyzed Ca2+-dependent induction of the T3SS at the single cell level to understand how Yersinia coordinate their pro-survival and growth-related activities. We utilized a novel high-throughput quantitative microscopy approach as well as flow cytometry to determine how Ca2+ levels, T3SS expression, and cellular division are interrelated. Our analysis showed that there is a high degree of homogeneity in terms of T3SS expression levels among a population of Y. pseudotuberculosis cells following the removal of Ca2+ and that T3SS expression appear to be independent of the cellular division cycle. Unexpectedly, our analysis showed that Ca2+ levels are inversely related to the initiation of inductive T3SS expression, and not to the intensity of activation once initiated, thus providing a basis for the seemingly graded response of T3SS activation observed in bulk-level analyses. The properties of the system described here display both similarities and differences with that of the lac operon first described 50 years ago by Novick and Weiner.
Keywords: Gene expression, induction, Yersinia, type 3 secretion, Yops
Introduction
There has been a long-standing interest in the relationship between the growth characteristics of Yersinia spp. (nee Pasteurella) and virulence. Several workers, most notably Surgalla, observed an attenuation of virulence upon prolonged cultivation of Y. pestis at 37 °C1. Higuchi and colleagues found that the addition of skim milk preparations to the basic growth medium forestalled this temperature-induced loss of virulence; the active compound was quickly identified as Ca2+ (refs. 2,3). It became readily apparent that millimolar levels of Ca2+ were required for virulent Y. pestis to grow at 37 °C and if levels of Ca2+ fell below a certain threshold, avirulent ‘mutants’ would soon predominant the cultures. What was odd though was the seemingly high frequency of this virulence to avirulence transition, calculated to be approximately 10−4 per bacterial generation, a value much too high to be explained by simple genetics4. The underlying basis for this phenomenon remained enigmatic until the early 1980's when several groups reported that ‘growth restriction’ (i.e. the inability of virulent Y. pestis, as well as the enteropathogenic Y. pseudotuberculosis and Y. enterocolitica, to proliferate at 37 °C in low calcium-containing media) was associated with the presence of a ∼70-kb extrachromosomal plasmid that in turn was shown to direct the massive secretion of Yersiniaouter proteins, or Yops5-9. Subsequently it was found that this appropriately-named ‘virulence plasmid’ encoded the components of a secretion system that directly delivers at least 6 Yops (which are also encoded on the virulence plasmid) directly into the host cell cytoplasm10,11. About this same time it was found that this protein delivery system, which was designated as ‘type 3’, was in fact widely distributed among several genera of bacteria and involved in a variety of both parasitic and mutualistic types of associations with eukaryotic cells12,13.
In the yersiniae, regulation of the type 3 secretion system (T3SS) is remarkably complex and is sensitive to a variety of culture conditions14. The basic regulatory circuit consist of a transcriptional activator (LcrF) that directs the expression of the various plasmid-encoded transcriptional units up to a certain level in the presence of millimolar Ca2+ at 37 °C15,16. Under these conditions further expression of T3S-encoded transcripts (and resulting proteins) are repressed by cytosolic LcrQ/SycH and YopD/SycD complexes17-19. An additionally layer of regulation occurs at the level of secretion that is controlled by both cytosolic and extracellular regulatory proteins. Of the latter, YscF, a small protein that is itself secreted by the T3SS, polymerizes on the exterior of the bacterial cell that may function directly as a Ca2+ sensor20,21. When extracellular Ca2+ levels fall to the low millimolar range, cytosolic LcrQ and YopD are exported from the bacterial cell by the T3SS further elevating the levels of T3SS-encoding transcripts22.
In contrast to our knowledge of the key components that regulate T3SS activity, the molecular mechanisms linking T3SS activity and the bacterial division cycle are completely unknown despite the fact that their inverse relationship has been known for almost 50 years and should, at least in theory, be amendable to positive genetic selection. To fully address this issue require some understanding of how T3SS expression and cellular division are coordinated at the level of the single cell. For example, before molecular correlates in an ‘induced’ population can be identified, one should determine whether every cell is at a similar level of induction or if the population actually consists of a mixture of fully induced and completely uninduced cells. In fact the latter situation has now been documented for a variety of bacterial induction systems and was termed ‘all-or-none’ when it was first described by Novick and Weiner in their studies of the lac operon23,24.
An equally enigmatic issue is how T3SS expression and cellular division are coordinated during the infection cycle. It is clear that these two activities occur simultaneously among a population of Yersinia in cell culture infection systems25. But again, it is unknown how an individual bacterium manages these two activities when faced with a macrophage. To begin to address this issue, we analyzed single Y. pseudotuberculosis cells in order to understand the kinetics of inductive T3SS expression and its relationship to the division cycle.
Results
Graded growth restriction and YopE expression
We analyzed Ca2+-dependent growth restriction and T3SS activation using the protocol developed by Brubaker and colleagues26,27. In our standard assay, we propagated Y. pseudotuberculosis (YPT) at 26 °C in defined Thoroughly Modified Higuchi's (TMH) media supplemented with 2.5mM CaCl2. Saturated cultures were diluted to OD600 of ∼0.1 in the same media and propagated for an additional 2 hr at 26 °C. These early log phase cultures were then shifted to 37 °C for 1 hr and full T3SS activation was initiated in the thermally-induced cultures by adding the Ca2+ ion chelator EGTA.
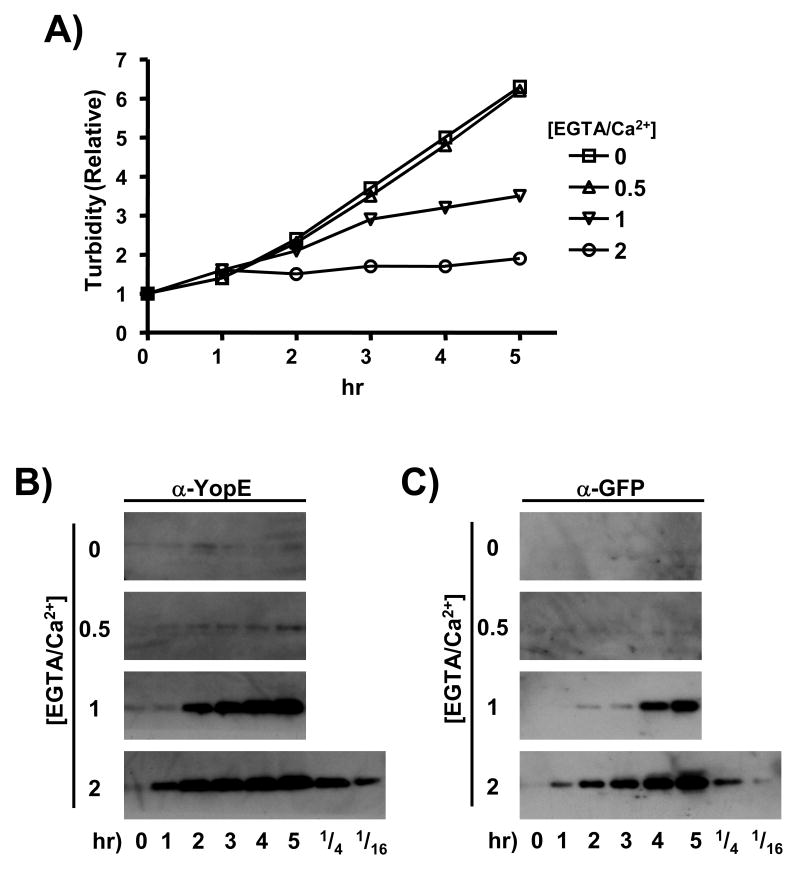
Adding a 2-fold molar excess of EGTA over Ca2+ to a thermally-induced YPT culture resulted in maximal growth cessation in which the culture maintained a stationary-like phase at a greatly reduced optical density (and titer, not shown) compared to non-EGTA-treated cultures (Fig. 1A). The growth of a YPT strain cured of the virulence plasmid was completely insensitive to EGTA when similarly analysed (not shown). Reduction of the [EGTA]/[Ca2+] ratio resulted in a corresponding increase in the terminal optical density (and titer) of the stationary-like phase. We observe little or no differences in the growth plots between non-EGTA-treated cultures and cultures containing a [EGTA]/[Ca2+] ratio 0.5 or less (Fig. 1A). We tested various YPT strains and varied the composition of the growth media to be certain that this graded relationship between the [EGTA]/[Ca2+] ratio and growth cessation was in fact due to the well-documented link between free Ca2+ ion concentration and the 72-kb virulence plasmid (see Materials and Methods for details). We observe similar graded relationships between the [EGTA]/[Ca2+] ratio and growth cessation for both Y. pestis and Y. enterocolitica (not shown).
Figure 1.
Ca2+-dependent growth restriction and YopE/GFP levels in the YPT/yopE::gfp strain. (A) The YPT/yopE::gfp strain was grown to saturation at 26 °C in a defined media supplemented with 2.5 mM CaCl2, diluted 50-fold in the same media, and then propagated for 2 hrs at 26 °C followed by 1 hr at 37 °C by which time the titer was approximately 1 × 10⁸ cfu/ml. The culture was then divided into fourths (time 0), with each part receiving EGTA at a final concentration of either 0, 1.25, 2.5, or 5 mM (resulting in molar ratios of EGTA/Ca2+ of 0, 0.5, 1, and 2, respectively). At the indicated time points the turbidity of each culture was determined by measuring the OD600. (B) In the same experiment shown in (A) and at the same time points, samples of each culture were removed and YopE protein levels from combined whole cell and supernatant fractions derived from an equivalent number of bacterial cells (determined by viable plating) were assessed by immunoblotting. Dilutions of the 5 hr sample from the [EGTA/Ca2+] = 2 culture are shown on the lowest blot. (C) The blots shown in (B) were stripped and re-probed with a GFP-specific antiserum.
Concomitant with Ca2+-dependent growth cessation is the enhanced expression and secretion of the virulence-encoded Yop proteins. There is a >16-fold increase in total YopE levels after 1 hr of full induction (i.e. [EGTA]/[Ca2+] = 2) (Fig. 1B). Cultures incubated in [EGTA]/[Ca2+] = 1 required an additional hour to achieved a comparable level of YopE and the YopE levels in the culture incubated in [EGTA]/[Ca2+] = 0.5 were only slightly above the non-EGTA-treated culture. The YPT strain used in this experiment contains a GFP-encoding sequence inserted between the stop codon and transcriptional termination sequence of the endogenous yopE locus; this alteration of the yopE transcription unit has no detectable effect on the infectivity of this strain (henceforth designated as the YPT/yopE::gfp strain) in either cell culture- or animal-based assays25. The pattern of GFP expression as a function of [Ca2+] is identical to that of YopE (Fig. 1C) and resembles what has recently been reported for Y. pestis using a similar approach28. An important difference between the two products of this engineered operon in the YPT/yopE::gfp strain is that following its synthesis, YopE is a substrate for the T3S complex and is immediately exported from the bacterial cell in low-Ca2+ conditions (hence its synthesis and secretion closely match) whereas GFP is retained within the bacterium following its synthesis. These data show that, like growth cessation, there is a graded relationship between free [Ca2+] and yopE promoter activity.
Single-cell analysis of Ca2+-dependent yopE promoter activity
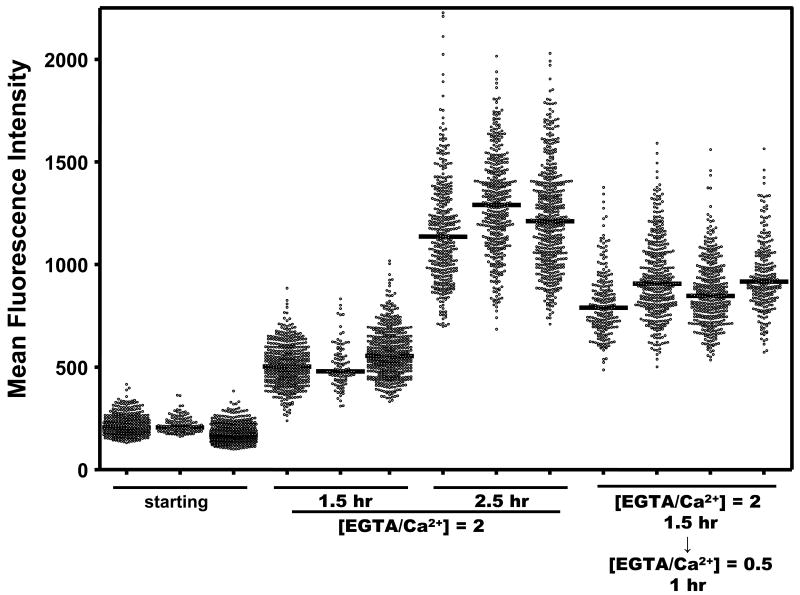
We developed a quantitative microscopy-based technique to analyze Ca2+-dependent yopE promoter activity in individual YPT/yopE::gfp bacteria. This strain was cultivated as described above and fluorescence levels of individual bacteria (shown in Fig. 2) were measured using high-throughput imaging and data processing techniques (see Materials and Methods and Fig. 3 legend). It is important to note that for the conditions used in this analysis, YPT/yopE::gfp bacteria possessed a detectible level of fluorescence at time 0. In maximal induction conditions ([EGTA]/[Ca2+] = 2), the mean fluorescence intensities (MFI; fluorescence normalized to area) of individual YPT/yopE::gfp bacteria increased 2.7- and 6.2-fold after 1.5 and 2.5 hr, respectively (Fig. 3 and Table I). If after 1.5 hr incubation in maximal inductive conditions, the YPT/yopE::gfp strain is switched to minimal inductive conditions ([EGTA]/[Ca2+] = 0.5) for an additional 1 hr, the MFIs of individual bacteria are much lower compared to bacteria that were incubated a full 2.5 hr in maximal inductive conditions. [The replenishment of Ca2+ to the growth medium also resulted in an almost immediate (∼20 min) rise in the optical density and cell titers (not shown), a result previously reported for Y. pestis29.] These data show that we can follow changes in yopE promoter activity in individual bacteria as a function of Ca2+ concentration.
Figure 2.
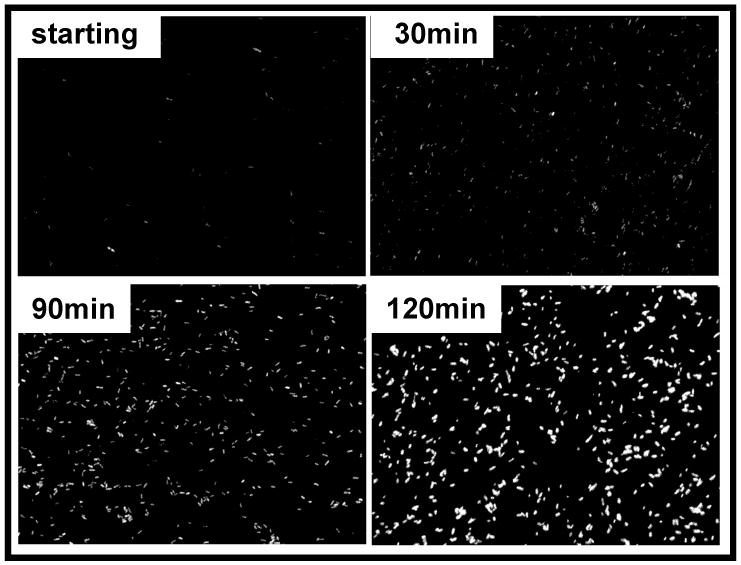
Ca2+-dependent fluorescence in individual YPT/yopE::gfp cells. The YPT/yopE::gfp strain was cultured as described in Fig. 1 induced at time 0 by adding EGTA such that [EGTA/Ca2+] = 2. At the indicated times bacterial cells were removed from the culture and examined by fluorescence microscopy.
Figure 3.
Quantifying Ca2+-dependent fluorescence in individual YPT/yopE::gfp cells. The YPT/yopE::gfp strain was cultured, induced, and imaged as described in Figs. 1 and 2. Each column represents the fluorescence intensities of every bacterial cell in a single field (equivalent to what is shown in a single panel in Fig. 2). Details of the quantification protocol are provided in the Materials & Methods. The four fields on the right were from a culture that was cultivated 1.5 hr in maximal inductive conditions ([EGTA/Ca2+] = 2) followed by a 1 hr cultivation in minimal inductive conditions achieved by adding CaCl2 such that [EGTA/Ca2+] = 0.5. Bars represent the population median and the statistical analysis of this experiment is presented in Table I.
Table I.
Statistical analysis of the Ca2+-dependent fluorescence in individual YPT/yopE::gfp cellsa
| Condition | Time point | Field | Nb | Normalityc | Median | Std Dev/Mean |
|---|---|---|---|---|---|---|
| starting | 0 hr | 1 | 419 | no | 205 | 50/217 |
| 2 | 125 | no | 206 | 39/217 | ||
| 3 | 519 | no | 168 | 45/178 | ||
| Composite | 1063 | no | 189 | 50/198 (=0.25) | ||
| [EGTA/Ca2+] = 2 | 1.5 hr | 1 | 458 | yes | 502 | 103/508 |
| 2 | 100 | yes | 480 | 107/507 | ||
| 3 | 489 | no | 555 | 119/570 | ||
| Composite | 1047 | no | 526 | 115/537 (=0.21) | ||
| 2.5 hr | 1 | 365 | yes | 1137 | 258/1164 | |
| 2 | 401 | yes | 1291 | 242/1293 | ||
| 3 | 478 | yes | 1211 | 252/1228 | ||
| Composite | 1245 | yes | 1213 | 258/1231 (=0.21) | ||
| [EGTA/Ca2+] = 2 → [EGTA/Ca2+] = 0.5 | 2.5 hr (1.5 + 1) | 1 | 211 | yes | 791 | 162/813 |
| 2 | 381 | yes | 907 | 196/934 | ||
| 3 | 364 | yes | 847 | 166/863 | ||
| 4 | 233 | no | 917 | 174/944 | ||
| Composite | 1189 | no | 873 | 183/893 (=0.21) |
Individual data points are plotted in Fig. 3.
Number of individual cells in the entire field recognized by the imaging procedures described in Material and Methods.
Normal distribution with α = 0.05.
Two key findings emerged from a statistical analysis of the experiment shown in Fig. 3. Firstly, the MFIs at any given point following the removal or replenishment of Ca2+ to the growth medium are normally distributed around the mean. Secondly, the coefficient of variation, or noise, defined as the ratio of the standard deviation to the mean of the population, remains remarkably constant at the different sampling points (Table I). This latter point deserves emphasis since at first glance it appears that the standard deviation increases with increasing induction periods; this increase, however, is in lock-step with the increase in the mean of the absolute signal. These data indicate that under these inductive conditions the population is highly homogenous with respect to T3SS expression levels.
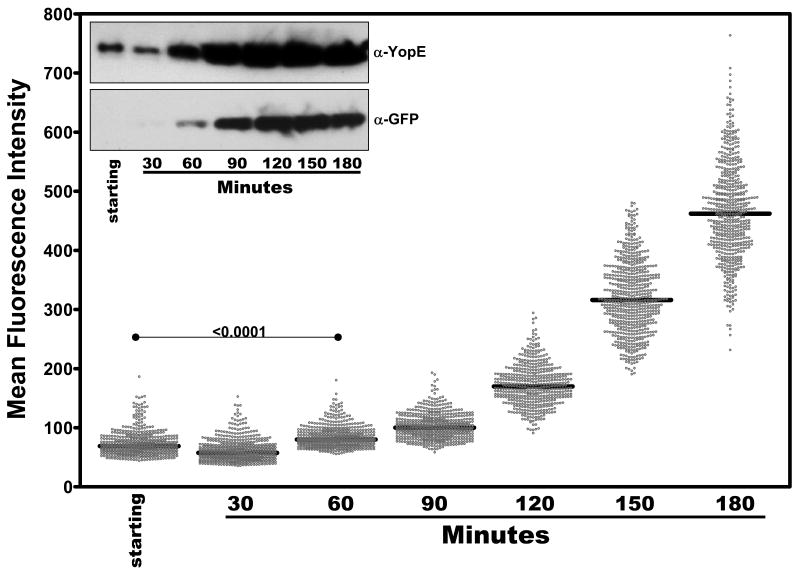
As mentioned in the Introduction, there are distinct temperature- and calcium ion-sensitive mechanisms that regulate expression levels of the T3SS in Yersinia. In the experiment shown in Fig. 3, cultures had been thermally induced for one hour at 37 °C prior to the removal of free Ca2+; therefore only the Ca2+-sensitive component of T3SS regulation was being assayed. To determine the induction profile of YPT/yopE::gfp bacteria starting at their ‘ground state’ (i.e. 26 °C/2.5mM Ca2+), we repeated the analysis described in Fig. 3 with cultures that had been simultaneously shifted to 37 °C and low-Ca2+ conditions ([EGTA]/[Ca2+] = 2). As expected, using this scheme the levels of fluorescence of individual YPT/yopE::gfp bacteria at the beginning of the induction period (‘starting’) were lower than bacteria that had been shifted to 37 °C for 1 hr prior to Ca2+ depletion (Fig. 4; compare to Fig. 3). Although there was a modest increase in fluorescence after 60 min, bacteria from these cultures required ∼2 hr to achieve a level of fluorescence that was obtained after 30 min by YPT/yopE::gfp bacteria induced using our standard method (Fig. 4; compare to Fig. 5 below). Following this initial lag phase, however, the levels of fluorescence of individual YPT/yopE::gfp bacteria increase with comparable kinetics as bacteria induced by our standard method both in terms of fold-increases between sampling times as well as the relationship between the standard deviation and the absolute signal (see above and Fig. 4 legend).
Figure 4.
Kinetic analysis of individual YPT/yopE::gfp cells following a simultaneous shift of temperature and Ca2+ levels. The YPT/yopE::gfp strain was cultured as described in Figs. 1 and 2 except that following dilution, the culture was incubated for 3 hrs at 26 °C at which time the temperature was shifted to 37 °C and EGTA was added ([EGTA/Ca2+] = 2). At the indicated time points cells were removed and analyzed for YopE and GFP protein levels by immunoblotting (inset) as in Fig. 1B and fluorescence as described in Fig. 3. In each column, 500-600 cells were plotted from at least three different fields. The fluorescent levels of bacteria analyzed at the 120, 150, and 180 sampling points are normally distributed around the mean (α = 0.05) and the coefficient of variation (standard deviation/mean of the absolute signals) was calculated as 0.2, 0.18, and 0.17, respectively.
Figure 5.
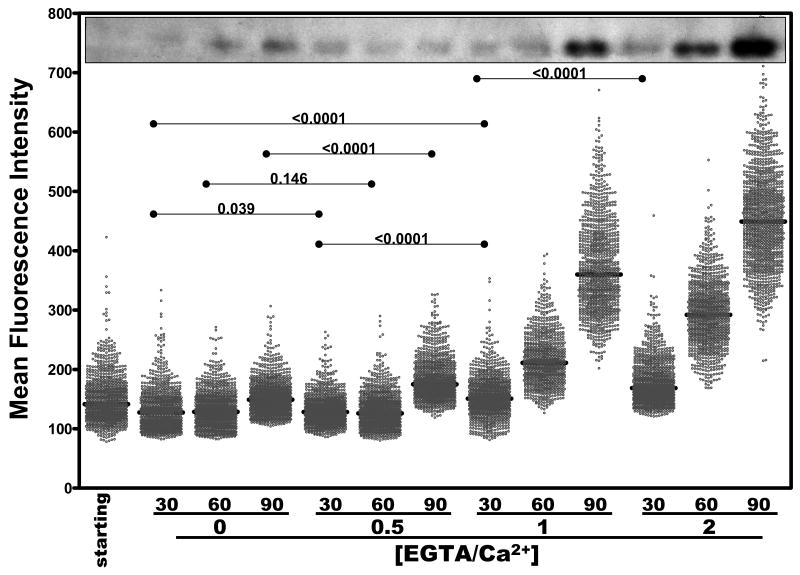
Kinetic analysis of Ca2+-dependent fluorescence in individual YPT/yopE::gfp cells as a function of EGTA/Ca2+ molar ratios. The YPT/yopE::gfp strain was cultured, induced, and imaged as described in Figs. 1 and 2. At the indicated time points cells were removed and analyzed for either YopE protein levels by immunoblotting (upper inset) as in Fig. 1B or for fluorescence as described in Fig. 3. In each column, 1000-1500 cells were plotted from at least three different fields. Bars represent the population median and statistical comparisons between selected groups are shown above the data points.
yopE promoter activity as a function of [Ca2+] in individual cells
In bulk culture analysis, there is a dose-dependent relationship between Ca2+ levels in the growth medium and YopE/GFP levels (Fig. 1). To determine how these parameters are related in individual bacteria, we repeated the experiment shown in Fig. 3 but varied the level of free Ca2+ as was done in the experiment shown in Fig. 1. The MFI of non-EGTA-treated bacteria ([EGTA]/[Ca2+] = 0) did not appreciably change over the course of the 90 min analysis period (Fig. 5). Following their transfer to maximal induction conditions ([EGTA]/[Ca2+] = 2), the MFIs of individual bacteria was slightly enhanced after 30 min, and, similar to what is shown in Fig. 3, was ∼3-fold higher after 90 min. And consistent with the bulk analysis, individual bacteria cultivated in media containing [EGTA]/[Ca2+] of 0.5 and 1, displayed corresponding intermediate levels of fluorescence (Fig. 5).
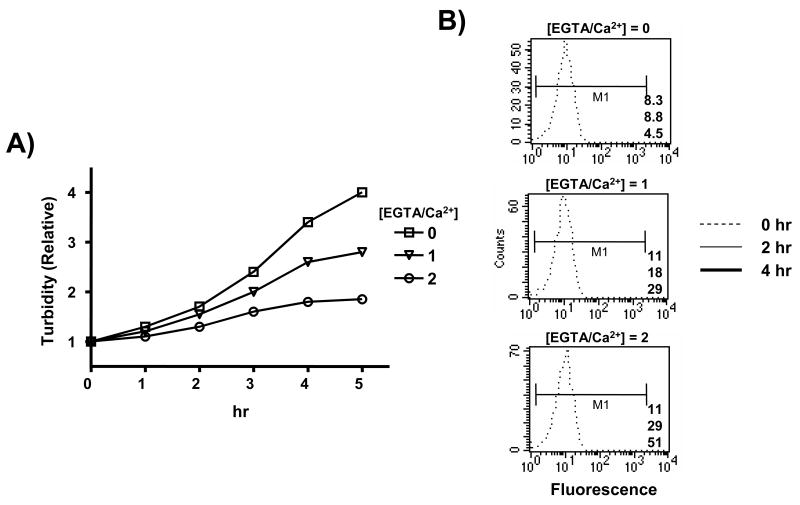
To verify this result and make certain that there was not a sub-population of bacteria that were ‘invisible’ in our microscopy analysis (e.g. cells possessing very low levels of fluorescence), we measured the fluorescence levels of individual bacteria using flow cytometry. The MFIs of bacteria from non-EGTA-treated cultures (i.e. [EGTA]/[Ca2+] = 0) changed very little during the first two hours of the analysis and in fact decreased as the culture entered late log/early stationary phase (Fig. 6). In contrast, the MFIs of bacteria cultivated in media containing [EGTA]/[Ca2+] = 2 increased approximately 3-fold (2 hr) and 5-fold (4 hr) following the addition of EGTA. The MFI of bacteria cultivated in media containing [EGTA]/[Ca2+] = 1 was intermediate between bacteria cultivated in the non- and fully-induced cultures; increasing approximately 2-fold (2 hr) and 3-fold (4 hr) following the addition of EGTA. We compared bacteria with similar light-scattering properties to ensure that the observed differences in fluorescence between bacteria from separate cultures were not due to simply differences in size. These data are consistent with the microscopy-based analysis and show that a seemingly dose-dependent relationship between Ca2+ levels and yopE promoter activity can be observed in individual bacteria.
Figure 6.
Flow cytometric analysis of Ca2+-dependent fluorescence in individual YPT/yopE::gfp cells. The YPT/yopE::gfp strain was cultured and induced as described in Figs. 1 and 2 and at time 0 the starting culture was divided into thirds with each part containing a EGTA/Ca2+ molar ratio of either 0, 1, or 2. At the indicated time, samples were removed from each culture and analyzed by spectroscopy (A) and flow cytometry (B). For flow cytometry, 104 cells with similar light scattering properties (not shown) were analyzed. In each histogram the 0, 2, and 4 hr samples are represented by either dotted, thin solid, or thick solid traces, respectively, and the means of the fluorescence within the M1 region is displayed in the lower right hand corner of each histogram (top, 0 hr; middle, 2 hr; bottom, 4 hr).
Upon inspection of the kinetics of activation of the yopE promoter between bacteria cultured in media containing varying Ca2+ levels (Figs. 5 and 6), a plausible explanation emerges for the growth restriction behavior of bulk cultures. Bacteria from the [EGTA]/[Ca2+] = 1 culture require more time to reach comparable levels of fluorescence as bacteria from the fully induced ([EGTA]/[Ca2+] = 2) culture. However, once induction is initiated, the percentage increases occurring between sampling points are remarkably similar. For example, in the [EGTA]/[Ca2+] = 1 culture, the fold-increase in MFI between bacteria sampled at 60 and 90 min is comparable to the fold-increases between the 30 and 60 min (as well as 60 and 90 min) observed in bacteria from the [EGTA]/[Ca2+] = 2 culture (Fig. 5). Similarly, in the [EGTA]/[Ca2+] = 0.5 culture the fold-increase in MFI between bacteria sampled at 60 and 90 min is comparable to the fold-increases between the 30 and 60 min observed in bacteria from the [EGTA]/[Ca2+] = 1 culture. These data suggest that under these conditions, Ca2+ levels in the medium affect the propensity of YPT to activate their T3SS, but once this activation commences, the kinetics of activation becomes largely independent of Ca2+ levels (but not completely, see Fig. 3). Keeping in mind that cellular division and T3SS activity are mutually exclusive activities, the reason the cultures containing various [EGTA]/[Ca2+] ratios differ in their terminal titer (see Fig. 1A) is therefore due to the relative timing of T3SS activation. In other words, these cultures differ in the growth restriction assay due to differences in the kinetics of initiation, not because of differences in the strength of the activation.
Single field analysis of Ca2+-dependent yopE promoter activity
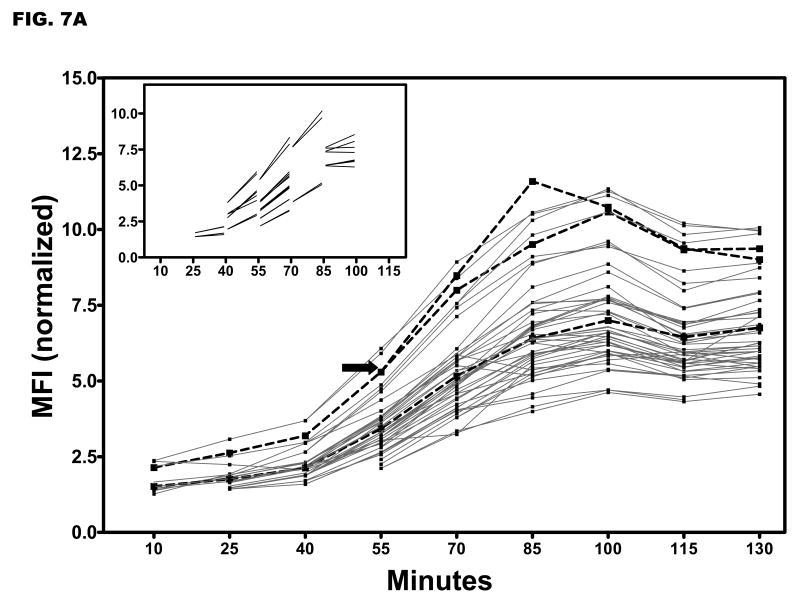
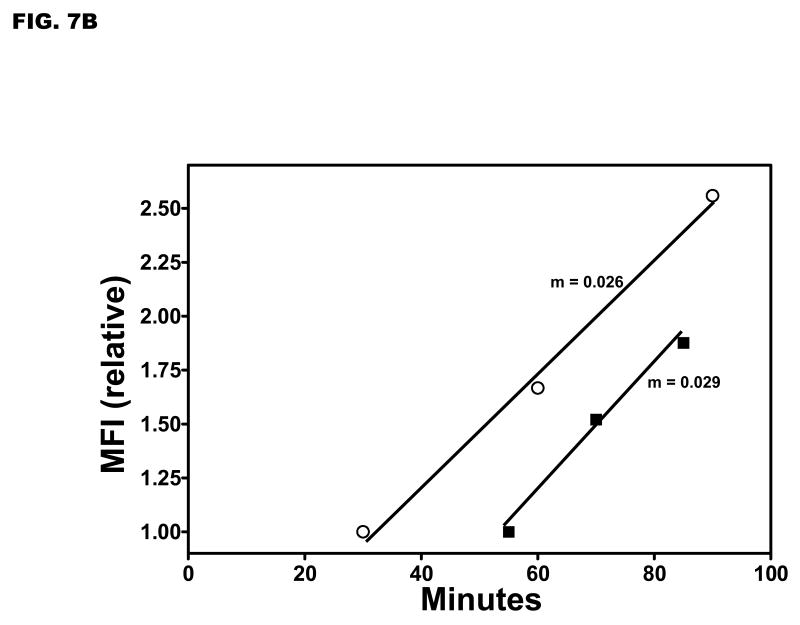
To follow inductive yopE promoter activity in the same bacteria, single microscopic fields of YPT/yopE::gfp cells were analyzed. The YPT/yopE::gfp strain was propagated as described in Fig. 1 and at ‘time 0’ was immobilized on pads prepared with inductive media solidified with agarose and maintained at 37 °C. We determined in pilot experiments that to achieve maximal inductive yopE promoter activity in these conditions required [EGTA]/[Ca2+] = 4. As shown in Fig. 7A, we typically observed increased MFIs in all immobilized cells within a microscopic field that in several respects resembled what was observed in our ‘snapshot’ analysis of cells induced in liquid culture shown in Fig. 5. Most notably, approximately 30 min was required before a rise in fluorescence levels was detected in all YPT/yopE::gfp bacteria within a field, and once past this ‘lag’ phase, the rate of increase in the MFIs was comparable as illustrated in Fig. 7B. However, one striking difference between the two different methods is the duration of inductive yopE promoter activity. In YPT/yopE::gfp cells induced in liquid media, yopE promoter activity and YopE protein levels increased for several hours (see Figs. 1B and 3). In contrast, yopE promoter activity in YPT/yopE::gfp cells induced on semi-solid media peaked at around 90 min (Fig. 7A).
Figure 7.
Single field analysis of Ca2+-dependent fluorescence in individual YPT/yopE::gfp cells. (A) The YPT/yopE::gfp strain was cultured as described in Fig. 1 and at time 0 a small aliquot of the culture was placed on an agarose pad (prepared with maximal inductive media) and maintained at 37 °C. Images of a single microscopic field were recorded every 15 minutes. To control for photobleaching, fluorescent intensities of the cells were normalized to that of a fluorescent bead that was present in the same field. For illustrated purposes, the traces of two different cells are highlighted in thicker, broken lines; one of these highlighted cells completes cytokinesis during the experiment (indicated by an arrow). (inset) From the same data set are shown cells completing cell division; only data just prior to or immediately following cytokinesis is shown. (B) Plotted is the relative changes in the mean fluorescence of YPT/yopE::gfp cells induced either in liquid (open circles, data from Fig. 4) or on semi-solid media (solid boxes, data from Fig. 7A).
Single field analysis of YPT/yopE::gfp cells provides three additional pieces of information about inductive yopE promoter activity. Firstly, the percentage increases in MFIs were very similar among individual cells, especially in the 40-55 and 55-70 min windows. This is evident by comparing the various slopes that connect single cells between these sampling points. Secondly, it shows that the rate increase of fluorescence of an individual cell is largely independent of its absolute fluorescence. This means that cells that are above the population medium in terms of their fluorescence at any given sampling point tend to remain above the population medium at the next sampling point indicating that individual cells are not fluctuating around the medium during the course of the assay. And thirdly, by following the same cells, we can determine whether there is any relationship between inductive yopE promoter activity and cellular division. A number of cells completed cytokinesis in the experiment shown in Fig. 7A, and it is abundantly clear that those cells, either prior to or following cytokinesis, do not appear to differ from non-dividing cells in terms of their MFIs between sampling points (compare the two highlighted traces of a dividing and nondividing bacteria). This finding suggests that inductive yopE promoter activity and cellular division (or at least the completion of cytokinesis) proceed independently of one another. In summary, these data indicate that under these conditions there is a high level of uniformity in terms of T3SS activity among a population of YPT/yopE::gfp cells.
Discussion
Our analysis revealed several features of Ca2+-dependent inductive T3SS activity in YPT that are not readily apparent from bulk-level types of analyses. Firstly, there is a general uniformity of T3SS expression levels among bacteria cultured in similar conditions; this is clearly indicated by the distribution of signal intensities and supported by the statistical analysis presented in Table I. In addition to a uniformity of expression levels revealed in our ‘snapshot’ analyses, we also observed a general uniformity in expression rates among cells in our single field analysis. Secondly, the kinetics of T3SS expression, at least initially, was similar between YPT cells induced in liquid or semi-solid media. For unknown reasons, T3SS expression levels began to subside after ∼85 min in YPT cells on semi-solid media in contrast to liquid induced cells in which increases in T3SS expression levels are observed for several hours. And lastly, completion of the bacterial cellular division cycle did not in any obvious way affect inductive T3SS expression levels suggesting that these two processes are controlled by distinctive regulatory factors.
Single cell analysis has allowed us to determine the basis of certain aspects of the yersiniae growth restriction response. The seemingly graded relationship between extracellular Ca2+ levels and terminal culture titers and YopE protein levels that are evident in bulk-level analyses can be entirely accounted for by our single cell analysis. Specifically, we showed that there is an inverse relationship between extracellular Ca2+ levels and the rate of initiation of inductive T3SS expression (Fig. 5). However, once initiated, inductive T3SS expression proceeds at comparable rates suggesting that the process is autocatalytic in nature. Therefore, the terminal titer of the [EGTA]/[Ca2+] = 1 culture is higher than the [EGTA]/[Ca2+] = 2 culture (Fig. 1A) because the former took a longer amount of time to completely withdraw from the division cycle, not because of a ‘partial’ (or otherwise sub-maximal) activation of the T3SS in individual bacteria. This latter point bears emphasis since conclusions about the behavior of individual cells are often drawn from culture-level observations. A possible molecular mechanism underlying this effect could be that Ca2+ levels control the rate of secretion of a negative regulator (such as LcrQ and/or YopD) and that activation occurs once the levels of this regulator falls below a certain threshold.
Whatever the mechanism, certain aspects of T3SS induction that we show here are highly reminiscent of both Novick and Weiner's findings about the lac promoter23, as well as what was described later for the araBAD promoter29. At high inducer concentration every bacterium within a population displays maximal activity of these two promoters. At lower, subsaturating levels of inducer, there is a corresponding increase in time before induced bacteria are detected, and furthermore, like what we show here for the yopE promoter, once induction is initiated the lac and araBAD promoters become fully activated through a seemingly positive autocatalytic pathway (hence the basis for the ‘all-or-none’ phenomenon). There is, however, a clear difference between the activation of the yopE promoter with that of the lac and araBAD promoters at subsaturating inducer levels: whereas we observed the entire population undergoing induction (Figs. 2-6), Novick and Weiner23 as well as Siegele and Hu30 observed a mixed population of either high- or non-expressing cells the ratio of which being a function of inducer concentration. This so-called bistability24, in which two stable gene expression states coexist among cells within a population, has been described for a number of bacterial stress-response systems including T3SS expression in Pseudomonas aeruginosa and Salmonella enterica31,32. There are a number of differences between Yersinia, Pseudomonas, and Salmonella in how their respective T3SSs are regulated; whether any of these differences can account for bistability (or not) remains to be determined.
Does Ca2+-dependent T3SS expression described here have anything to do with host cell contact-dependent T3SS expression? Previously, we and others have shown that T3SS activity increases when the yersiniae interact with cultured vertebrate cells and that this activity enhances bacterial survival and apparent proliferation rates22,25,33. Although there is strong circumstantial evidence21, it is simply not known whether the Ca2+- and host cell contact-sensitive induction signals are mechanistically related. Likewise, while growth restriction is easily demonstrated in the absence of host cells using long-term (several hours), bulk-level assays, it is unclear whether T3SS expression and bacterial cell division are mutually exclusive phenomena during host cell interaction. Our analysis reported here indicates, that at least over short periods of time (∼15 min), progression of the bacterial cell division does not compromise Ca2+-induced T3SS expression (Fig. 7A). Whether this will be the case for host cell contact-induced T3SS expression remains to be determined.
Materials & Methods
The construction and flow cytometric characterization of the Y. pseudotuberculosis YPIII/pIB1EG (yopE::gfp) strain, here referred to as YPT/yopE::gfp, has been described previously25,32. The Y. pestis KIM5-3001 and Y. enterocolitica WA strains were provided by G. Plano. The growth restriction assay is described in the Fig. 1 legend. Brubaker has recently shown that culture conditions greatly affect the growth restriction kinetics of Y. pestis: in addition to [Ca2+], important parameters include pH, and the concentrations of Na+, Mg2+, and dicarboxylic amino acids14. We therefore tested the robustness of our EGTA-inducing growth restriction assay by varying these parameters. We found that increasing either the MgCl2 or NaCl concentration 20-fold or 5-fold, respectively, had no detectable affect on the cell division withdrawal kinetics. Similarly, replacing EGTA with EDTA at comparable concentrations likewise did not affect growth restriction in our assay. The latter, together with the fact that MgCl2 is at 20mM in our standard buffered media whereas CaCl2 is at 2.5mM, supports the conventional view that a Ca2+-sensitive signal induces growth restriction.
For quantitative fluorescent microscopy, we used techniques that were originally developed to analyze yeast cells34,35. In our standard experiment, we used a Nikon TE2000-U microscope equipped with a Retiga EXi camera (Q Imaging) and MetaMorph software (version 6.3r2, Molecular Devices) to record images from several fields per condition. One major modification for analyzing bacterial cells was automating the data analysis using CellC software (http://www.cs.tut.fi/sgn/csb/cellc/), thus making it possible to collect larger data sets. For each data set we measured the fluorescence intensities of sharply-focused individual bacteria that fell within defined size dimensions (eliminating both bacteria that are slightly out of the focal plane as well as overlapping cells in clumps that could not be separated). The fluorescent intensity was reported as the mean fluorescence intensity of the quantified cell or the MFI. For real time analysis, pads were prepared by spreading 125μl agarose (1.8%) melted in TMH supplemented with CaCl2 (2.5mM), ascorbic acid (1mM, added to combat bleaching) and EGTA (10mM) on a microscope slide with a micropipette. After the slide was warmed to 37 °C, 1.5μl from a pre-induced liquid-grown culture (i.e. propagated at 26 °C for 2 hr and 37 °C for 1 hr), mixed with fluorescent beads (InSpeck Green (505/515) Microscope Imaging Intensity Calibration Kit; Molecular Probes, I7219) as an internal control for bleaching, was spotted on the pad. A coverslip was placed on top of the pad and secured by fingernail polish. The slide was then placed on the stage of the microscope which was contained in a temperature-controlled enclosure (Solent Scientific) equilibrated at 37 °C. Strict care was taken to maintain the samples at 37 °C temperature throughout the experiment. To prevent the agarose pad from rapidly dehydrating, it was necessary to place a small humidifier (Kaz 5520B PersonalMist Ultrasonic Humidifier) within the enclosure that maintained the humidity ∼45%. A field was chosen that allowed the cells to be viewed in a single focal plane together with a fluorescent control bead. These cells were then followed for the indicated times with a picture being taken every fifteen minutes. The collected data was then analyzed using CellProfiler software (www.cellprofiler.org) to identify and quantitate individual cells. Data for each cell was then linked from each time point and the mean fluorescent intensities (MFIs) were corrected for photobleaching using the fluorescent bead as an internal control.
Acknowledgments
We thank George Munson, Gregory Plano, Chaitanya Jain, Ken Fields, and two anonymous reviewers for thoughtful suggestions on the manuscript and Christopher J. DaFonseca for assistance in developing the foundation experiments. Supported in part by grants from the Miller School of Medicine, University of Miami and from Public Health Service grant AI53459 from the National Institute of Allergy and Infectious Diseases.
Footnotes
Publisher's Disclaimer: This is a PDF file of an unedited manuscript that has been accepted for publication. As a service to our customers we are providing this early version of the manuscript. The manuscript will undergo copyediting, typesetting, and review of the resulting proof before it is published in its final citable form. Please note that during the production process errors may be discovered which could affect the content, and all legal disclaimers that apply to the journal pertain.
References
- 1.Fukui GM, Ogg JE, Wessman GE, Surgalla MJ. Studies on the relation of cultural conditions and virulence of Pasteurella pestis. J Bacteriol. 1957;74:714–717. doi: 10.1128/jb.74.6.714-717.1957. [DOI] [PMC free article] [PubMed] [Google Scholar]
- 2.Higuchi K, Carlin CE. Studies on the nutrition and physiology of Pasteurella pestis. II. A defined medium for the growth of Pasteurella pestis. J Bacteriol. 1958;75:409–413. doi: 10.1128/jb.75.4.409-413.1958. [DOI] [PMC free article] [PubMed] [Google Scholar]
- 3.Higuchi K, Kupferberg LL, Smith JL. Studies on the nutrition and physiology of Pasteurella pestis. III. Effects of calcium ions on the growth of virulent and avirulent strains of Pasteurella pestis. J Bacteriol. 1959;77:317–321. doi: 10.1128/jb.77.3.317-321.1959. [DOI] [PMC free article] [PubMed] [Google Scholar]
- 4.Higuchi K, Smith JL. Studies on the nutrition and physiology of Pasteurella pestis. VI. A differential plating medium for the estimation of the mutation rate to avirulence. J Bacteriol. 1961;81:605–608. doi: 10.1128/jb.81.4.605-608.1961. [DOI] [PMC free article] [PubMed] [Google Scholar]
- 5.Gemski P, Lazere JR, Casey T, Wohlhieter JA. Presence of a virulence-associated plasmid in Yersinia pseudotuberculosis. Infect Immun. 1980;28:1044–1047. doi: 10.1128/iai.28.3.1044-1047.1980. [DOI] [PMC free article] [PubMed] [Google Scholar]
- 6.Ben-Gurion R, Shafferman A. Essential virulence determinants of different Yersinia species are carried on a common plasmid. Plasmid. 1981;5:183–187. doi: 10.1016/0147-619x(81)90019-6. [DOI] [PubMed] [Google Scholar]
- 7.Ferber DM, Brubaker RR. Plasmids in Yersinia pestis. Infect Immun. 1981;31:839–841. doi: 10.1128/iai.31.2.839-841.1981. [DOI] [PMC free article] [PubMed] [Google Scholar]
- 8.Portnoy DA, Moseley SL, Falkow S. Characterization of plasmids and plasmid-associated determinants of Yersinia enterocolitica pathogenesis. Infect Immun. 1981;31:775–882. doi: 10.1128/iai.31.2.775-782.1981. [DOI] [PMC free article] [PubMed] [Google Scholar]
- 9.Portnoy DA, Wolf-Watz H, Bolin I, Beeder AB, Falkow S. Characterization of common virulence plasmids in Yersinia species and their role in the expression of outer membrane proteins. Infect Immun. 1984;43:108–114. doi: 10.1128/iai.43.1.108-114.1984. [DOI] [PMC free article] [PubMed] [Google Scholar]
- 10.Rosqvist R, Magnusson KE, Wolf-Watz H. Target cell contact triggers expression and polarized transfer of Yersinia YopE cytotoxin into mammalian cells. EMBO J. 1994;13:964–972. doi: 10.1002/j.1460-2075.1994.tb06341.x. [DOI] [PMC free article] [PubMed] [Google Scholar]
- 11.Viboud GI, Bliska JB. Yersinia outer proteins: role in modulation of host cell signaling responses and pathogenesis. Annu Rev Microbiol. 2005;59:69–89. doi: 10.1146/annurev.micro.59.030804.121320. [DOI] [PubMed] [Google Scholar]
- 12.Pallen MJ, Beatson SA, Bailey CM. Bioinformatics, genomics and evolution of non-flagellar type-III secretion systems: a Darwinian perspective. FEMS Microbiol Rev. 2005;29:201–229. doi: 10.1016/j.femsre.2005.01.001. [DOI] [PubMed] [Google Scholar]
- 13.Galan JE, Wolf-Watz H. Protein delivery into eukaryotic cells by type III secretion machines. Nature. 2006;444:567–573. doi: 10.1038/nature05272. [DOI] [PubMed] [Google Scholar]
- 14.Brubaker RR. Influence of Na(+), dicarboxylic amino acids, and pH in modulating the low-calcium response of Yersinia pestis. Infect Immun. 2005;73:4743–4752. doi: 10.1128/IAI.73.8.4743-4752.2005. [DOI] [PMC free article] [PubMed] [Google Scholar]
- 15.Lambert de Rouvroit C, Sluiters C, Cornelis GR. Role of the transcriptional activator, VirF, and temperature in the expression of the pYV plasmid genes of Yersinia enterocolitica. Mol Microbiol. 1992;6:395–409. [PubMed] [Google Scholar]
- 16.Hoe NP, Goguen JD. Temperature sensing in Yersinia pestis: translation of the LcrF activator protein is thermally regulated. J Bacteriol. 1993;175:7901–7909. doi: 10.1128/jb.175.24.7901-7909.1993. [DOI] [PMC free article] [PubMed] [Google Scholar]
- 17.Williams AW, Straley SC. YopD of Yersinia pestis plays a role in negative regulation of the low-calcium response in addition to its role in translocation of Yops. J Bacteriol. 1998;180:350–358. doi: 10.1128/jb.180.2.350-358.1998. [DOI] [PMC free article] [PubMed] [Google Scholar]
- 18.Francis MS, Lloyd SA, Wolf-Watz H. The type III secretion chaperone LcrH co-operates with YopD to establish a negative, regulatory loop for control of Yop synthesis in Yersinia pseudotuberculosis. Mol Microbiol. 2001;42:1075–1093. doi: 10.1046/j.1365-2958.2001.02702.x. [DOI] [PubMed] [Google Scholar]
- 19.Anderson DM, Ramamurthi KS, Tam C, Schneewind O. YopD and LcrH regulate expression of Yersinia enterocolitica YopQ by a posttranscriptional mechanism and bind to yopQ RNA. J Bacteriol. 2002;184:1287–1295. doi: 10.1128/JB.184.5.1287-1295.2002. [DOI] [PMC free article] [PubMed] [Google Scholar]
- 20.Hoiczyk E, Blobel G. Polymerization of a single protein of the pathogen Yersinia enterocolitica into needles punctures eukaryotic cells. Proc Natl Acad Sci USA. 2001;98:4669–4674. doi: 10.1073/pnas.071065798. [DOI] [PMC free article] [PubMed] [Google Scholar]
- 21.Torruellas J, Jackson MW, Pennock JW, Plano GV. The Yersinia pestis type III secretion needle plays a role in the regulation of Yop secretion. Mol Microbiol. 2005;57:1719–1733. doi: 10.1111/j.1365-2958.2005.04790.x. [DOI] [PubMed] [Google Scholar]
- 22.Pettersson J, Nordfelth R, Dubinina E, Bergman T, Gustafsson M, Magnusson KE, Wolf-Watz H. Modulation of virulence factor expression by pathogen target cell contact. Science. 1996;273:1231–1233. doi: 10.1126/science.273.5279.1231. [DOI] [PubMed] [Google Scholar]
- 23.Novick A, Weiner M. Enzyme induction as an all-or-none phenomenon. Proc Natl Acad Sci USA. 1957;43:553–566. doi: 10.1073/pnas.43.7.553. [DOI] [PMC free article] [PubMed] [Google Scholar]
- 24.Smits WK, Kuipers OP, Veening JW. Phenotypic variation in bacteria: the role of feedback regulation. Nature Rev Microbiol. 2006;4:259–271. doi: 10.1038/nrmicro1381. [DOI] [PubMed] [Google Scholar]
- 25.Bartra S, Cherepanov P, Forsberg A, Schesser K. The Yersinia YopE and YopH type III effector proteins enhance bacterial proliferation following contact with eukaryotic cells. BMC Microbiol. 2001;1:e22–e32. doi: 10.1186/1471-2180-1-22. [DOI] [PMC free article] [PubMed] [Google Scholar]
- 26.Fowler JM, Brubaker RR. Physiological basis of the low calcium response in Yersinia pestis. Infect Immun. 1994;62:5234–5241. doi: 10.1128/iai.62.12.5234-5241.1994. [DOI] [PMC free article] [PubMed] [Google Scholar]
- 27.Zahorchak RJ, Brubaker RR. Effect of exogenous nucleotides on Ca2+ dependence and V antigen synthesis in Yersinia pestis. Infect Immun. 1982;38:953–959. doi: 10.1128/iai.38.3.953-959.1982. [DOI] [PMC free article] [PubMed] [Google Scholar]
- 28.Forde CE, Rocco JM, Fitch JP, McCutchen-Maloney SL. Real-time characterization of virulence factor expression in Yersinia pestis using a GFP reporter system. Biochem Biophys Res Commun. 2004;324:795–800. doi: 10.1016/j.bbrc.2004.08.236. [DOI] [PubMed] [Google Scholar]
- 29.Zahorchak RJ, Charnetzky WT, Little RV, Brubaker RR. Consequence of Ca2+ deficiency on macromolecular synthesis and adenylate energy charge in Yersinia pestis. J Bacteriol. 1979;139:792–799. doi: 10.1128/jb.139.3.792-799.1979. [DOI] [PMC free article] [PubMed] [Google Scholar]
- 30.Siegele DA, Hu JC. Gene expression from plasmids containing the araBAD promoter at subsaturating inducer concentrations represents mixed population. Proc Natl Acad Sci USA. 1997;94:8168–8172. doi: 10.1073/pnas.94.15.8168. [DOI] [PMC free article] [PubMed] [Google Scholar]
- 31.Rietsch A, Mekalanos JJ. Metabolic regulation of type III secretion gene expression in Pseudomonas aeruginosa. Mol Microbiol. 2006;59:807–820. doi: 10.1111/j.1365-2958.2005.04990.x. [DOI] [PMC free article] [PubMed] [Google Scholar]
- 32.Hautefort I, Proenca MJ, Hinton JCD. Single-copy green fluorescent protein gene fusions allow accurate measurement of Salmonella gene expression in vitro and during infection of mammalian cells. App Environ Microbiol. 2003;69:7480–7491. doi: 10.1128/AEM.69.12.7480-7491.2003. [DOI] [PMC free article] [PubMed] [Google Scholar]
- 33.Rosenzweig JA, Weltman G, Plano GV, Schesser K. Modulation of yersinia type three secretion system by the S1 domain of polynucleotide phosphorylase. J Biol Chem. 2005;280:156–163. doi: 10.1074/jbc.M405662200. [DOI] [PubMed] [Google Scholar]
- 34.Wiley DJ, Marcus S, D'urso G, Verde F. Control of cell polarity in fission yeast by association of Orb6p kinase with the highly conserved protein methyltransferase Skb1p. J Biol Chem. 2003;278:25256–25263. doi: 10.1074/jbc.M209703200. [DOI] [PubMed] [Google Scholar]
- 35.Wiley DJ, Nordfeldt R, Rosenzweig J, DaFonseca CJ, Gustin R, Wolf-Watz H, Schesser K. The Ser/Thr kinase activity of the Yersinia protein kinase A (YpkA) is necessary for full virulence in the mouse, mollifying phagocytes, and disrupting the eukaryotic cytoskeleton. Microb Path. 2006;40:234–243. doi: 10.1016/j.micpath.2006.02.001. [DOI] [PubMed] [Google Scholar]


