Abstract
A microarray-based method has been developed for scoring thousands of DNAs for a co-dominant molecular marker on a glass slide. The approach was developed to detect insertional polymorphism of transposons and works well with single nucleotide polymorphism (SNP) markers. Biotin- terminated allele-specific PCR products are spotted unpurified onto streptavidin-coated glass slides and visualised by hybridisation of fluorescent detector oligonucleotides to tags attached to the allele- specific PCR primers. Two tagged primer oligonucleotides are used per locus and each tag is detected by hybridisation to a concatameric DNA probe labelled with multiple fluorochromes.
INTRODUCTION
There is great interest in developing robust, cheap, high throughput methodologies for the analysis of molecular markers. Until recently, the most commonly used marker methods have involved the electrophoretic analysis of PCR products, typically amplified fragment length polymorphism (AFLP) (1) or microsatellites (2). These techniques are powerful for scoring sample numbers up to hundreds, but they are less well suited to high throughput applications. Meanwhile, large scale sequencing of genomes and transcriptomes has revealed huge numbers of single nucleotide polymorphisms (SNPs) which can be used to derive a virtually inexhaustible source of molecular markers. A wide variety of different methods for scoring SNP markers have become available but no consensus approach has yet emerged (3,4).
The advent of hybridisation-based microarray technology has driven the development of accessible and relatively inexpensive tools for arraying nucleic acids onto solid supports, hybridising to probes of choice and scoring the results automatically (5). Microarray approaches were originally developed for the analysis of RNA populations and they are well suited in principle to the analysis of high throughput molecular markers, because tens of thousands of assays can be carried out on a single slide or chip. Several microarray-based SNP marker methods have been developed (6–12). In these approaches, the ‘target’ sequence in solution is interrogated by the arrayed ‘probe’, in an analogous manner to conventional expression microarrays. This approach is particularly well suited to the analysis of thousands of markers in hundreds of individuals.
This report describes the development of a marker method which reverses the target–probe arrangement described above. Amplified PCR products from genomic DNA are arrayed then interrogated by hybridisation with labelled probes to determine the allelic state of the locus. In this way tens of thousands of genomic samples can be scored for a few markers in a single experiment, making it particularly useful for screening large populations for important markers (e.g. human populations for disease susceptibility genes or large plant populations for resistance genes). The method has been developed to score retrotransposon-based insertion polymorphism markers (RBIP) (13) and can be used to score SNP markers.
MATERIALS AND METHODS
DNA samples and sequences
DNAs were isolated from plant leaves using manufacturers’ kits (Nucleon Phytopure or Qiagen DNA-Easy). The sequences of loci 1794-1, SNP 206 and SNP 957 are contained in EMBL database entries AJ577718–AJ577720, respectively.
Oligonucleotides
The sequences of all oligonucleotides used in this study are shown in Table 1. Fluorochrome-containing oligonucleotides, biotinylated oligonucleotides and tag oligonucleotides containing C-18 hexaethyleneglycol spacers were obtained either from the University of Dundee Wellcome Trust Biocentre DNA Synthesis Facility, MWG or VH-Bio. Oligonucleotides were purified by 10% polyacrylamide gel electrophoresis (Wellcome Biocentre), High Purity Salt Free® (MWG) or high pressure liquid chromatography (VH-Bio). Tag sequences were initially 30mers, selected from a randomly generated sequence then edited to remove palindromes and hairpins of four or more bases. All tags were cross-compared against each other to avoid cross-homology. Later experiments showed that all four tags (A, C, E and G) could be reduced to 20 bases by removing 10 3′-terminal nucleotides without detectable effect on the fluorescence signals. Mutagenically separated PCR (MS-PCR) primers contained mismatches at –2 to –4 bases relative to their templates, as described by Rust et al. (14) (see Table 1).
Table 1. Oligonucleotides used in this study.
| Name | Type | Sequence |
|---|---|---|
| Biotin-1794L | Common biotinylated primer | [biotin]CTTCATGTGAATGAACGCAC |
| A-C18-1794-1R | Unoccupied site Tag primer | TCTTTGAGTTTGACCATGCAACGTGAGCGA[18]AAGAACATTGAAGCTTTATCCTTG |
| C-SP-PBS(–) | Occupied site Tag primer | GCCATACAATAGTCACGTTGGAGTTGGACA[18]CGGGAGTTCTTGATACCATGTT |
| Cy5-A-B | Tag detector oligonucleotide | [Cy5]TCTTTGAGTTTGACCATGCAACGTGAGCGACAATCAGGACGGCTACGTGCAATACTTAGT |
| Cy5-A′-B′ | Tag detector oligonucleotide | [Cy5]TCGCTCACGTTGCATGGTCAAACTCAAAGAACTAAGTATTGCACGTAGCCGTCCTGATTG |
| Cy3-C-D | Tag detector oligonucleotide | [Cy3]GCCATACAATAGTCACGTTGGAGTTGGACACCTACTGAATACACTTATACCGCTTACGAG |
| Cy3-C′-D′ | Tag detector oligonucleotide | [Cy3]TGTCCAACTCCAACGTGACTATTGTATGGCCTCGTAAGCGGTATAAGTGTATTCAGTAGG |
| Biotin-206L | Common SNP206 biotinylated primer | [biotin]TGTCATACCACCCAACTATTCCCCCTACG |
| Biotin-957R | Common SNP957 biotinylated primer | [biotin]AAATTCGGCAGCTGGAGCTTGAAATGGAG |
| A-SP-206C | SNP206 C allele tag primer | TCTTTGAGTTTGACCATGCAACGTGAGCGA[18]GCCGTACTTCCATTAGCTCTTCGCCCC |
| C-SP-206T | SNP206 T allele tag primer | GCCATACAATAGTCACGTTGGAGTTGGACA[18]CGCCGTACTTCCATTAGCTCTTCGAACT |
| E-SP-957A | SNP957 A allele tag primer | ACCGCATCCGAACATTTGTCAGTTGAGCAT[18]TGATAACCCCTGATTGAATATGGGCACA |
| G-SP-957G | SNP957 G allele tag primer | GCCGATAATCACCTTGTCACTGCTTGAACA[18]TGATAACCCCTGATTGAATATGGGCCAG |
| Cy5-E-F | Tag detector oligonucleotide | [Cy5]ACCGCATCCGAACATTTGTCAGTTGAGCATTCTGCCTAAGCCCACTATTCCATCAAGTCT |
| Cy5-E′-F′ | Tag detector oligonucleotide | [Cy5]ATGCTCAACTGACAAATGTTCGGATGCGGTAGACTTGATGGAATAGTGGGCTTAGGCAGA |
| Cy3-G-H | Tag detector oligonucleotide | [Cy3]GCCGATAATCACCTTGTCACTGCTTGAACAACTCCGAAGTTGCCAATCTTGCGTCAATAG |
| Cy3-G′-H′ | Tag detector oligonucleotide | [Cy3]TGTTCAAGCAGTGACAAGGTGATTATCGGCCTATTGACGCAAGATTGGCAACTTCGGAGT |
[18], C-18 spacer.
PCRs
All PCRs used Qiagen HotStar Taq DNA polymerase, Qiagen reaction buffer and 0.25 µM each oligonucleotide. dNTP concentrations were 200 µM for RBIP PCRs and 50 µM for SNP PCRs. Pilot PCRs were on a 25 µl scale on a Techne Genius instrument and contained 50–100 ng pea genomic DNA (1C = 3 × 10⁹). High throughput PCRs were set up using a Hydra HTS instrument (Robbins) and were on the 10 or 5 µl scale in a MJ Tetrad instrument, fitted with 384 well blocks, using ∼6 ng template DNA. Cycling conditions for retrotransposon-based PCRs were 95°C for 15 min (heat activation of enzyme), followed by 40 cycles of 94, 55 and 72°C, all for 1 min, with a final elongation step of 72°C for 7 min. The SNP-based MS-PCRs employed a touchdown PCR. The conditions were 95°C for 15 min, then denaturation at 94°C for 1 min and annealing at 72°C for 1 min for the first cycle, then using temperatures progressively 0.7°C per cycle lower over 17 cycles to 60°C, then 60°C for the remaining 25 cycles; extension was for 1 min at 72°C for all cycles. The PCR was concluded with a final elongation step at 72°C for 7 min. 384 format PCRs used ABgene plates (TF-0384), initially with heat sealing (Easypeel, AB-0745) but these generated rough edges to the wells, leading to arraying problems. Therefore, an adhesive PCR seal (Abgene AB-0558) was used thereafter.
Sample arraying
PCR products were arrayed directly from 384-well PCR plates (ABgene TF-0384) onto streptavidin-coated glass microarray slides (Xenopore) at 19–21°C, 40–50% relative humidity, with no extra processing steps, using a Biorobotics Microgrid-II-TAS instrument fitted with 0.2 mm solid pins (the use of a smaller pin diameter resulted in much smaller spots but inferior signal strength). Following arraying, the slides were incubated in a chamber at 100% relative humidity and 20°C for 10 min to complete binding of the biotinylated PCR products to the streptavidin, then transferred to a stainless steel slide rack and placed in stirred prehybridisation solution (5× SSC + 25× Denhardt’s solution with 0.5% w/v each of Ficoll-400, polvinylpyrrollidone and bovine serum albumin and Sigma fraction V) at 30°C for 30 min. Slides were then washed with stirring in 0.5× SSC for 30 s, then dried by centrifugation at 2000 g for 2.5 min. For hybridisation, the fluorescently labelled tag oligonucleotides (200 ng each) were combined with water to a total volume of 14 µl and incubated at 70°C for 2 min. All steps involving fluorochromes avoided exposure to strong direct lighting. The tag mix was chilled on ice for 15 s, then 5 µl of a solution containing 20× SSC and 100× Denhardt’s solution was added, followed by 2 µl of 1% SDS. The hybridisation solution was then carefully pipetted onto the slide, avoiding the generation of bubbles, and a coverslip (Hybri-Slip; Sigma, St Louis, MO) was placed onto the mix. Slides were hybridised in a Grant microarray hybridisation chamber (In Slide Out hybridisation oven; Boekel Scientific, Feasterville, PA) at 100% relative humidity at 37°C for 30 min. Slides were then washed in 0.5× SSC, 0.01% SDS at room temperature, followed by two washes of 0.2× SSC, each of 5 min at room temperature. The slides were then spun dry as before and either scanned immediately or stored in the dark at 4°C.
Fluorescence scanning
Scanning was carried out using an ArrayWoRxe Biochip Reader and images analysed with ArrayWoRx Analyser software (Applied Precision, Issaquah, WA). The scanner was fitted with filters for Cy3, Cy5, Alexa 350 and Alexa 488 fluorochromes, and scan parameters were adjusted to avoid saturated signals. All spot signal intensities were collected manually, using the ArrayWoRx Analyser software, corrected for local backgrounds and exported to an Excel spreadsheet for averaging, measuring SDs and calculating fluorescence ratios.
RESULTS
Development of the method
Our objective was to develop a cheap robust method for screening thousands of genomic DNAs in parallel for one or more molecular markers. The approach chosen was based upon a macroarray marker method for scoring RBIP markers, involving direct spotting of unpurified PCR products onto a nylon filter, followed by hybridisation to radioactively labelled PCR product (9). Initial attempts to adapt this approach to a fluorescent microarray format using conventional microarray slides were unsuccessful, because PCR buffer inhibits the binding of DNA to the slide by approximately 10-fold (data not shown). To avoid this problem, streptavidin-coated slides were adopted, with one biotinylated PCR primer shared by both alleles and two allele-specific primers, containing a Cy3 or Cy5 fluorophore, respectively. Direct spotting of the PCR products, followed by washing, produced visually discernible, allele-specific scores, but the fluorescence signal intensities were too low for reliable automated scoring (data not shown) and the PCRs were relatively expensive, owing to the use of fluorescently labelled primers.
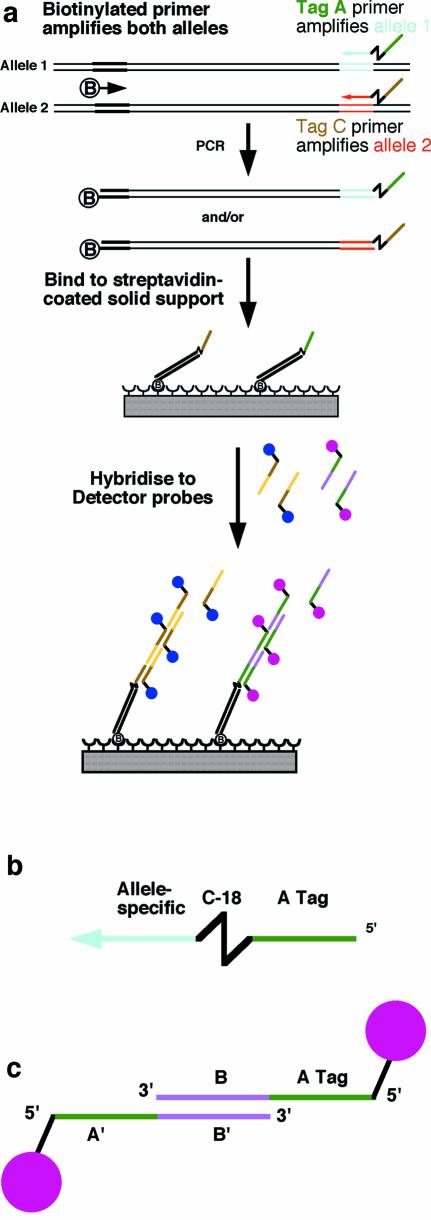
The approach adopted for this study combines the streptavidin and hybridisation approaches, with an important modification to the hybridisation detection method to increase its sensitivity (Fig. 1). PCR is carried out with a biotinylated primer, shared by the two alleles, and allele-specific primers carrying different oligonucleotide tags (tag A and tag C in Fig. 1a), which allows hybridisation-based detection of the immobilised PCR products. The tags remain single-stranded in the PCR amplification by placing a C-18 linker between the allele-specific sequence and the tag, to inhibit elongation of Taq DNA polymerase into the tag (Fig. 1a and b). This approach has been used previously for a similar reason in the Scorpions™ marker approach (15). The PCR products are spotted without purification onto a streptavidin-coated microarray slide, which is then hybridised with a mixture of two detector probes carrying different fluorescent labels (Fig. 1a and c). Each detector probe is comprised of two fluorescently labelled oligonucleotides; the first of these can hybridise with its corresponding tag and the second can anneal with the first, via a sequence (B-B′ in Fig. 1c), to form a concatamer containing multiple fluorescent molecules (Fig. 1a). Multiply labelled complex oligonucleotide probes have been used previously to amplify fluorescent hybridisation signals (16; http://www.genisphere.com/about_3dna.html).
Figure 1.
The tagged microarray approach. (a) Two alleles are distinguished by PCR using three primers. The biotinylated PCR products are arrayed onto a solid support and hybridised with detector probes, which recognise tags specific to the two products. (b) Structure of a tag primer. The allele-specific region is separated from the tag by a C18 linker. (c) Tag detector probe. Two partially complementary oligonucleotides carry a tag sequence (the A tag in this case), its reverse complement (A′), a region of cross-homology (B and B′ for this pair) and a fluorochrome each.
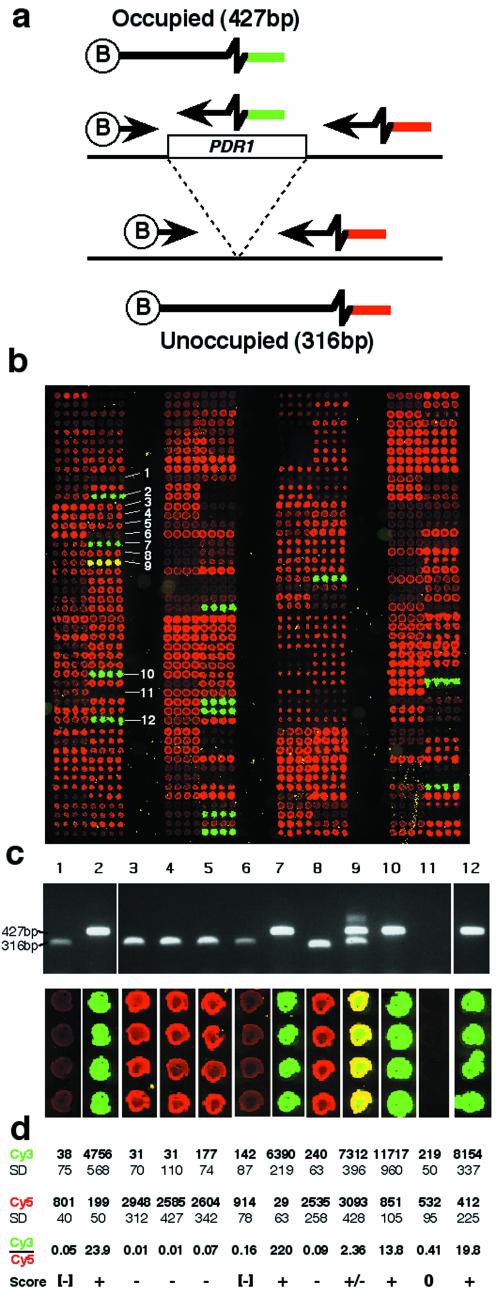
We first tested the tag detector system on a pea locus, 1794-1, which is polymorphic for the insertion of a PDR1 copia group LTR retrotransposon (R. Jing, M. Knox, A. Vershinin, T.H.N. Ellis and A.J. Flavell, in preparation). The common biotinylated primer derives from one side of the insertion site and the tag primers derive from inside the retrotransposon and the other side of the insertion site, respectively (Fig. 2a). PCRs on DNA templates containing the insertion (occupied sites) produce a 427 bp fragment and templates lacking the insertion yield a product of 316 bp (data not shown). We have never observed amplification of a complete occupied site containing the retrotransposon insertion when using flanking primers, presumably because the PCR product would be 4 kb or more in length and we avoid long PCR elongation steps (13).
Figure 2.
The tagged microarray approach applied to a pea genomic retrotransposon insertion. (a) The two alleles differ by the presence or absence of a retrotransposon insertion (PDR1 here). Different PCR products are produced from the two alleles and these can be recognised either by gel electrophoresis or the tagged microarray approach (Fig. 1). (b) Microarray image from 384 pea samples assayed for the 1794-1 allele. Each sample was spotted four times in a row. Cy3 fluorescing spots (green) represent the occupied site allele and Cy5 labelled spots (red) show the unoccupied site allele. Arrowed samples were analysed by gel electrophoresis (Fig. 1c). (c) Agarose gel of samples arrowed in (b), together with corresponding fluorescent images taken from the array image. (d) Quantitation of array spot intensities shown in (c). SD, standard deviation.
The 1794-1 marker was scored in 384 pea DNA samples chosen to represent a broad spectrum of the genetic diversity of the genus Pisum. An array of Cy3 and Cy5 fluorescing spots was generated after spotting, hybridisation and washing (Fig. 2b; note that the PCR products were spotted in quadruplicate). The pattern of fluorescence was highly reproducible between different PCRs using the same samples (data not shown). A selection of the PCR products giving a variety of different fluorescent signals, labelled in Figure 2b, were assayed by agarose gel electrophoresis, to ascertain whether the fluorescence-based signals correspond to DNA products of the expected size (Fig. 2c). In all cases, products of the expected sizes were seen. One particularly interesting sample, which yielded a ‘yellow’ fluorescence (sample 6) was shown to contain both occupied and unoccupied sites. This may be a mixed sample, it may be segregating for the retrotransposon insertion or it may carry a duplication of the unoccupied site. Lastly, sample 4, which gave no detectable fluorescence, contains no discernible PCR product by gel electrophoresis. This DNA sample produces PCR products with other PCR primer combinations (data not shown) and we believe such failures may be due to mutation at one or more of the primer sites (see Discussion).
The fluorescence signals for the 12 samples were quantified (Fig. 2d). The four unambiguous ‘occupied’ samples yielding strongly fluorescing Cy3 spots (green in Fig. 2c) give fluorescence scores between 4000 and 12 000 fluorescence units and Cy3/Cy5 ratios of between 13.8 and 220. Strong ‘unoccupied’ spots (red) yield Cy5 signals of 2500–3000 units and Cy3/Cy5 ratios of 0.01–0.09. Lines yielding low but discernible Cy5 fluorescence intensity and near background Cy3 signals (samples 1 and 6) give Cy3/Cy5 ratios below 0.2 and can be cautiously assigned as unoccupied (–). Sample 4, which shows no visible spot fluorescence or gel product is categorised as a no score (0). Finally, sample 6, which contains both occupied and unoccupied PCR products (Fig. 2c), produced strong Cy3 and Cy5 signals with a Cy3/Cy5 ratio of 2.36 and was scored as +/– (both alleles present).
For the next experiment two modifications of the method were tested. The first was to exchange fluorochromes on the tag detectors. In the original experiment, tag A-containing PCR products had been detected by a Cy5-AB detector and tag C-containing PCR products by a Cy3-CD detector. When Cy3-AB and Cy5-CD detectors were used instead, the fluorescence signals were reversed, as expected (Fig. 3a). The advantage of this versatility is discussed later.
Figure 3.
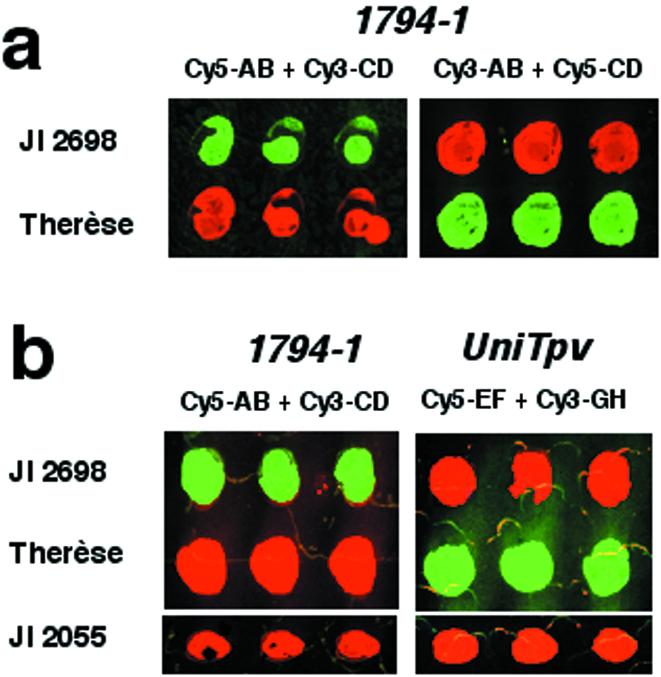
Modifications to the tagged microarray approach. (a) Using tag detectors labelled with different fluorochromes produces different fluorescent outputs from the same samples. Sample JI 2698 contains an occupied 1794-1 allele and sample Therèse is unoccupied. Samples were spotted in triplicate. (b) Using four tag detectors to analyse the allelic state for two loci in the same reaction. Sample JI 2698 is occupied for 1794-1 and unoccupied for UniTpv, sample Therèse is unoccupied for 1794-1 and occupied for UniTpv and sample JI 2055 is unoccupied for both loci. Tag detectors used for both loci produce Cy3 signal (green) from an occupied allele and Cy5 signal (red) from an unoccupied allele.
The second development of the method was to use four tags and tag detectors to detect two co-dominant markers in the same PCR. For this purpose a second retrotransposon insertion, UniTpv2, was selected, in addition to 1794-1 (17) The UniTpv2 allele is associated with the insertion of a gypsy group retrotransposon which shares very little homology with PDR1. Therefore, primers specific for either of these retrotransposons will not amplify the other. The 1794-1 insertion was detected as before, using A and C tags, together with the corresponding Cy5-AB and Cy3-CD detectors. The UniTpv2 insertion was detected by two new tags, E and G, together with EF and GH detectors. Three pea DNA samples which segregate for the two insertions were selected (Fig. 3b). The two loci were scored for each sample in single PCRs containing the four tag primers and their corresponding common biotinylated locus-specific primers. The PCR products for each sample were then spotted onto two slides, one of which was hybridised with Cy5-AB and Cy-3CD detectors and the other with Cy5-EF and Cy3-GH detectors (Fig. 3b). The two loci were independently amplified and gave the expected scores by the microarray method.
Application of the method to high throughput marker analysis
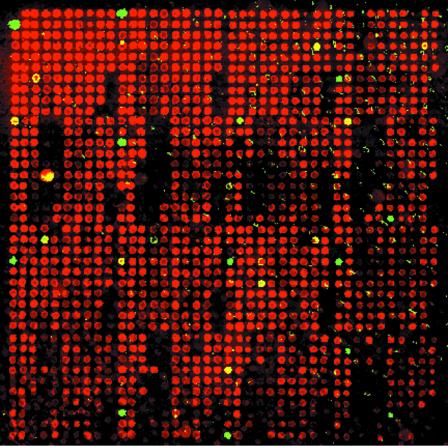
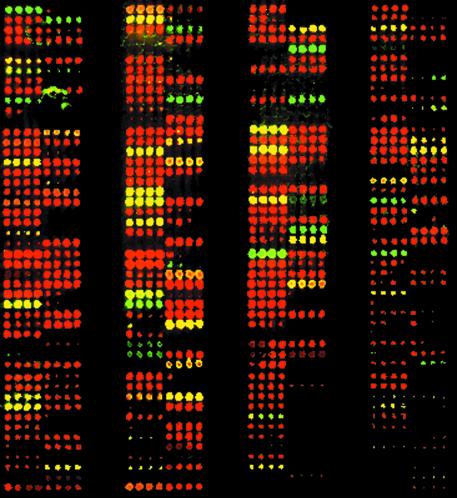
We next applied the 1794-1 RBIP marker to a set of 1536 DNA samples, corresponding to approximately half of the John Innes Pisum Germplasm Collection (Fig. 4). Clear allele scores were obtained for ∼85% of the samples. Signal strength varied to some extent across the array, with slightly lower intensities near the bottom of this particular slide. The complete array was spotted in six replicates and the fluorescence pattern was highly reproducible between replicates (data not shown).
Figure 4.
Microarray image for 1536 pea DNA samples assayed for the 1794-1 allele under the same conditions as Figure 2b. Red (Cy5) spots indicate samples containing an unoccupied (–) allele, green indicates occupied (+) and yellow indicates both alleles (+/–). Each PCR was spotted once per array.
Application of the method to SNP marker analysis
To apply this marker approach to SNP markers, reliable allele-specific PCR conditions were needed, which produce only PCR products corresponding to their templates. Our first attempt used three primers to amplify the two SNP loci, in an analogous way to that described in Figure 1, with the allele-specific primers differing only in their 3′-terminal base, corresponding to the SNP polymorphism. We could not obtain good allele specificity for any of the three SNPs tested using this approach, even using the Accuprime™ enzyme system (18). We next tested the MS-PCR approach (10). MS-PCR, a modification of the amplification refractory mutation system (ARMS) approach (19), uses the same three primer approach as above but introduces additional destabilising mutations in the allele-specific primers, relative to their template and each other, which inhibits cross-reactions between the two allele amplicons. This is particularly effective when both loci are amplified in the same reaction (http://www.ich.ucl.ac.uk/cmgs/arms98.htm).
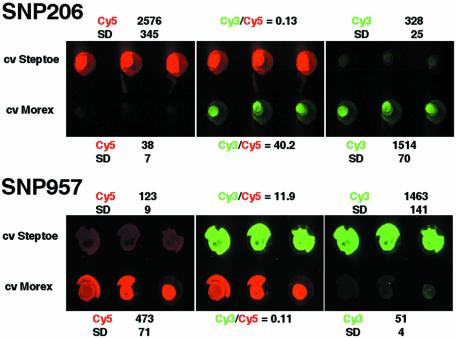
Three SNP markers, verified as polymorphic between barley varieties Steptoe and Morex by Pyrosequencing™ (Pyrosequencing AB, Uppsala, Sweden; Russell,J., Booth,A., Ramsay,L., Machray,G., Hedley,P. and Powell,W., in preparation), were selected to test the method. Using MS-PCR, allele-specific PCR products were seen for two of the three loci by agarose gel electrophoresis (data not shown). One marker, SNP 286, was unsuccessful, producing a single PCR product for one allele but both products from the other allele. The two successful markers, SNP 206 and SNP 957, were then tested by the microarray-based method, using a biotinylated common primer and two differently tagged, allele-specific MS-PCR primers (Fig. 5). The expected scores and good discrimination were obtained between the two alleles for these SNP markers. Figure 6 shows the results obtained for 384 diverse barley DNA samples scored for SNP 206. The three allelic states for the locus (C/C, green; C/T, yellow; T/T, red) were very easily discriminated. For this particular array the spot morphology was rather variable, with several cases of small or missing spots. Possible reasons for this and remedies are discussed below.
Figure 5.
Detection of barley SNP polymorphisms using the tagged microarray approach. Cultivars Steptoe and Morex have contrasting alleles for SNP 206 and SNP 957. Cy5 fluorescence indicates the presence of one allele and Cy3 the other. Samples were spotted in triplicate. The Cy3 (green) and Cy5 (red) colour-separated images and the two-colour (overlay) image are shown. Quantification of averaged array intensities (in arbitrary fluorescence units) and the Cy3/Cy5 ratios of signal intensities are also shown. SD, standard deviation.
Figure 6.
Microarray image for 384 barley DNA samples assayed for the SNP 206 allele. Reaction and detection conditions were the same as for Figure 5 and arraying format is the same as for Figure 2b. Each PCR was spotted four times per array.
DISCUSSION
The most important requisites for any marker method are simplicity, robustness and low cost. The method described here is simple in its reaction set-up and scoring. The set-up involves simple PCRs and scoring is by microarray scanning, which has been well developed for expression microarray screening and takes only a few minutes to carry out. Automated processing and analysis of the data is not addressed in this report, but this will be simple and rapid using conventional expression microarray software analysis packages. The arraying step is somewhat time consuming (∼15 min per 1536 samples, spotted in triplicate, using 48 arraying pins), but it can be totally automated. Just as for conventional expression microarrays, the TAM approach will only yield robust marker data if replicate experiments are performed, with the PCRs spotted multiple times in each experiment.
The biggest disadvantage of this approach with regard to its simplicity is the hybridisation step. This takes ∼90 min, including two 30 min incubations. However, the total effort involved in processing 10 slides is not much more that that needed for one slide and such an experiment can generate tens of thousands of marker scores. In practice, high throughput analysis using this approach is likely to be limited not by the hybridisation or arraying steps but by the PCR set-up and performance, as is the case for other high throughput PCR-based approaches. We estimate that a single conventional microarrayer and associated scanner could process the continuous output from 32 384-well PCR blocks, generating ∼36 000 scores in a working day or 84 000 scores in 24 h, if fully automated.
Robustness of the method
With regard to robustness, potential sources of inconsistency are PCR failures, spot quality and uneven signal strength and background signals across the slide. This method is effectively as robust as the PCRs which are used in it. Failed PCRs are probably a source of inaccuracy for the method and this can only be minimised by careful control of the PCR conditions, particularly avoiding the pipetting of very small volumes, using high quality PCR instrumentation and consumables and controlling the purity of input DNAs. Of course, such problems are common to all PCR-based marker methods. Spot quality may be compromised to some extent by direct spotting of PCR mixes, but in our experience the only significant problem has been missing or tiny spots in some instances, as seen in Figure 6. This tends to be associated with particular arraying pins and is exacerbated by PCR plate deformation after cycling. We have found that a 15 min step of 4°C at the end of the PCR counteracts this latter problem and good quality arraying pins should be used if possible. The signal strength and background are to a large extent dictated by the quality of the slide used. We tried several different suppliers and encountered major differences in backgrounds, particularly for Cy3. The slides used in this study give acceptable background levels in almost all cases and overall signal strength is usually acceptable. Nevertheless, several arrays on at least two slides should be used to ensure a robust data set. This has a very minor cost implication (∼$10 per slide) but does impact on arraying time.
The robustness of the method can be improved by using Cy3 detection for lower yielding PCR products. Cy3 tag detectors typically give roughly 3- to 4-fold better signal to background ratios than Cy5 detectors (Fig. 2d). The ability to exchange fluorochromes on the tag detectors (Fig. 3a) allows detection to be optimised after arraying, i.e. without the need to pre-test the PCR product ratios.
Cost of the method
The cost of this approach is very competitive. It requires very small amounts of expensive fluorescent tag detector hybridisation probes (∼200 ng per 10 000 assays). A particular tag detector probe can be used for an unlimited number of different loci, since it recognises the tag, not the locus. The only other specialised reagents are the allele-specific PCR primers, which are approximately 50mers, containing the relatively cheap C-18 spacer moiety, and biotinylated common primers (approximately 20mers). Also, unpurified PCR products are spotted directly without the need for expensive, time consuming further purification. In our experience, the primer cost is roughly half the cost of the Taq DNA polymerase. Using 5 µl PCRs we can score a marker in 3072 samples for a total consumable cost of ∼$180, or roughly 6c per assay. The capital equipment needed for the method is also reasonably cheap and readily available. Microarrayers and scanners are ubiquitous in well-established molecular genetic institutions and cost ∼$100 000.
Applicability and versatility of the approach
This approach can in principle detect any sequence polymorphism which can be distinguished by a pair of allele-specific PCR primers. The method has been shown to work well with retrotransposon insertion sequence polymorphism and it also works well with SNP markers, when efficient conditions for allele-specific PCR are used. There is no obvious reason why it should not work equally well with any DNA sequence polymorphism that involves insertion, deletion, replacement or rearrangement of DNA, such as indels or DNA rearrangements.
In this study we have applied this method to the analysis of a small number of loci in many DNA samples. In our opinion this is the particular strength of this approach and we believe that it will be very useful in screening large populations of animals or plants for ‘high value’ markers linked to important traits, including disease susceptibility or resistance, and useful agronomic traits. Nevertheless, a given tag detector can be applied to many markers, by using the same tags on many different locus-specific primers. In this way a slide could be used to score anything between a single marker in thousands of samples to thousands of markers in a single sample.
Acknowledgments
ACKNOWLEDGEMENTS
We thank David Lilley and Zhengyun Zhao for much helpful advice with the oligonucleotide synthesis, and Alex Vershinin and Malcolm Macaulay for pea and barley DNAs, respectively. This work was supported by grant 31502 (TEGERM) from the European Commission under the Framework V ‘Quality of Life and Management of Living Resources’ Program. A patent application covering this approach has been filed.
REFERENCES
- 1.Vos P., Hogers,R., Bleeker,M., van de Lee,T., Hornes,M., Frijters,A., Pot,J., Peleman,J., Kuiper,M. and Zabeau,M. (1995) AFLP: a new technique for DNA fingerprinting. Nucleic Acids Res., 23, 4407–4414. [DOI] [PMC free article] [PubMed] [Google Scholar]
- 2.Jeffreys A., Wilson,V. and Thein,S.L. (1985) Hypervariable ‘minisatellite’ regions in human DNA. Nature, 314, 67–73. [DOI] [PubMed] [Google Scholar]
- 3.Jenkins S. and Gibson,N. (2002) High throughput SNP genotyping. Comp. Funct. Genomics, 3, 57–66. [DOI] [PMC free article] [PubMed] [Google Scholar]
- 4.Tsuchihashi Z. and Dracopoli,N.C. (2002) Progress in high throughput SNP genotyping methods. Pharmacogenomics J., 2, 103–110. [DOI] [PubMed] [Google Scholar]
- 5.Schena M., Shalon,D., Davis,R.W. and Brown,P.O. (1995) Quantitative monitoring of gene expression patterns with a complementary DNA microarray. Science, 270, 467–470. [DOI] [PubMed] [Google Scholar]
- 6.Wang D.G., Fan,J.B., Siao,C.J., Berno,A., Young,P., Sapolsky,R., Ghandour,G., Perkins,N., Winchester,E., Spencer,J. et al. (1998) Large-scale identification, mapping and genotyping of single-nucleotide polymorphisms in the human genome. Science, 280, 1077–1082. [DOI] [PubMed] [Google Scholar]
- 7.Hirschhorn J.N., Sklar,P., Lindblad-Toh K., Lim,Y.M., Ruiz-Gutierrez,M., Bolk,S., Langhorst,B., Schaffner,S., Winchester,E. and Lander,E.S. (2000) SBE-TAGS: an array-based method for efficient single-nucleotide polymorphism. Proc. Natl Acad. Sci. USA, 97, 12164–12169. [DOI] [PMC free article] [PubMed] [Google Scholar]
- 8.Lindblad-Toh K., Tanenbaum,D.M., Daly,M.J., Winchester,E., Liu,W.-O., Villapakkam,A., Stanton,S.E., Larsson,C., Hudson,T.J., Johnson,B.E. et al. (2000) Loss-of-heterozygosity analysis of small cell lung carcinomas using single nucleotide polymorphism arrays. Nature Biotechnol., 18, 1001–1005. [DOI] [PubMed] [Google Scholar]
- 9.Jaccoud D., Peng,K., Feinstein,D. and Kilian,A. (2001) Diversity arrays: a solid state technology for sequence information-independent genotyping. Nucleic Acids Res., 29, e25. [DOI] [PMC free article] [PubMed] [Google Scholar]
- 10.Pastinen T., Raitio,M., Lindroos,K., Tainola,P., Peltonen,L. and Syvanen,A.C. (2000) A system for specific, high-throughput genotyping by allele-specific primer extension on microarrays. Genome Res., 10, 1031–1042. [DOI] [PMC free article] [PubMed] [Google Scholar]
- 11.Guo Z., Gatterman,M.S., Hood,L., Hansen,J.A. and Petersdorf,E.W. (2002) Oligonucleotide arrays for high-throughput SNPs detection in the MHC class I genes: HLA-B as a model system. Genome Res., 12, 447–457. [DOI] [PMC free article] [PubMed] [Google Scholar]
- 12.Lindroos K., Sigurdsson,S., Johansson,K., Ronnblom,L. and Syvanen,A.C. (2002) Multiplex SNP genotyping in pooled DNA samples by a four-colour microarray system. Nucleic Acids Res., 30, e70. [DOI] [PMC free article] [PubMed] [Google Scholar]
- 13.Flavell A.J., Knox,M.R., Pearce,S.R. and Ellis,T.H.N. (1998) Retrotransposon-based insertion polymorphisms (RBIP) for high throughput marker analysis. Plant J., 16, 643–650. [DOI] [PubMed] [Google Scholar]
- 14.Rust S., Funke,H. and Assman,G. (1993) Mutagenically-separated PCR (MS-PCR): a highly specific one step procedure for easy mutation detection. Nucleic Acids Res., 21, 3623–3629. [DOI] [PMC free article] [PubMed] [Google Scholar]
- 15.Whitcombe D., Theaker,J., Guy,S.P., Brown,T. and Little,S. (1999) Detection of PCR products using self-probing amplicons and fluorescence. Nat. Biotechnol., 17, 804–807. [DOI] [PubMed] [Google Scholar]
- 16.Shchepinov M.S., Udalova,I.A., Bridgman,A.J. and Southern,E.M. (1997) Oligonucleotide dendrimers: synthesis and use as polylabelled DNA probes. Nucleic Acids Res., 25, 4447–4454. [DOI] [PMC free article] [PubMed] [Google Scholar]
- 17.Juul T. (2001) Unifoliata: properties and partners, PhD thesis, University of East Anglia, Norwich, UK. [Google Scholar]
- 18.Tost J., Brandt,O., Boussicault,F., Derbala,D., Caloustian,C., Lechner,D. and Gut,I.G. (2002) Molecular haplotyping at high throughput. Nucleic Acids Res., 30, e96. [DOI] [PMC free article] [PubMed] [Google Scholar]
- 19.Newton C.R., Graham,A., Heptinstall,L.E., Powell,S.J., Smmmers,C., Kalsheker,N., Smith,J.C. and Markham,A.F. (1989) Analysis of any point mutation in DNA. The amplification refractory mutation system (ARMS). Nucleic Acids Res., 17, 2503–2516. [DOI] [PMC free article] [PubMed] [Google Scholar]


