Abstract
Studies investigating normal and abnormal cardiac development are frequently limited by an inability to assess cardiovascular function within the intact organism. In this work, optical coherence tomography (OCT), a new method of micron-scale, noninvasive imaging based on the measurement of backscattered infrared light, was introduced for the high resolution assessment of structure and function in the developing Xenopus laevis cardiovascular system. Microstructural details, such as ventricular size and wall positions, were delineated with OCT at 16-μm resolution and correlated with histology. Three-dimensional representation of the cardiovascular system also was achieved by repeated cross-sectional imaging at intervals of 25 μm. In addition to structural information, OCT provides high speed in vivo axial ranging and imaging, allowing quantitative dynamic activity, such as ventricular ejection fraction, to be assessed. The sensitivity of OCT for dynamic assessment was demonstrated with an inotropic agent that altered cardiac function and dimensions. Optical coherence tomography is an attractive new technology for assessing cardiovascular development because of its high resolution, its ability to image through nontransparent structures, and its inexpensive portable design. In vivo and in vitro imaging are performed at a resolution approaching that of histopathology without the need for animal killing.
Keywords: microscopy, imaging, embryology, development
Abnormal cardiac function remains a leading cause of morbidity and mortality worldwide. Developmental animal models have been used to assess molecular and physiologic mechanisms of not only congenital cardiac abnormalities but also genetic predisposition to “acquired” abnormalities (1, 2). Although imaging technologies exist that allow the changes of human adult cardiac function to be followed over time, comparable imaging does not exist for following cardiac function in the developing animal embryo. In this work, a recently developed imaging technology, optical coherence tomography (OCT), is introduced for the high resolution assessment of structure and function in the developing Xenopus laevis cardiovascular system.
Various technologies have been applied to the visualization and quantitation of morphology and function in embryonic hearts. Confocal microscopy has had a significant impact in the biological sciences due because of its ability to image biological structure, cells, and subcellular constituents with high resolution and contrast. Successes with laser-scanning confocal microscopy have revealed fascinating images such as those of calcium dynamics in sea urchin eggs (3) and Xenopus oocytes (4) during fertilization. However, most laser-scanning confocal microscopy applications remain restricted to histologically prepared specimens because of difficulties associated with in vivo imaging. Many of these difficulties involve the use of fluorophores to increase contrast over backscatter confocal microscopy. Upon excitation of the fluorophores, byproducts toxic to the embryos are released, limiting embryo viability and subsequent imaging time (5). Fluorescence from regions outside the focal plane and maintenance of submicron specimen position (i.e., motion sensitivity) are additional factors that make in vivo confocal microscopy difficult to achieve. To our knowledge, no publications have addressed in vivo confocal microscopy of the developing cardiovascular system because of the limitations described, particularly the problems inherent to imaging rapidly moving cardiac structures.
Video light microscopy has been used to acquire real-time images of the developing beating heart by digitizing the expanding and contracting blood pool in early, transparent hearts. This has been effective for obtaining angiographic-type estimates of ventricular function. However, it is limited to en face views, and, at later, nontransparent stages, only surface morphology is visible (6). Therefore, investigators are confined to using embryos that are transparent during early stages, exposing the heart via surgical intervention or killing the animal at a predetermined stage.
High resolution magnetic resonance imaging has been used to produce in vivo cross-sectional images of early Xenopus development (7) with resolutions as high as 12 μm. However, the long acquisition times are prohibitive for the in vivo analysis of cardiac dynamics, and structural delineation is plagued by motion artifacts. Furthermore, the technology is expensive and impractical for general use by developmental biologists.
Ultrasound has the potential to image deeply into biological tissue. High frequency (40–100 MHz) ultrasound backscatter microscopy is capable of 50-μm resolutions to depths of 4–5 mm and has been applied to the analysis of early embryonic development in the mouse (8). However, imaging requires a transducing medium or direct contact. Also, M-mode echocardiography is problematic in developmental animal models with high heart rates because of the relaxation time of the ultrasound transducer, which limits the rate at which data can be acquired.
The high resolution imaging that is possible with OCT is well suited to overcome the limitations inherent in imaging the developing heart. OCT can be thought of as an analogue to ultrasound B-mode imaging or radar except reflections of light from biological tissue layers are detected rather than acoustic reflections. Imaging is performed by directing a focused beam of light into the biological tissue and measuring the delay time (echo delay) for the backscattered light to return to the instrument. Backscatter or reflections are returned from each microstructural feature within the tissue during a single axial (depth) scan. A cross-sectional image of the tissue is constructed by laterally scanning the light beam through the tissue and assembling adjacent axial scans (9).
OCT has been applied in ophthalmology for in vivo imaging of the retina and is promising for the diagnosis and monitoring of a wide range of macular diseases (10–12). More recently, advances in OCT have made imaging possible in highly scattering tissues. In vitro studies suggest that OCT can assess microstructural morphology in situ (13–15). OCT has been applied to developmental biology, in which repeated in vivo imaging of a developing system is used to track developmental changes (16, 17).
In this study, we demonstrated the advantages of OCT for imaging cardiovascular development and assessing function by acquiring in vitro images of the Xenopus cardiovascular system, generating a three-dimensional data set with projections, and comparing images with corresponding histology. A high speed OCT system with a laser source was used to rapidly acquire in vivo images of a beating heart to illustrate the future potential of this technology. Because these lasers are not currently commercially available, a diode-based OCT system was used in a manner similar to ultrasound M-mode echocardiograms. In vivo optical cardiograms were obtained from embryonic hearts, and quantitative measurements were made of cardiac chamber dimensions and wall displacements. Finally, to illustrate the ability of OCT to detect variations in cardiac function, an inotropic agent was administered to alter the functional state of the heart.
MATERIALS AND METHODS
OCT.
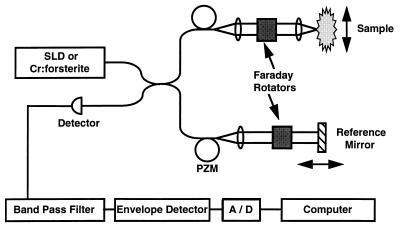
The principles and physics of OCT have been described in detail (9) but will be briefly summarized here. The echo delay time of light returning from the specimen cannot be measured directly by electronic methods because of the high speeds associated with the propagation of light. Therefore, a technique known as interferometry was used. To measure the precise depth and magnitude of each reflection, OCT incorporates a fiber optic Michelson interferometer (Gould Fiber Optics, Glen Burnie, MD). A schematic of the device is shown in Fig. 1. This schematic includes components for two separate configurations. One configuration incorporates a commercially available 1300-nm, low coherence superluminescent diode as a light source and was used to acquire in vitro images and optical cardiograms. Additional components, such as the 1280-nm, mode-locked, solid-state chromium [Cr (4+)]:forsterite laser source, piezoelectric modulator, and Faraday rotators (Isowave, Dover, NJ) comprised a second configuration for high speed imaging. The superluminescent diode source will be discussed first followed by the rationale for using the laser source and for the necessary modifications.
Figure 1.
Schematic diagram of the OCT imaging systems. The OCT system uses fiber optics and a low coherence light source. Components necessary for high speed OCT imaging include a Cr (4+):forsterite laser, a piezoelectric fiber modulator (PZM), and Faraday rotators. A/D, analog-to-digital converter.
Light is split equally between the reference and sample arms of the interferometer. A computer-controlled, mechanical-scanning galvanometer reference arm mirror sets the depths at which backscattering will be measured and induces a known Doppler shift in the returned light. Light sent to the sample arm is focused into the tissue. Reflections or backscatter from both arms are recombined by the fiber coupler, detected by a photodiode, and electronically filtered around the Doppler-shifted frequency. Interference between the two arms only occurs when their path lengths are matched to within the coherence length of the source. Thus, the coherence length of the source determines the axial resolution. The 50-nm spectral bandwidth (the axial resolution is inversely proportional to the spectral bandwidth) of this superluminescent diode yields an axial free space resolution of 16 μm. This resolution was verified by measuring the point spread function off of a mirror. The transverse resolution is determined by the spot size of the incident beam. An anti-reflection-coated lens was used to focus the beam into the specimen. The spot size was 30 μm, which yielded a 1.1-mm confocal parameter (depth of field). The confocal parameter for the beam is directly related to the square of the spot size, which was optimally selected to closely match axial and transverse resolutions while maintaining a sufficient depth of field. The signal-to-noise ratio was 109 dB using an intensity of 160 μW incident on the specimen. The signal-to-noise ratio was determined by the maximal detected power when the optical beam was reflected from a mirror divided by the variance of the background noise of the instrument. Images were generated by displaying the logarithm of the backscattered intensity vs. position in gray scale. Acquisition time for a single axial scan was 33–100 ms depending on the axial scan length. Therefore, an image comprised of 300 axial scans required 10–30 s to acquire.
High speed OCT imaging studies were performed with an alternate OCT system that uses a solid-state Cr (4+):forsterite laser as the low coherence light source (18). Image acquisition speed and signal-to-noise were determined in part by the optical power. The Cr (4+):forsterite laser provided additional power (2 mW) incident on the specimen to maintain a signal-to-noise ratio of 110 dB during high speed imaging. Other modifications in Fig. 1 include the incorporation of a piezoelectric fiber stretcher (modulator) as a replacement for the galvanometer reference arm scanner. This incorporation enabled faster axial scanning (0.83 ms/axial scan) and an image acquisition rate of four images (300 × 300 pixels) per second (250 ms/image). The Faraday rotators compensated for the birefringence induced during stretching of the fiber. The axial and transverse resolutions were comparable to those for the superluminescent diode source.
OCT is able to image in scattering specimens because the near infrared wavelengths used for imaging are less scattered than visible wavelengths. OCT uses coherent interferometry to detect backscattered light, so it tends to reject multiply scattered photons that would degrade image quality. An average index of refraction of 1.35 was determined for these Xenopus specimens by measuring the optical thickness of the specimen using OCT and comparing it to the actual thickness (19). The measured index is close to that of water (n = 1.33), the main constituent of the specimen, but represents an average value because the specimens are inhomogeneous and optically scattering. Microscopic and macroscopic variations in index of refraction within the specimen are responsible for scattering. However, these index variations are typically less than 10% and do not significantly alter the anatomical dimensions within the images. The predicted in vivo resolution is the free-space resolution of the system divided by the index of refraction or 16 μm/1.35 ≈ 12 μm. In vivo resolutions were confirmed in Xenopus by examining the convergence of structures within an image and measuring the distance at which two distinct layers could no longer be resolved.
Specimen Preparation and Imaging.
X. laevis embryos were maintained in a solution of 1/10 × modified Barth’s saline at room temperature with a 12-h light–dark cycle. Tadpoles were fed a prepared diet of Xenopus Nutrient (Connecticut Valley Biological, South Hampton, MA) once daily. The animals used in this study were cared for and maintained under the established protocols of the Committee on Animal Care, Massachusetts Institute of Technology.
For in vitro imaging, three specimens were used. Each was immersed in 0.05% benzocaine for 1 h until no cardiac activity was observed. Imaging was performed by orienting the specimen so that the light beam from the OCT sample arm was incident on the ventral side. The position of the invisible infrared OCT beam (1300 nm) on the specimen was monitored with a coincident visible guiding beam (632 nm). Two-dimensional scans were acquired perpendicular to the anteroposterior axis. The specimen was translated in 25-μm steps with a micron resolution, computer-controlled stage, and cross-sectional images were acquired from the level of the anterior arteries to the posterior ventricle. Immediately after image acquisition, specimens were placed in a 10% buffered solution of formaldehyde for standard histological preparation. Histological sections, 5 μm thick, were sectioned and stained with hematoxylin/eosin for comparison with acquired OCT images. Correspondence was determined by the best match between OCT images and light microscopy observations of the histology. Segmentation of cardiac structures for three-dimensional projections was performed manually using image processing software (image 1.60, National Institutes of Health, Bethesda, MD).
For in vivo imaging, nine specimens were used. Specimens were anesthetized by immersion in 0.05% tricaine for 5 min until they no longer responded to touch. The OCT imaging beam was scanned across the ventral side of the specimen to capture the dynamic behavior of the cardiac chambers and arteries. To capture OCT optical cardiograms, the beam was positioned in one location over the ventricle and held stationary as data from this single location were acquired over time. For each beat within these cardiograms, four points were recorded by a blinded observer (using iplab spectrum 3.0, Spectrum Analytics, Vienna, VA) that corresponded to the locations of the dorsal and ventral ventricular wall. The end of systole was defined as the minimum ventricular dimension, and the end of diastole was defined as the maximum ventricular dimension. No micropipet electrode was used to obtain an electrocardiogram for the specimens because this would have interfered with cardiac performance and optical imaging.
Inotropic Drug.
After acquisition of normal OCT optical cardiograms, verapamil, an inotropic drug, was administered to vary the functional behavior of the heart. A dose of 25 ng was administered by placing drops on the ventral side as the specimen rested in the optical imaging setup. This permitted data acquisition before and immediately after administration of the drug as it diffused from the external membrane to the heart. OCT optical cardiograms were acquired at 1-min intervals for 4 min. Cardiac measurements and heart parameters were obtained as described in the following section.
Analysis.
Measurements were obtained for the heart rate, end diastolic and systolic dimensions, and ejection and filling times. The ventral wall velocity was calculated by determining the change in dimension between the diastolic and systolic ventral wall positions divided by the ejection time. The fractional shortening was calculated from [(end diastolic dimension − end systolic dimension)/end diastolic dimension] × 100. To determine the volume of the heart, an ellipsoid model was used assuming that the two minor axes were equal and that the major axis was twice the length of a minor axis (20). The ejection fraction was then determined from [(diastolic volume − systolic volume)/diastolic volume] × 100. Averages and SD were obtained from 16 beats present in each optical cardiogram. Paired t tests were performed on all of the measured data to determine if statistically significant changes had occurred between successive recording times.
RESULTS
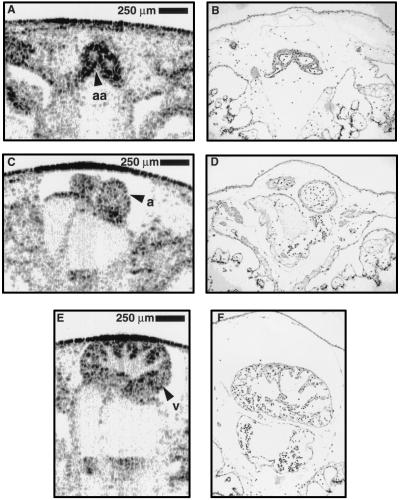
A comparison was made between in vitro-acquired OCT images and the corresponding histology from a stage 47 (7 day) (21) specimen. These data were used to validate our morphological findings in the OCT images. In Fig. 2, representative data from three cross-sectional planes are shown from the same specimen; these data illustrate the strong correlation throughout various regions. The OCT image in Fig. 2A (histology Fig. 2B) is a cross-sectional image of the two major branches of the ventral aorta anterior to the bifurcation. The muscular walls, as thin as three to four cell layers, are distinguished from the larger lumens and surrounding tissue. Similar correlations can be noted between Fig. 2 C and D. In Fig. 2 E and F, the internal trabeculae carneae network and papillary muscles of the ventricle are identified in the OCT image and histology, respectively.
Figure 2.
Comparison of cross-sectional OCT images from a single Xenopus heart with corresponding histology. Standard histological preparation was performed and stained with hematoxylin/eosin. Correlation between OCT images and histology is strong. (A and B) Image and corresponding histology of the major arteries of the ventral aorta, anterior to bifurcation. (C and D) Atria within the pericardial sac. (E and F) Cross-section of ventricle showing trabeculae carneae network and papillary muscles within the chamber. Note the preparation artifacts frequently present in histology, such as the distorted outer membrane and chamber displacement and the ability of OCT to acquire optical histology while preserving in vivo orientation. a, atrium; aa, arteries with lumens; v, ventricle.
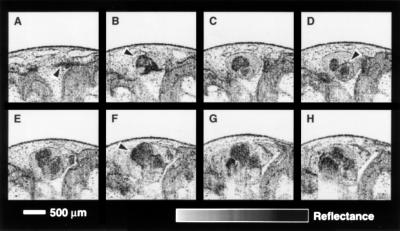
Fig. 3 is a selection from 22 cross-sectional images that were acquired from a stage 47 tadpole. This sequence demonstrates the ability of OCT imaging to delineate fine cardiovascular microstructure along the axis of the embryo and maintain registration between images for three-dimensional reconstruction. The image most anterior to the heart (Fig. 3A) includes two branches of the ventral aorta, one of which is noted by the arrow. Fig. 3B was acquired posterior and coplanar to Fig. 3A. This image shows the bifurcation of the ventral aorta as it exits the truncus arteriosus. Other cardiac structures noted in the three chamber amphibian heart include an atrium, shown in Fig. 3D, and the ventricle indicated in the Fig. 3F. Both atria and the ventricle can be identified in many of the images in this sequence. The pericardial sac is apparent in Fig. 3B–H.
Figure 3.
Sequence of representative in vitro OCT images acquired with the superluminescent diode source illustrating the morphology of the Xenopus heart. High resolution images permit the identification of cardiovascular morphology. (A) Arrow indicates an artery; (B) bifurcation of ventral aorta leaving the truncus arteriosus; (D) atrium; (F) ventricle.
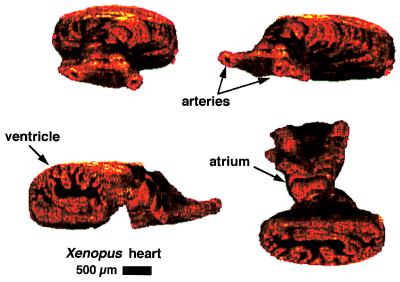
The use of computer-controlled stages with micron step size enables precise registration between spatially acquired images. A series of 45 images were acquired every 25 μm from a stage 49 (12-day) tadpole for the three-dimensional reconstruction shown in Fig. 4. Four projections of this three-dimensional data set are used to illustrate three-dimensional morphological arrangement of cardiac structure, which is often difficult to envision from a series of two-dimensional images. Two major branches of the ventral aorta, one atrium, and the ventricle are distinguishable. The second atrium is difficult to visualize near the ventricle. A cut-away section of the ventricle allows the internal trabeculae carneae network and papillary muscles to be visualized.
Figure 4.
Three-dimensional reconstruction of Xenopus cardiovascular system. Forty-five cross-sectional images were assembled to produce four different projections of the same heart. Structures such as the branches of the ventral aorta, the ventricle, and an atrium are visualized. A cut-away of the ventricle shows the internal trabeculae carneae network.
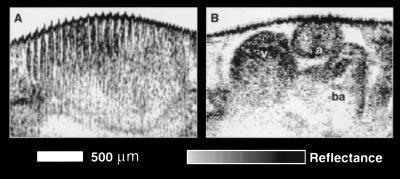
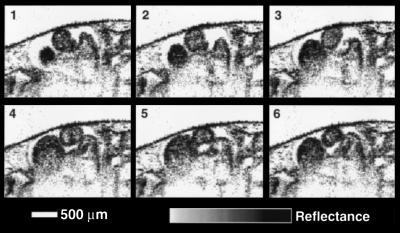
Although the relatively slow data acquisition rate of the diode-based system (30 s per image) is adequate for in vitro imaging of microstructure, two-dimensional in vivo imaging of the rapidly beating heart requires considerably faster imaging speeds. To illustrate the presence of motion artifacts, an in vivo image of a beating heart acquired with the diode-based system is shown in Fig. 5A. The periodic bands within the image correspond to the movement of the cardiac chamber walls during the cardiac cycle. In contrast, Fig. 5B was acquired from the same heart at 4 frames per second with the laser-based OCT system. The morphology of the in vivo chambers is clearly delineated at this faster imaging speed. However, at 250 ms per image, the acquisition rate is still not fast enough to capture multiple images in one cardiac cycle. For this reason, multiple images were acquired over several cardiac cycles and were assembled to form a complete cycle. A sequence of six frames is shown in Fig. 6, comprising a complete beat. These frames were animated to produce a movie illustrating the dynamic, functional behavior of the developing heart.
Figure 5.
Comparison of OCT acquisition rates using the (A) superluminescent diode and (B) Cr (4+):forsterite laser. The in vivo Xenopus heart image in A was acquired in 30 s and contains multiple motion artifacts that completely mask the underlying anatomy. Image B was acquired in 0.25 s. The rapid acquisition eliminates the motion artifacts and enables the cardiac morphology to be visualized, in vivo, during the cardiac cycle. a, atrium; v, ventricle; ba, bulbous arteriosus.
Figure 6.
Image sequence of a cardiac cycle. High speed OCT images were acquired during the cardiac cycle at various time points from multiple beats and later sequenced to form a complete beat. 1–6, Ventricular filling during diastole along with atrial contraction and emptying.
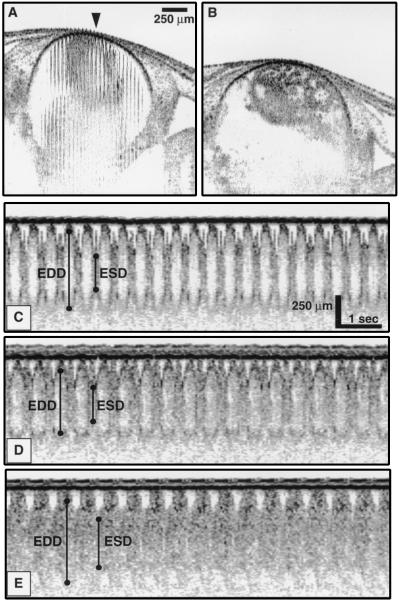
Unlike the source used with the diode-based system, the high speed system used a laser that is not currently commercially available. Although commercial sources with characteristics similar to this laser are anticipated in the near future, we investigated whether any dynamic information, other than two-dimensional imaging, could be obtained with the slower diode-based system. A single axial scan can be acquired rapidly (in 33–100 ms depending on the scan length) with the diode-based system, so an OCT optical cardiogram, analogous to an M-mode echocardiogram, can be obtained with this slower system. Oscillations corresponding to movement of the cardiovascular structure are observed in Fig. 7. Both the ventral and dorsal walls of the ventricle chamber can be identified. In Fig. 7A, the OCT beam was positioned over the ventricle at the site corresponding to the center of the image (arrow). Axial (depth) scans from this location were acquired over time and are shown in Figs. 7 C–E. Representative points are labeled that identify the inner ventricular wall boundaries and define end diastolic/systolic dimensions. From these points for each beat, cardiac parameters can be determined. Fig. 7C is an optical cardiogram of a normally functioning, anesthetized heart; Fig. 7 D and E were acquired at 1 and 4 min, respectively, after administration of verapamil. At later times, the inner wall boundary becomes less defined. It is possible that, initially, the moving blood produced a Doppler shift in the returned light that shifted the signal out of the detection filter bandwidth. As the heart rate slowed, this Doppler shift became less, allowing the backscattering blood to be detected. Fig. 7B is an image of the ventricle 10 min after the verapamil dose. Cardiac motion is minimal, and dilation of the ventricular chamber is evident.
Figure 7.
OCT images and optical cardiograms from an in vivo Xenopus heart. (A) Initial image showing chamber wall movement. (B) Final image of stopped heart acquired 10 min after dose of verapamil. (C) OCT optical cardiogram of a normal, anesthetized specimen. (D and E) Optical cardiograms acquired 1 and 4 min, respectively, after dose of verapamil. Representative bars indicate where end diastolic/systolic dimensions (EDD/ESD) were measured.
Dynamic indices were measured from multiple beats in one specimen using optical cardiograms obtained before and at 1, 2, 3, and 4 min after the administration of verapamil (Table 1). To determine the ejection fraction, the volume of the ventricle was approximated with an ellipsoid. Although many algorithms exist, such as the Pappus’ rule, summated ellipsoid method (22), and biplane Simpson’s rule (23) for modeling human ventricle volumes, few studies have modeled the developing amphibian heart. Based on OCT image data, the ellipsoid model more closely approximated the in vivo ventricle. The calculated results are summarized in Table 2. For all of the measured parameters, only 3 of 20 paired t tests failed to have a P value below 0.05. In addition, 13 of 20 had P values less than 0.005. No significant change in heart rate occurred after 2 min, and no significant change in filling time was noted between the initial measurement and 1 min after the verapamil dose. All other changes were statistically significant (P < 0.05).
Table 1.
Measured parameters of verapamil effects
| Time, min | HR, bpm | EDD, μm | ESD, μm | ET, ms | FT, ms |
|---|---|---|---|---|---|
| Initial | 128 ± 4 | 666 ± 18 | 398 ± 35 | 217 ± 22 | 251 ± 27 |
| 1 | 124 ± 5* | 616 ± 13‡ | 371 ± 27‡ | 236 ± 20* | 251 ± 20 |
| 2 | 119 ± 4* | 537 ± 13‡ | 413 ± 30‡ | 268 ± 11‡ | 236 ± 19† |
| 3 | 117 ± 5 | 710 ± 19‡ | 507 ± 22‡ | 223 ± 41‡ | 288 ± 34‡ |
| 4 | 115 ± 7 | 741 ± 17‡ | 478 ± 20‡ | 279 ± 31‡ | 240 ± 17‡ |
Significant differences: *P < 0.05;
P < 0.01;
P < 0.005.
HR, heart rate; EDD/ESD, end diastolic/systolic dimension; ET/FT, ejection/filling time.
Table 2.
Calculated parameters of verapamil effects
| Time, min | VWV, μm/s | FS, % | EF, % |
|---|---|---|---|
| Initial | 630 ± 86 | 40 ± 6 | 77 ± 6 |
| 1 | 572 ± 109 | 40 ± 5 | 77 ± 6 |
| 2 | 366 ± 69 | 23 ± 5 | 56 ± 8 |
| 3 | 504 ± 104 | 29 ± 4 | 63 ± 7 |
| 4 | 585 ± 66 | 35 ± 3 | 73 ± 4 |
VWV, ventral wall velocity; FS, fractional shortening; EF, ejection fraction.
DISCUSSION
The investigation of cardiac development in animal models, using the powerful technologies of molecular and cellular biology, has been pursued aggressively to understand the mechanisms underlying cardiac dysfunction. However, severe limitations exist with current methods for assessing cardiac structure and dynamics in these animal models, frequently forcing investigators to analyze phenotypes with postmortem histopathology. The disadvantages of this approach include an inability to assess dynamic information and the killing of mutants that typically have limited availability. In addition, high quality histology is often difficult to obtain and costly, and it is time-consuming for these small, fragile specimens. Therefore, it is generally impractical to histologically prepare the large numbers of specimens typically needed for genetic and developmental studies. In this work, we demonstrated the feasibility of OCT for overcoming the limitations associated with current methods of imaging through its assessment of structural and dynamic information at micron-scale resolutions. Specifically, in vitro images of the developing Xenopus cardiovascular system were generated with OCT, and microstructural details were correlated with histology. OCT systems with different acquisition rates were compared and used to assess functional parameters in vivo. Finally, the sensitivity of OCT was examined by altering cardiac function with a negative inotropic agent.
As stated, cardiovascular morphology in the developing Xenopus was imaged with micron-scale resolution using OCT. Strong correlations between histology and OCT images are seen in Fig. 2, where myocardial walls, lumens, and papillary muscles are clearly delineated. However, in Fig. 2A, small arterial lumens are not clearly identified in the OCT image. Using a light microscope with a calibrated reticle, the smaller arterial cross-sections in this specimen were measured to be 8–15 μm. These lumen diameters were below the 16-μm resolution of the diode-based OCT system and, therefore, were unresolvable. Because cells in these specimens were 5–15 μm in diameter, OCT could not resolve individual cells, for they would appear as one or a few pixels in an image. However, cell boundaries or several layers of cells were resolvable, as shown in Fig. 2.
The ability of OCT to assess cardiovascular anatomy and function in three dimensions could represent a powerful tool for the developmental and molecular biologist. Morphologic abnormalities may not clearly be identified or appreciated in two dimensions, particularly those involving misorientation of cardiovascular structures. Three-dimensional reconstruction may extend the sensitivity of analysis. In Fig. 3, transitions of cardiac structures from the anterior bifurcation to the ventricular apex are noted, allowing a qualitative appreciation of the relative orientation of structures. In Fig. 4, this is extended to true three-dimensional reconstruction. As shown in this figure, an advantage of reconstruction is that rotation of the image around any axis is possible without the limitations associated with interpretation based on a single plane.
Perhaps one of the greatest advantages for using OCT is its ability to image in vivo microstructure at high speeds. Imaging studies were performed using a laser-based OCT system with a rapid acquisition rate (four frames per second). A representative image is shown in Fig. 5 and is directly compared with an image from the slower diode-based system. Chamber morphology is clearly delineated at the faster imaging rate whereas the diode-based system is unable to delineate even the cardiac chamber outline (Fig. 5A). Acquisition rates of four frames per second are shown in Figs. 5 and 6 to be sufficient to image in vivo morphology; however, limitations in acquisition time still exist. Although organisms in this study were anesthetized before imaging and thus had reduced heart rates, only a few images could be acquired during a single beat. The dominant limitation to acquisition rate in the current OCT system arises because of the method used for axial scanning. To obtain 300 × 300 pixel images at 30 frames per second (real-time), an axial scan must be acquired in 0.1 ms, nearly an order of magnitude faster than the current method. To reach this rate, we are currently investigating new techniques for high speed scanning. It should be noted that a trade-off exists between image acquisition speed and image size. Higher speeds can be obtained by reducing the number of pixels in the image. For the purposes of our current study, we chose to acquire high resolution (300 × 300 pixel) images at the expense of acquisition speed.
The source used with the diode-based OCT system is compact and commercially available and could be readily integrated with a bench-top microscope. This is in contrast to the laser source used with the high speed OCT system that is currently a limitation for bench-top, high speed OCT imaging in most biological laboratories. A solid-state laser source requires a larger amount of space and experienced technical personnel to operate and maintain. Although compact commercial sources with broad bandwidths and high powers are anticipated in the near future, we investigated whether any dynamic information, other than two-dimensional imaging, could be obtained with the slower diode-based system. We used repeated axial scans at one given transverse point on the specimen, rather than acquiring an entire image, to perform optical cardiograms. OCT optical cardiograms permitted quantitative measurements of chamber function (Fig. 7) and allowed assessment of changes over time.
The use of the anesthetic is another limitation of this current investigation because the heart is not functioning at its normal, physiological rate. Under anesthesia, the heart rate was slowed to around 120 beats per minute, which permitted 15 axial scans to be acquired per beat. However, this heart rate deviation is typical for all experiments involving the use of anesthetics to image these specimens and may be considered part of the baseline.
The sensitivity of OCT optical cardiograms for assessing changes in cardiac function in vivo was demonstrated by the addition of a negative inotropic agent. Verapamil, a calcium channel antagonist, results in a depression in heart rate and myocardial contractility in most species tested. As shown in Tables 1 and 2, OCT demonstrated a decrease in heart rate in addition to reductions in fractional shortening and ejection fraction after the verapamil dose. The administration of an inotropic drug via diffusion from the external ventral membrane to the heart was chosen to minimize side effects that would result from micropipet injections. Although diffusion does not result in a bolus of drug delivery, our emphasis in this study was to demonstrate the use of the OCT technology for noninvasively assessing changes in cardiac function, not to determine the specific effects of precise doses on the amphibian heart.
Optical measurements with OCT can be applied to the assessment of other variables such as cardiac output and flow velocity. To achieve this, OCT can be configured to measure the velocity of moving tissue and flowing blood using laser Doppler velocimetry (24). By directly digitizing the interference signal of the interferometer and frequency analyzing the waveform, the axial motion of the sample is manifested as a shift in the frequency of the modulated signal caused by a Doppler shift of the reflected light. The frequency of this Doppler-shifted light can be used to calculate the velocity of the moving tissue and/or blood. This is analogous to Doppler ultrasonography.
Future studies will focus on imaging at alternative wavelengths, on increasing resolution, and on the development of endoscope-based imaging systems. Tissue scattering and absorbance properties depend on the wavelength of incident light. Therefore, new laser sources at other wavelengths in the near-infrared will be examined to evaluate the changes of tissue imaging properties. New broad bandwidth sources also will be explored to increase resolution because, as stated previously, axial resolution with OCT depends inversely on the bandwidth of the source. Resolutions in the range of 4 μm have been achieved recently with solid-state laser sources (25, 26). Finally, the fiber-based design of OCT allows for small sample arm beam delivery systems such as a fiber optic imaging endoscope (27). Such an endoscope can be used in utero to examine cardiac development in live-bearing species.
In conclusion, we have shown that OCT evaluates both the structure and function of the Xenopus heart at micron-scale resolutions. The high resolution, high speed imaging provided by OCT represents a powerful tool in assessing and understanding the molecular basis for abnormal cardiac development.
Acknowledgments
The authors thank Dr. Hazel Sive and her laboratory personnel at the Massachusetts Institute of Technology for providing us with specimens and advice on the care and handling of embryos. We also acknowledge the technical input from Eric Swanson of the Massachusetts Institute of Technology Lincoln Laboratory. This work was supported by National Institutes of Health Grant 9-RO1-EY11289-10, the Office of Navel Research Medical Free Electron Laser Program Contract N00014-94-1-0717, and the Air Force Palace Knight Program. This work also was supported by Air Force Office of Scientific Research Contract F49620-95-1-0221, Joint Services Electronics Program Contract DAAH04-95-1-0038, Whittaker Foundation Contract 96-0205, and National Institutes of Health Contract NIH-1-R29-HL55686-01A1.
ABBREVIATION
- OCT
optical coherence tomography
References
- 1.Weinstein B M, Stemple D L, Driever W, Fishman M C. Nat Med. 1995;1:1143–1147. doi: 10.1038/nm1195-1143. [DOI] [PubMed] [Google Scholar]
- 2.Chisaka O, Capecchi M R. Nature (London) 1991;350:473–479. doi: 10.1038/350473a0. [DOI] [PubMed] [Google Scholar]
- 3.Stricker S A, Centonze V E, Paddock S W, Schatten G. Dev Biol. 1992;149:370–380. doi: 10.1016/0012-1606(92)90292-o. [DOI] [PubMed] [Google Scholar]
- 4.Girard S, Clapham D. Science. 1993;260:229–232. doi: 10.1126/science.8385801. [DOI] [PubMed] [Google Scholar]
- 5.Giloh H, Sedat J W. Science. 1982;217:1252–1255. doi: 10.1126/science.7112126. [DOI] [PubMed] [Google Scholar]
- 6.Shottan D M. J Cell Sci. 1988;89:129–150. doi: 10.1242/jcs.89.2.129. [DOI] [PubMed] [Google Scholar]
- 7.Jacobs R E, Fraser S E. Science. 1994;263:681–684. doi: 10.1126/science.7508143. [DOI] [PubMed] [Google Scholar]
- 8.Turnbull D H, Bloomfield T S, Baldwin H S, Foster F S, Joyner A L. Proc Natl Acad Sci USA. 1995;92:2239–2243. doi: 10.1073/pnas.92.6.2239. [DOI] [PMC free article] [PubMed] [Google Scholar]
- 9.Huang D, Swanson E A, Lin C P, Schuman J S, Stinson W G, Chang W, Hee M R, Flotte T, Gregory K, Puliafito C A, Fujimoto J G. Science. 1991;254:1178–1181. doi: 10.1126/science.1957169. [DOI] [PMC free article] [PubMed] [Google Scholar]
- 10.Hee M R, Izatt J A, Swanson E A, Huang D, Schuman J S, Lin C P, Puliafito C A, Fujimoto J G. Arch Ophthalmol. 1995;113:325–332. doi: 10.1001/archopht.1995.01100030081025. [DOI] [PubMed] [Google Scholar]
- 11.Puliafito C A, Hee M R, Lin C P, Reichel E, Schuman J S, Duker J S, Izatt J A, Swanson E A, Fujimoto J G. Ophthalmology. 1995;102:217–229. doi: 10.1016/s0161-6420(95)31032-9. [DOI] [PubMed] [Google Scholar]
- 12.Puliafito C A, Hee M R, Schuman J S, Fujimoto J G. Optical Coherence Tomography of Ocular Diseases. Thorofare, NJ: SLACK; 1995. [Google Scholar]
- 13.Schmitt J M, Yadlowsky M J, Bonner R F. Dermatology. 1995;191:93–98. doi: 10.1159/000246523. [DOI] [PubMed] [Google Scholar]
- 14.Fujimoto J G, Brezinski M E, Tearney G J, Boppart S A, Bouma B, Hee M R, Southern J F, Swanson E A. Nat Med. 1995;1:970–972. doi: 10.1038/nm0995-970. [DOI] [PubMed] [Google Scholar]
- 15.Brezinski M E, Tearney G J, Bouma B E, Hee M R, Swanson E A, Southern J F, Fujimoto J G. Circulation. 1996;93:1206–1213. doi: 10.1161/01.cir.93.6.1206. [DOI] [PubMed] [Google Scholar]
- 16.Boppart S A, Brezinski M E, Bouma B E, Tearney G J, Fujimoto J G. Dev Biol. 1996;177:54–63. doi: 10.1006/dbio.1996.0144. [DOI] [PubMed] [Google Scholar]
- 17.Boppart S A, Brezinski M E, Tearney G J, Bouma B E, Fujimoto J G. J Neurosci Methods. 1996;70:65–72. doi: 10.1016/S0165-0270(96)00104-5. [DOI] [PubMed] [Google Scholar]
- 18.Tearney G J, Bouma B E, Boppart S A, Golubovic B, Swanson E A, Fujimoto J G. Opt Lett. 1996;21:1408–1410. doi: 10.1364/ol.21.001408. [DOI] [PubMed] [Google Scholar]
- 19.Tearney G J, Brezinski M E, Southern J F, Bouma B E, Hee M R, Fujimoto J G. Opt Lett. 1995;20:2258–2260. doi: 10.1364/ol.20.002258. [DOI] [PubMed] [Google Scholar]
- 20.American Society of Echocardiography Committee on Standards. J Am Soc Echocard. 1989;2:358–367. doi: 10.1016/s0894-7317(89)80014-8. [DOI] [PubMed] [Google Scholar]
- 21.Nieuwkoop P D, Faber J. Normal Table of Xenopus Laevis. New York: Garland; 1994. [Google Scholar]
- 22.Stewart W J, Rodkey S M, Gunawardena S, White R D, Luvisi B, Klein A L, Salcedo E. J Am Soc Echocard. 1993;6:553–563. doi: 10.1016/s0894-7317(14)80172-7. [DOI] [PubMed] [Google Scholar]
- 23.Schmidt K G, Silverman N H, Hare G F V, Hawkins J A, Cloez J L, Rudolph A M. Circulation. 1990;81:325–333. doi: 10.1161/01.cir.81.1.325. [DOI] [PubMed] [Google Scholar]
- 24.Wang X J, Milner T E, Nelson J S. Opt Lett. 1995;20:1337–1339. doi: 10.1364/ol.20.001337. [DOI] [PubMed] [Google Scholar]
- 25.Clivaz X, Marquis-Weible F, Salathe R P. Opt Lett. 1992;17:4–6. doi: 10.1364/ol.17.000004. [DOI] [PubMed] [Google Scholar]
- 26.Bouma B E, Tearney G J, Boppart S A, Hee M R, Brezinski M B, Fujimoto JG. Opt Lett. 1995;20:1486–1488. doi: 10.1364/ol.20.001486. [DOI] [PubMed] [Google Scholar]
- 27.Tearney G J, Boppart S A, Bouma B E, Brezinski M E, Weissman N J, Southern J F, Fujimoto J G. Opt Lett. 1996;21:543–545. doi: 10.1364/ol.21.000543. [DOI] [PubMed] [Google Scholar]


