

Abstract
To better understand the neurotoxic effects of diverse hazards on the developing human nervous system, researchers and clinicians rely on data collected from a number of model species that develop and mature at varying rates. We review the methods commonly used to extrapolate the timing of brain development from experimental mammalian species to humans, including morphological comparisons, “rules of thumb” and “event-based” analyses. Most are unavoidably limited in range or detail, many are necessarily restricted to rat/human comparisons, and few can identify brain regions that develop at different rates. We suggest this issue is best addressed using “neuroinformatics”, an analysis that combines neuroscience, evolutionary science, statistical modeling and computer science. A current use of this approach relates numeric values assigned to ten mammalian species and hundreds of empirically derived developing neural events, including specific evolutionary advances in primates. The result is an accessible, online resource (http://www.translatingtime.net/) that can be used to equate dates in the neurodevelopmental literature across laboratory species to humans, predict neurodevelopmental events for which data are lacking in humans, and help to develop clinically relevant experimental models.
Keywords: brain maturation, comparative development, cross-species development, humans, neurodevelopment
Introduction
Neurotoxicologists, developmental researchers, and pediatric clinicians use animal models to gather information about brain development and its disruptions, cellular or molecular mechanisms underlying neurotoxic effects, and potential interventions that cannot be studied directly in humans, but must be optimally timed for maximum safety and effectiveness. How best to relate data obtained from the nervous systems of diverse experimental species to humans is one of the most important challenges facing both basic and applied research (Figure 1).
FIGURE 1.
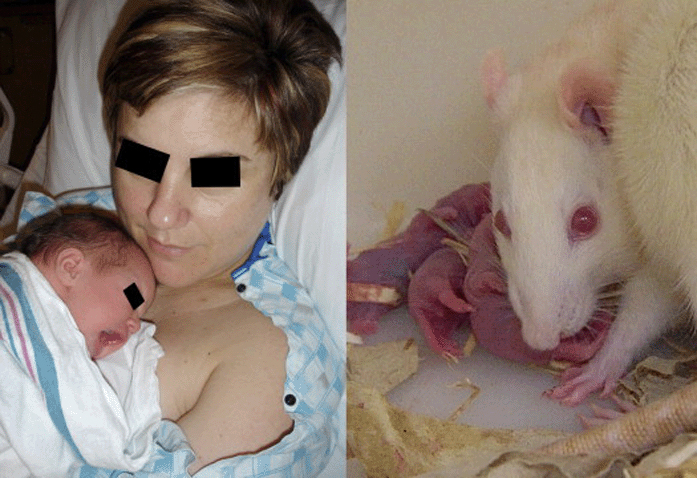
Despite the challenges, it is essential to find a way to relate neural development across experimental species to humans.
Not only must we be able to extrapolate from non-humans to humans for efficient biomedical research, we must also integrate data across experimental species. A specific animal model might be chosen for any conjunction of widely varying reasons. Accessibility of embryos, cost of acquiring or maintaining animals, availability of genomic analyses or probes, and/or close similarity to human physiology might factor in the design of a laboratory experiment. The result is a variety of data obtained in species born at a wide range of developmental stages and maturing at different rates, but with little explicit agreement or common understanding on how to relate them to humans. For example, how might we best study the effects of toxins on the crucial first-generated cortical cells (subplate cells) when initial studies describing these cells were done in macaques (Kostovic and Rakic, 1980), later studies used cats (Chun and Shatz, 1989; Ghosh et al., 1990), rats (Bayer and Altman, 1990) and hamsters (Miller et al., 1993; Woo and Finlay, 1996), and future studies are likely to be accomplished in mice?
Model species
Although horses, elk and lions were at one time “model species” for medical research (Logan, 2002), modern science has settled on some standard species. The chart in Figure 2 depicts a distribution used in neurodevelopmental research in articles published 2005–2006 in nine model mammals. The base of knowledge developed for each species itself quickly becomes a factor in the choice of which species to use, particularly if there is no convenient way to closely compare results between species.
FIGURE 2.
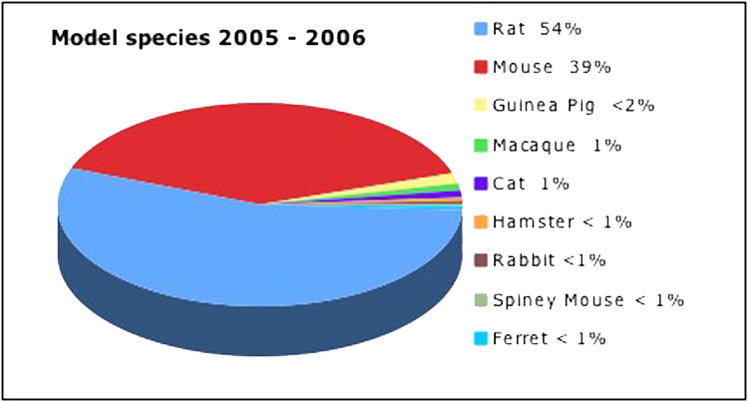
The chart depicts the proportion of recent studies performed in nine of the most commonly used species (2005– 2006 to date; Medline title search).
Each experimental species has its own advantages. Rodent dams have large litters that are easy to care for, generally disease-resistant, and have no agricultural uses. Rat pups are born after a short gestation (22.5 d), and have long been the general species of choice such that rat macro- and micro-neuroanatomy, neurophysiology, and assessments of behavior are well-mapped. Mice (gestation 19.5d) are currently considered most amenable to genetic manipulations, initially chosen because manipulations were clearly reflected in their physical appearance (Nishioka, 1995). Hamster pups (gestation 15.5d) are born earlier in their somatic development than other rodents so it is easier to study their early neurological development. These three species are considered altricial - born at relatively underdeveloped stages with eyes shut, and many neurogenic events occur postnatally.
Ferrets (gestation 42d) are also born early in development, but have larger brains, more comparable to humans. Cats, also with large brains, have visual systems that resemble humans, and are born at a somewhat later developmental point (gestation 65d). Rabbits (gestation 31d) were the initial species of choice for toxicology studies because the absence of tear ducts permits contaminant responses to develop quickly.
In contrast, guinea pigs (gestation 65 d) and spiny mice (gestation 40d) are “precocial” –close to independence at birth. Born with eyes open, guinea pigs even shed their baby teeth in utero, and are useful for studies of behavioral abilities that may develop without experience. Rhesus macaques, the leading laboratory primate species (gestation 165d ), are also considered precocial. Babies are born with eyes open and relatively advanced motoric abilities; they are most directly related to humans with (95% genome homology) (Rogers et al., 2006).
Researchers are thus required to assimilate a perplexing quantity of data collected at varying times across a wide developmental spectrum (Figure 3) and relate it to developing humans (gestation 280 d). The nature of human development further confuses any comparison with laboratory models. Human newborns, if classified by the immature development of their body and motoric skills, should be considered an altricial species, but the relatively advanced development of the human brain and many aspects of perceptual systems at birth clearly places human neural development in a precocial category (Clancy et al., 2000; Verley, 1977).
FIGURE 3.

The graph depicts the wide gestation range for mammalian species commonly used as experimental models and studied to satisfy a variety of scientific contingencies.
Moreover, a significant calibration problem is developing in the rodent literature. Although rats dominate, the recent surge of genomic studies in mice means they represent an increasing proportion of experimental studies (8 years ago, mice accounted for 23% of neurodevelopmental studies, currently they make up 39%). Length of gestation varies in these two rodent species (mice 19.5d, rats 22.5d), but are the 3 additional days mainly employed for rat brain development? Is the solution to cross-species translation between these two as simple as subtracting the difference in gestational ages or as overwhelming as repeating all the experiments done in rats again in mice?
The fact that researchers pick laboratory animal models based on diverse practical grounds arises from an assumption of generalizability across species (Logan, 2002). The conjunction of evolutionary and developmental biology shows that the timing and sequence of early events in brain development are remarkably conserved across mammals (Finlay and Darlington, 1995). In fact, the critical periods of prenatal and early postnatal development may be the ideal time in the life span to make the most accurate cross-species comparisons, because conversions become more variable in adult animals with widely different “life histories” (such as seasonal breeding, difficult habitats, etc.). A once promising “rate of living theory” suggested that the total number of heartbeats, breaths and matings are constrained across a lifetime i.e. the faster a species lived, the faster it would die. But although life span is not unrelated to metabolism (Economos, 1981), the rate of living theory remains controversial (Burns, 2004) and is generally discounted (Lints, 1989).
Below we review some of the ways the research community has attempted to equate brain development across members of the mammalian species, dividing these studies into 3 general categories 1) morphological comparisons, 2) “rules of thumb” based on susceptibility patterns and 3) event-based comparisons. We include our novel “neuroinformatics” technique to the latter approach (Clancy et al., 2000; Clancy et al., 2001; Clancy et al., 2006; Finlay and Darlington, 1995), based on three related strengths: 1) acquisition and integration of large databases of multiple data types, 2) analyses using standard multivariate techniques made simpler by increased computing power, and 3) public availability through Web-based interfaces. These tools allow us to make accurate predictions of cross species developmental sequences based on multiple events in multiple species.
Morphology based comparisons
Morphological comparisons are accomplished through a painstakingly detailed linking of the appearance of gross anatomical features in the embryos of different species.
Carnegie Stages
Over 50 years ago, George Streeter introduced a somatic “stage” approach to studies of human development based on work begun by Franklin Mall at the Carnegie Institution (O'Rahilly, 1979). O'Rahilly and colleagues further detailed the stages, adapting them to include brain development (O'Rahilly, 1979; O'Rahilly and Gardner, 1979; O'Rahilly et al., 1986). Across the first 60 days of human gestation, 23 distinct morphological “Carnegie” stages were identified based on averages of such features as number of somites, and embryonic length. These data were expanded into a table where stages can be equated across species, easily accessible on a web site (Butler and Juurlink, 1987) (http://embryology.med.unsw.edu.au/OtherEmb/CStages.htm). Here users can see, for example, that stage 12 is equivalent to 28 days post-conception (PC) in humans, PC 28 in rhesus monkeys, PC 10.5 in mice, and so on.
One drawback for morphological neurodevelopmental comparisons is that descriptions are based on the features in a “standard” embryo, and the statistical variability of the “standard” is unknown. Interestingly, the stage approach was not meant to be equated to days post-conception – indeed in any human study, ambiguity in the day of conception is a recurring problem. The uncertainty based on unknown conception dates is further compounded when normal development is disrupted for any reason (Mhaskar et al., 1989). Additionally, the stage approach is based on somatic morphology, and presumes that brain development is linearly predictable from somatic development, and that all parts of the brain develop at equivalent rates. It is increasingly clear, however, that neural development detaches from somatic development to occur at a different pace in different species, and that brain regions detach from each other, compounding systematic comparison errors between somatic and brain development (Clancy et al., 2000; Clancy et al., 2001; Verley, 1977).
Neuroanatomical comparisons
Bayer and colleagues produced comparative neuroanatomical studies by linking points in developing rat brain morphology to human brain morphology between rat embryonic days 11–21, which they find comparable to human embryonic weeks 4–16 (Bayer et al., 1993). These data are a striking match to the Carnegie stages, for example, PC12 in rats is similar to humans at 4–5.2 weeks. By overlapping the timetables of rat neurogenesis with the detailed rat /human comparisons, the authors were able to predict a number of neurogenesis events in human brain development. Neurogenesis data points are particularly valuable because such studies require invasive markers prior to sacrifice and thus cannot be accomplished in humans.
As with many other comparative studies, these beautifully detailed comparative data are limited to rat/human comparisons. Rodent/primate comparisons raise a question about the presumption of comparable rates of development across all regions of the brain. The premise that brain regions develop at similar rates across species does not take into account disparities in relative sizes of mature primate limbic and cortical regions which indicate that these regions develop on a somewhat different timetable in primates, as discussed below (Finlay et al., 2001; Finlay et al., 1998; West, 1990).
Rules of Thumb
Researchers searching for uncomplicated conversions attempt to apply “rules of thumb” (concepts similar to dog years) to neural development. It is estimated that the rat brain at postnatal days (PN) 1–10 equates to the 3rd trimester in humans, or that rat neurodevelopment at PN 7 is equivalent to that of the human brain at birth (Andrews and Fitzgerald, 1997; Dobbing and Sands, 1979). It is interesting to note that many of the studies upon which these approximations are based are decades old (Dobbing, 1972; Dobbing, 1974b; Dobbing and Sands, 1979), and some estimate neural development without direct empirical evidence (Dobbing, 1981; Dobbing and Smart, 1974).
Vulnerability patterns and growth spurts
John Dobbing sought to address the effects of nutrition on brain growth in human infants (Dobbing, 1970), introducing the studies that underlie “rules of thumb” in the 1970s. He expanded on interspecies comparisons of brain growth (Donaldson, 1918), neural-related enzymes (Farooqui and Bachhawat, 1971) and ganglioside concentrations (glycolipids used as an indirect measure of white matter)(Vanier et al., 1971). Dobbing identified growth spurts using DNA to estimate cell numbers, and cholesterol levels to approximate the degree of myelination (Dobbing, 1970), later including brain weights and water content (Dobbing, 1981). Sands and Dobbing produced comparative velocity curves for timing vulnerability periods that occur during growth spurts (Dobbing, 1974b; Dobbing and Sands, 1979; Dobbing and Smart, 1974). Although resulting rules of thumb are conventionally restricted to rat-to-human comparisons, other species were included in the early studies – sheep, pigs, guinea pigs, rats, rabbits, monkeys, and humans. But the overall consensus became that the brain growth spurt occurring at birth in humans is centered around 1 week postnatal in rats, leading to the notion that the last trimester of human gestation corresponds to PN 1–10 in rats.
This timing correspondence, although somewhat vague, continues to be used because it continues to be supported. A more recent study on the neurotransmitter GABA (gamma-Aminobutyric Acid) refines this time period, suggesting that PN 2–7 in rat corresponds to the human third trimester, and translating the human day of birth to rat PN 12–13 (Romijn et al., 1991).
Dobbing’s careful studies (Dobbing, 1974a; Dobbing, 1974b; Dobbing and Sands, 1973; Dobbing and Sands, 1979) emphasize unavoidable problems associated with human timetables. Undocumented dates of conception must be used, post mortem intervals and tissue preservation may vary considerably, and samples are limited to ages available through donations. Moreover, the presumption of “normal” is made, even though some tissue is necessarily obtained from aborted fetuses and from infants who die following a variety of circumstances.
Evolutionary Event-Based Comparisons
A recent review summarizes some major neural events that occur across development of the human central nervous system (de Graaf-Peters and Hadders-Algra, 2006). Included are general timing windows for onset and offset of cell proliferation, synapse formation, and development of neurotransmitter systems, beginning with the 5th week of gestation. Although the authors make no attempt to directly translate development across species, this study is an example of the manner with which the conservation of developmental sequences across species is presumed – the human study simply makes use of non-human data to “fill in” gaps. This assumption is possible because close similarities in the manner in which mammalian brains develop are well documented (Finlay and Darlington, 1995; Finlay et al., 2001; Finlay et al., 1998; Striedter, 1999; Striedter, 2005) and, when properly considered, can be used to equate developmental time across mammalian species with confidence (Clancy, 2006; Clancy et al., 2000; Clancy et al., 2001; Clancy et al., 2006; Verley, 1977).
Some studies have been directly prompted by evolution-based questions. For example, in order to understand what might have changed across evolving species to account for correspondences and variability in brain regions, the timing of common neural events is plotted and analyzed for similarities and differences.
Anchor Events
Robinson and Dreher identified timetables in the development of the visual system in cats, ferrets, hamsters, macaques, mice, rabbits, and rats during the “caecal period” (Dreher and Robinson, 1988; Robinson and Dreher, 1990). Conception and eye-opening are used as anchor events and the timing of individual visual events is expressed as a proportion of the period between these anchors. Many consistencies were identified. For example, in five mammals for which data on subplate neurogenesis were available, it reliably occurs between 32% and 39% of the overall period. Although the goal was to compare development of the visual system of birds with mammals, or eutherians (placental mammals) with metatheraians (marsupials), the authors suggest this approach might be useful for predictive purposes.
Similarly, Ashwell and colleagues compared the timing of pathway development in metatheraians and eutherians using conception and weaning as anchor events (Ashwell et al., 1996). They further subdivide mammals into “r” subsets (large litters, rodents) and “k” subsets (few offspring, primates) and compare 13 pathway milestones (e.g. appearance of anterior commissure). Despite the fact that weaning is variable across species (Clancy et al., 2000), these studies also offer strong evidence for common developmental sequences. Additionally, they suggest a possible variation in primate development, although no comparative or predictive applications are offered.
Neuroinformatics approach
The essential difference between a neuroinformatics approach and all previous approaches is that data from many mammalian species, including humans, are integrated into a single statistical model specifically designed to compare and test for correspondences, adjust for differences, and predict the dates of neural development (Clancy et al., 2000; Clancy et al., 2001; Clancy et al., 2006; Darlington et al., 1999; Finlay and Darlington, 1995; Finlay et al., 2001). These data are presented on an interactive web site that allows the user to access comparative and predictive brain development data and convert it across included species in real time (Clancy et al., 2006), at the Web address http://www.translatingtime.net/. This approach is novel and we describe it in some detail below, although use of the web site does not require a full understanding of all of the specifics.
The model includes data from 10 species (hamsters, mice, rats, rabbits, spiny mice, guinea pigs, ferrets, cats, macaques, and humans) for 102 neurodevelopmental events, although no event has been studied in all 10 species. The number of species studied for an event ranges from 1 to 8 with an average of 3.9. Altogether, there are 397 observations out of the 1020 possible events (10 species X 102 events). Only 15 of the 102 events have been studied in humans, whereas 91 have been studied in rats. The data set itself is described in detail in previous studies (Clancy et al., 2000; Clancy et al., 2001; Clancy et al., 2006).
Qualitatively, the integration of these data allowed the discovery of general principles of neurodevelopmental timing that would not be apparent in smaller data sets. Four principles have been identified to date.
Because time-based data often occur in exponential distributions, the most accurate translations of dates between species are performed by expressing dates on a logarithmic scale. It is not accurate to translate between species by simply multiplying with a constant, as in “dog years”.
The best zero for the logarithmic scale is not the day of conception, but 4.34. Although this value was determined mathematically, it corresponds to observations that early events (blastulation, differentiation of germinal layers) take approximately the same amount of time in the mammals in this study.
For most events in neural development the difference in dates between two events is constant across species on this logarithmic scale. If two events are separated by 0.8 units on this developmental time scale for rats, the same will be true for other mammalian species.
Two exceptions have been identified, both illustrating important evolutionary alterations in brain development in primates. Events in primate cortex occur later than expected, while events in primate limbic systems occur earlier. One can adjust for this simply by adding 0.2487 on the logarithmic scale to primate cortical events, and subtracting 0.0793 for limbic events.
Two scales are generated by this statistical model. In the first, the 10 species are mathematically ranked, with fast-developing species having low scores and slow-developing species having high scores. The second scale ranks neurodevelopmental events, with early events having low scores and later events having high scores. These 112 values (that is, 10 + 102), from the species and neurodevelopment structure scales are derived simultaneously using linear regression, to best match the 397 observed data points. Once scale values are derived, one can calculate the timing of any of these events in any of these species by solving the regression equation, using the species and structure values, and making a cortical or limbic adjustment if necessary. The formula, which the web site (http://www.translatingtime.net/) has been designed to apply, is:
The 102 x 10 values are not all estimated with equal precision. Each has a standard error related to the number of species and events for which empirical data are available. The smallest standard error is for eye-opening in rats because eye-opening is the event measured in most species, and the highest number of events is measured in rats. (Confidence limits are included at the web site.)
The model may be most useful for predicting the 623 species-event combinations for which no empirical observations are available, but can also refine the 397 observations that have been reported in the literature. Observations from individual species are subject to experimental error and individual subjects may be few in number and may not be typical of their species. As noted above, these problems are especially acute for human observations, exactly the species of greatest interest. However, for any datum measured multiple times, random errors average out, making it plausible that estimates made based on multiple species may be more accurate than the published observations of the same event in a single species, especially for humans.
Usefulness of the neuroinformatics approach
The web-based database is designed to easily produce comparisons of interest without the necessity of determining how values of interest fit into the multiple regression equation. For example, we can easily predict that in humans, the peak of neurogenesis of the first neurons destined for the cortex (subplate) occurs at approximately PC 54. The timing of this event can then be translated to hamsters (PC 10.6), mice (PC 10.9), rats (PC 12.2), cats (PC 23.9) and macaques (PC 43).
The model adjusts for limbic and cortical events in primate brain regions because they develop earlier (limbic) and later (cortical), although sequences within each region are retained. Subplate development is considered a cortical event, but the web site will also report PC 54 in human cortical development corresponds to PC 40.5 in human limbic regions and PC 43.5 in human non-cortical, non-limbic regions (Figure 4). When making translations between any two species, the model also predicts the dates for all 102 events contained in the database for both species of interest.
FIGURE 4.
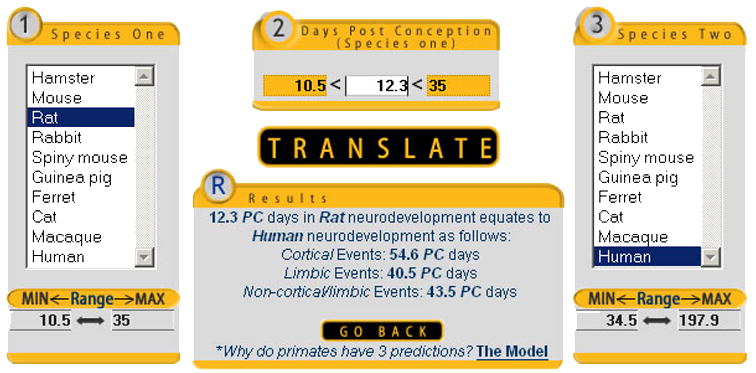
A neuroinformatics approach can be used to relate neurodevelopment across species. The model predicts that the peak of subplate neurogenesis occurs in rat development at 12.3 days post conception (PC), which translates into PC 54.6 in human cortical development, PC 40.5 in human limbic system development, and PC 43.5 for non- cortical, non-limbic neural events.
Exceptions and Limitations
Our neuroinformatics approach permits identification of developmental events that do not fit the model, including some that mathematical adjustments cannot correct. Two such events are birth and weaning (Clancy et al., 2000; Finlay and Darlington, 1995). Both occur at widely varying stages of brain development (Dobbing and Sands, 1979), further indicating that variability in cross-species studies based on either event might be expected. Another event that does not fit the model is a coordinated surge in synaptogenesis, an event apparently linked just prior to an onslaught of experience. This phenomenon begins just prior to birth in primates and just prior to exit from the nest in rats (Bates et al., 2002; Blue and Parnavelas, 1983; Huttenlocher and Dabholkar, 1997; Rakic et al., 1986; Zecevic and Rakic, 1991). A similar link to birth is found in some respiratory, cardiovascular and digestive functions, linked to the demands of extrauterine survival.
The current model has some limitations, including the requirement for distinct data points. Thus, increasing complexities in postnatal development as brains mature and are subject to activity-dependent modification become problematic. Therefore, the database now ends at eye opening. It is possible that indirect measurements of neural development might be modeled using functional behavior that matures across development such as cognitive behavior or motor reflexes. Both optimism and caution in this type of approach are inspired by a comparison of postnatal behavior in dogs, macaques, and humans by Wood and colleagues (Wood et al., 2003).
Whatever the approach used, solutions to the problem of cross-species comparisons are clearly required. Relating studies done in various species first to each other and then to human brain development is essential for further investigations in developmental neurotoxicology, neuroscience, pediatric neurology, and in understanding the developmental origins of subsequent adult behaviors and disorders. We greatly favor a bioinformatics approach.
Acknowledgments
Supported by NIH Grant # P20 RR-16460 from the IDeA Networks of Biomedical Research Excellence (INBRE) Program of the National Center for Research Resources and NIH Grant # U10 HD-500009 from the National Institute for Child Health and Human Development. The authors wish to thank James Hyde, James Fulmer and Brandon Kersh for photography expertise and figure production. Special thanks are extended to Jim, Elizabeth and Fiona Murray for the human infant photographs in Figure 1.
Footnotes
Publisher's Disclaimer: This is a PDF file of an unedited manuscript that has been accepted for publication. As a service to our customers we are providing this early version of the manuscript. The manuscript will undergo copyediting, typesetting, and review of the resulting proof before it is published in its final citable form. Please note that during the production process errors may be discovered which could affect the content, and all legal disclaimers that apply to the journal pertain.
Contributor Information
Dr. Barbara Clancy, University of Central Arkansas/ University of Arkansas for Medical Sciences Conway, AR UNITED STATES barbaraclancy@mac.com
Barbara L Finlay, Cornell University, blf2@cornell.edu.
Richard B Darlington, Cornell University, rbd1@cornell.edu.
KJS Anand, University of Arkansas for Medical Sciences, AnandSunny@uams.edu.
References
- Andrews K, Fitzgerald M. Biological barriers to paediatric pain management. Clin J Pain. 1997;13(2):138–143. doi: 10.1097/00002508-199706000-00007. [DOI] [PubMed] [Google Scholar]
- Ashwell KW, Waite PM, Marotte L. Ontogeny of the projection tracts and commissural fibres in the forebrain of the tammar wallaby (Macropus eugenii): timing in comparison with other mammals. Brain Behav Evol. 1996;47(1):8–22. doi: 10.1159/000113225. [DOI] [PubMed] [Google Scholar]
- Bates E, Thal D, Finlay B, Clancy B. Early language development and its neural correlates. In: Rapin I, Segalowitz S, editors. Handbook of Neuropsychology Child Neurology. 2. Amsterdam: Elsevier; 2002. [Google Scholar]
- Bayer SA, Altman J. Development of layer I and the subplate in the rat neocortex. Exp Neurol. 1990;107(1):48–62. doi: 10.1016/0014-4886(90)90062-w. [DOI] [PubMed] [Google Scholar]
- Bayer SA, Altman J, Russo RJ, Zhang X. Timetables of neurogenesis in the human brain based on experimentally determined patterns in the rat. Neurotoxicology. 1993;14(1):83–144. [PubMed] [Google Scholar]
- Blue ME, Parnavelas JG. The formation and maturation of synapses in the visual cortex of the rat. I. Qualitative analysis. J Neurocytol. 1983;12(4):599–616. doi: 10.1007/BF01181526. [DOI] [PubMed] [Google Scholar]
- Burns JK. An evolutionary theory of schizophrenia: cortical connectivity, metarepresentation, and the social brain. Behav Brain Sci. 2004;27(6):831–855. doi: 10.1017/s0140525x04000196. discussion 855–885. [DOI] [PubMed] [Google Scholar]
- Butler H, Juurlink BHJ. An atlas for staging mammalian and chick embryos. Boca Raton, Fla: CRC Press; 1987. p. vi.p. 218. [Google Scholar]
- Chun JJ, Shatz CJ. The earliest-generated neurons of the cat cerebral cortex: characterization by MAP2 and neurotransmitter immunohistochemistry during fetal life. J Neurosci. 1989;9(5):1648–1667. doi: 10.1523/JNEUROSCI.09-05-01648.1989. [DOI] [PMC free article] [PubMed] [Google Scholar]
- Clancy B. Practical use of evolutionary neuroscience pronciples. Behavioral and Brain Sciences. 2006;29:14–15. [Google Scholar]
- Clancy B, Darlington RB, Finlay BL. The course of human events: predicting the timing of primate neural development. Developmental Science. 2000;3:57–66. [Google Scholar]
- Clancy B, Darlington RB, Finlay BL. Translating developmental time across mammalian species. Neuroscience. 2001;105(1):7–17. doi: 10.1016/s0306-4522(01)00171-3. [DOI] [PubMed] [Google Scholar]
- Clancy B, Kersh B, Hyde J, Darlington RB, Anand KJS, Finlay BL. Web-Based Method For Translating Neurodevelopment From Laboratory Species To Humans Neuroinformatics. 2006 doi: 10.1385/ni:5:1:79. (in press) [DOI] [PubMed] [Google Scholar]
- Darlington RB, Dunlop SA, Finlay BL. Neural development in metatherian and eutherian mammals: variation and constraint. J Comp Neurol. 1999;411(3):359–368. [PubMed] [Google Scholar]
- de Graaf-Peters VB, Hadders-Algra M. Ontogeny of the human central nervous system: what is happening when? Early Hum Dev. 2006;82(4):257–266. doi: 10.1016/j.earlhumdev.2005.10.013. [DOI] [PubMed] [Google Scholar]
- Dobbing J. Undernutrition and the developing brain. The relevance of animal models to the human problem. Amer J Dis Child. 1970;120:411–415. doi: 10.1001/archpedi.1970.02100100075005. [DOI] [PubMed] [Google Scholar]
- Dobbing J. Undernutrition and the developing brain. The relevance of animal models to the human problem. Bibl Nutr Dieta. 1972;(17):35–46. [PubMed] [Google Scholar]
- Dobbing J. The Later Development of the Brain and Its Vulnerability. In: Davis JA, Dobbing J, editors. Scientific foundations of paediatrics. London: Heinemann Medical Books Ltd; 1974a. p. xvi.p. 836. [Google Scholar]
- Dobbing J. The later growth of the brain and its vulnerability. Pediatrics. 1974b;53(1):2–6. [PubMed] [Google Scholar]
- Dobbing J. The later development of the brain and its vulnerability. In: Davis JA, Dobbing J, editors. Scientific Foundations of Paediatrics. Baltimore: University Park Press; 1981. pp. 744–748. [Google Scholar]
- Dobbing J, Sands J. Quantitative growth and development of human brain. Arch Dis Child. 1973;48(10):757–767. doi: 10.1136/adc.48.10.757. [DOI] [PMC free article] [PubMed] [Google Scholar]
- Dobbing J, Sands J. Comparative aspects of the brain growth spurt. Early Hum Dev. 1979;3(1):79–83. doi: 10.1016/0378-3782(79)90022-7. [DOI] [PubMed] [Google Scholar]
- Dobbing J, Smart JL. Vulnerability of developing brain and behaviour. Br Med Bull. 1974;30(2):164–168. doi: 10.1093/oxfordjournals.bmb.a071188. [DOI] [PubMed] [Google Scholar]
- Donaldson HH. A Comparison of Growth Changes in the Nervous System of the Rat with Corresponding Changes in the Nervous System of Man. Proc Natl Acad Sci U S A. 1918;4(9):280–283. doi: 10.1073/pnas.4.9.280. [DOI] [PMC free article] [PubMed] [Google Scholar]
- Dreher B, Robinson SR. Development of the retinofugal pathway in birds and mammals: evidence for a common 'timetable'. Brain Behav Evol. 1988;31(6):369–390. doi: 10.1159/000116602. [DOI] [PubMed] [Google Scholar]
- Economos AC. Beyond rate of living. Gerontology. 1981;27(5):258–265. doi: 10.1159/000212481. [DOI] [PubMed] [Google Scholar]
- Farooqui AA, Bachhawat BK. The regional distribution, age dependent variation and species differences of brain arylsulphatases. J Neurochem. 1971;18(4):635–646. doi: 10.1111/j.1471-4159.1971.tb11994.x. [DOI] [PubMed] [Google Scholar]
- Finlay BL, Darlington RB. Linked regularities in the development and evolution of mammalian brains. Science. 1995;268(5217):1578–1584. doi: 10.1126/science.7777856. [DOI] [PubMed] [Google Scholar]
- Finlay BL, Darlington RB, Nicastro N. Developmental structure in brain evolution. Behavioral and Brain Sciences. 2001;24:263–307. [PubMed] [Google Scholar]
- Finlay BL, Hersman MN, Darlington RB. Patterns of vertebrate neurogenesis and the paths of vertebrate evolution. Brain Behav Evol. 1998;52(4–5):232–242. doi: 10.1159/000006566. [DOI] [PubMed] [Google Scholar]
- Ghosh A, Antonini A, McConnell SK, Shatz CJ. Requirement for subplate neurons in the formation of thalamocortical connections. Nature. 1990;347(6289):179–181. doi: 10.1038/347179a0. [DOI] [PubMed] [Google Scholar]
- Huttenlocher PR, Dabholkar AS. Regional differences in synaptogenesis in human cerebral cortex. J Comp Neurol. 1997;387(2):167–178. doi: 10.1002/(sici)1096-9861(19971020)387:2<167::aid-cne1>3.0.co;2-z. [DOI] [PubMed] [Google Scholar]
- Kostovic I, Rakic P. Cytology and time of origin of interstitial neurons in the white matter in infant and adult human and monkey telencephalon. J Neurocytol. 1980;9(2):219–242. doi: 10.1007/BF01205159. [DOI] [PubMed] [Google Scholar]
- Lints FA. The rate of living theory revisited. Gerontology. 1989;35(1):36–57. doi: 10.1159/000212998. [DOI] [PubMed] [Google Scholar]
- Logan CA. Before there were standards: the role of test animals in the production of empirical generality in physiology. J Hist Biol. 2002;35(2):329–363. doi: 10.1023/a:1016036223348. [DOI] [PubMed] [Google Scholar]
- Mhaskar R, Agarwal N, Takkar D, Buckshee K, Anandalakshmi Deorari A. Fetal foot length--a new parameter for assessment of gestational age. Int J Gynaecol Obstet. 1989;29(1):35–38. doi: 10.1016/0020-7292(89)90126-4. [DOI] [PubMed] [Google Scholar]
- Miller B, Chou L, Finlay BL. The early development of thalamocortical and corticothalamic projections. J Comp Neurol. 1993;335(1):16–41. doi: 10.1002/cne.903350103. [DOI] [PubMed] [Google Scholar]
- Nishioka Y. The origin of common laboratory mice. Genome. 1995;38(1):1–7. doi: 10.1139/g95-001. [DOI] [PubMed] [Google Scholar]
- O'Rahilly R. Early human development and the chief sources of information on staged human embryos. Eur J Obstet Gynecol Reprod Biol. 1979;9(4):273–280. doi: 10.1016/0028-2243(79)90068-6. [DOI] [PubMed] [Google Scholar]
- O'Rahilly R, Gardner E. The initial development of the human brain. Acta Anat (Basel) 1979;104(2):123–133. doi: 10.1159/000145061. [DOI] [PubMed] [Google Scholar]
- O'Rahilly R, Muller F, Bossy J. Atlas of the stages of development of the external forms of the brain in the human embryo. Arch Anat Histol Embryol. 1986;69:3–39. [PubMed] [Google Scholar]
- Rakic P, Bourgeois JP, Eckenhoff MF, Zecevic N, Goldman-Rakic PS. Concurrent overproduction of synapses in diverse regions of the primate cerebral cortex. Science. 1986;232(4747):232–235. doi: 10.1126/science.3952506. [DOI] [PubMed] [Google Scholar]
- Robinson SR, Dreher B. The visual pathways of eutherian mammals and marsupials develop according to a common timetable. Brain Behav Evol. 1990;36(4):177–195. doi: 10.1159/000115306. [DOI] [PubMed] [Google Scholar]
- Rogers J, Garcia R, Shelledy W, Kaplan J, Arya A, Johnson Z, Bergstrom M, Novakowski L, Nair P, Vinson A, Newman D, Heckman G, Cameron J. An initial genetic linkage map of the rhesus macaque (Macaca mulatta) genome using human microsatellite loci. Genomics. 2006;87(1):30–38. doi: 10.1016/j.ygeno.2005.10.004. [DOI] [PubMed] [Google Scholar]
- Romijn HJ, Hofman MA, Gramsbergen A. At what age is the developing cerebral cortex of the rat comparable to that of the full-term newborn human baby? Early Hum Dev. 1991;26(1):61–67. doi: 10.1016/0378-3782(91)90044-4. [DOI] [PubMed] [Google Scholar]
- Striedter GF. Homology in the nervous system: of characters, embryology and levels of analysis. Novartis Found Symp. 1999;222:158–170. doi: 10.1002/9780470515655.ch11. discussion 170–152. [DOI] [PubMed] [Google Scholar]
- Striedter GF. Principles of brain evolution. Sunderland, Mass: Sinauer Associates; 2005. p. xii.p. 436. [Google Scholar]
- Vanier MT, Holm M, Ohman R, Svennerholm L. Developmental profiles of gangliosides in human and rat brain. J Neurochem. 1971;18(4):581–592. doi: 10.1111/j.1471-4159.1971.tb11988.x. [DOI] [PubMed] [Google Scholar]
- Verley R. Comparative development of the mammalian nervous system. Rev Electroencephalogr Neurophysiol Clin. 1977;7(3):245–254. doi: 10.1016/s0370-4475(77)80001-4. (author's transl) [DOI] [PubMed] [Google Scholar]
- West MJ. Stereological studies of the hippocampus: a comparison of the hippocampal subdivisions of diverse species including hedgehogs, laboratory rodents, wild mice and men. Prog Brain Res. 1990;83:13–36. doi: 10.1016/s0079-6123(08)61238-8. [DOI] [PubMed] [Google Scholar]
- Woo TU, Finlay BL. Cortical target depletion and ingrowth of geniculocortical axons: implications for cortical specification. Cereb Cortex. 1996;6(3):457–469. doi: 10.1093/cercor/6.3.457. [DOI] [PubMed] [Google Scholar]
- Wood SL, Beyer BK, Cappon GD. Species comparison of postnatal CNS development: functional measures. Birth Defects Res B Dev Reprod Toxicol. 2003;68(5):391–407. doi: 10.1002/bdrb.10037. [DOI] [PubMed] [Google Scholar]
- Zecevic N, Rakic P. Synaptogenesis in monkey somatosensory cortex. Cereb Cortex. 1991;1(6):510–523. doi: 10.1093/cercor/1.6.510. [DOI] [PubMed] [Google Scholar]