

Abstract
When using fMRI to study age-related cognitive changes, it is important to establish the integrity of the hemodynamic response because, potentially, it can be affected by age and disease. However, there have been few attempts to document such integrity and no attempts using higher cognitive rather than perceptual or motor tasks. We used fMRI with 28 healthy young and older adults on an inhibitory control task. Although older and young adults differed in task performance and activation patterns, they had comparable hemodynamic responses. We conclude that activation during cognitive inhibition, which was predominantly increased in elders, was not due to vascular confounds or specific changes in hemodynamic coupling.
Keywords: Aging, Cognition, Event-related fMRI, Inhibition, Hemodynamic coupling, Recruitment
INTRODUCTION
Cognitive neuroscience research, which focuses on revealing brain–behavior relationships, is most recently being applied toward understanding age-related declines in cognitive abilities such as memory and attention. The extant neuroimaging literature on cognitive aging thus far is small but growing rapidly. Indeed, although there are some inconsistencies, a common finding is that older adults activate more regions of the brain during tasks than do young adults, a finding that is often called recruitment [1–5].
One drawback to the use of fMRI to study aging-related cognitive issues is that because the underlying physiological principle on which fMRI is based is hemodynamic coupling to neuronal activity [6], generalized cerebrovascular changes associated with aging could alter one or more parameters of the hemodynamic response. Indeed, studies evaluating visual cortex response to passive stimulation reported decreased fMRI signal amplitude in older adults [7,8], which was suggested could be due to an age-related alteration in functional activity or hemodynamic coupling [8]. Motor cortex response to a 10 s hand squeezing task also showed altered rise but not fall time in elders, suggesting slowed signal due to vascular changes [9]. These findings are particularly important in light of other reports that older adults have somewhat noisier signals (i.e. greater variability) than young adults, which could confound interpretation whenever elders exhibit reduced activation relative to young [7,10]. Importantly, purely sensory or motor tasks, for which older adults have less acuity and ability [11], could reduce detectable signal magnitude, which could be exacerbated by increased variability in the signals of older participants [12–14]. Without some correction for differential performance in the groups, the meaningfulness of the result is unclear and the issue of hemodynamic integrity remains unresolved. A sensorimotor response task recently showed marked amplitude reductions in elders in visual cortex, but comparable signals to young in other regions and when overall relative activation changes were measured [15]. However, no studies have examined whether there are age-related differences in hemodynamic response properties during cognitive tasks or under comparable performance conditions.
We therefore used event-related fMRI to evaluate hemodynamic response parameters in 28 healthy participants, 14 older and 14 young adults during an inhibition (go/no-go) task. The data are a subset of those used in a previous study [5]. Only accurately performed trials were included for analysis, essentially equating the participant groups for task performance. Each response parameter was computed for all active brain voxels of successful trials for each participant and then averaged across the clusters of interest. Healthy older and young adults were expected to exhibit comparable hemodynamic response parameters.
MATERIALS AND METHODS
Participants
Fourteen young adults (8 males, 6 females) aged 19–44 (mean (± s.d.) 29.7±8.3) years and 14 older adults (6 males, 8 females) age 60–77 (mean 71.1±4.3) years participated in the study. All older adults had Mini-Mental State Examination [16] scores > 26 (28.6±1.5) and Geriatric Depression Scale [17] scores < 10 (2.5±2.3). All participants were right-handed, highly educated (young 15.7±1.6 years; old 18.2±2.0 years), and free of medications and major medical, neurological, and psychological problems at the time of testing. The Internal Review Board approved all procedures and written informed consent was obtained prior to testing.
Task
The go/no-go inhibition task is described in detail elsewhere [5,18]. It presented a serial stream of letters, one each 500 ms with a 0 ms interstimulus interval, with intermittent semi-random targets requiring response (average every 3.5 s; 150 total) and lures (response to be inhibited) quasi-randomly and rarely (> 15 s inter-lure interval; 25 total).
Neuroimaging
Whole-brain fMRI imaging was conducted on a 1.5 T G E Sigma scanner with a 30.5 cm i.d. 3-axis local gradient coil and an endcapped quadrature birdcage radio-frequency head-coil [19], 7 mm contiguous sagittal slices, a blipped gradient echo-planar pulse sequence (TE 40 ms; TR 2000 ms; FOV 24 cm; 64 × 64 matrix; 3.75 × 3.75 mm in-plane resolution), and spoiled GRASS anatomic images for anatomical localization [20]. Analysis was performed with AFNI v. 2.2 [21]. Functional images were modelled with a γ-variate function using non-linear regression (NLR) optimization [5,18]. The model, y=ktre− t/b, allowed the scaling parameter, k, to vary freely, constrained onset time (t or t0) to within 4 s of lure events, and constrained the exponential parameters, r (largely representing rise time) and b (largely representing fall time), to a range similar to previously published estimate [22]: 8 ≤ r ≤ 9, 0.15 ≤ b ≤ 0.45. Parameters and derived quantities, such as response magnitude, computed as percentage area under the curve (AUC), were smoothed (4.2 mm full-width-at-half-maximum isotropic Gaussian filter) and stereotaxically normalized prior to group analyses. Separate, voxel-wise, one-sample t-tests were then performed for old and young groups against the null hypothesis, using %AUC and a cluster criterion of 100 mm3 of contiguous, significant voxels. A Monte-Carlo randomization procedure established a false-positive statistical threshold for clusters or regions of interest (ROIs), accounting for multiple comparisons (t=4.22; p < 0.001) [5]. These clusters were then combined and compared between groups by t-test (p < 0.01 criterion) [5].
Hemodynamic parameter analysis
The four parameters (t0, k, r, b) were each averaged across all voxels of each significant cluster for each subject, followed by t-tests between groups for each averaged cluster parameter value (p < 0.01 criterion). The large number of comparisons increased the false positive likelihood, but this risk was deemed acceptable because of the hypothesis of no differences. A second analysis with less type I error risk, averaging the parameters across the ten largest clusters, was also used.
RESULTS
Behavioral data
Overall, participants in both groups performed well on the task (older, 98.1±1.2%; younger, 99.1±1.7%; t(26)=1.8, p > 0.05). However, older adults were slower to respond to targets (505.4±58.6 ms vs 459.6±46.0 ms; t(26)=− 2.3, p < 0.03) and had fewer successful inhibitions (older 79.1±14.8%, younger 92.6±4.1%; t(26)=3.3, p < 0.01). This finding is consistent with the larger data set from which the current data were taken [5].
fMRI data
The activated clusters and their group differences are presented in Table 1. There were no significant group differences in right prefrontal clusters, but several left hemisphere clusters, particularly in the prefrontal cortex, were significantly more active in older participants, a finding consistent with that found with the larger dataset already published [5]. Young adults demonstrated greater activation than older adults in only two clusters: right postcentral gyrus and left fusiform gyrus.
Table 1.
Clusters of statistically significant (p < 0.001) contiguous activation associated with response inhibition in either the young or older group shown with group differences and average hemodynamic response parameters.
| Side | Lobe | BA | Vol (μl) | X | Y | Z | t | Young
|
Older
|
||||||
|---|---|---|---|---|---|---|---|---|---|---|---|---|---|---|---|
| r | b | t0 | k | r | b | t0 | k | ||||||||
| Right | Frontal | 10 | 460 | 39 | 51 | 1 | − 2.6 | 6.82 | 0.156 | 0.752 | 298.7 | 5.66 | 0.151 | 0.630 | 650.6 |
| 10/46 | 206 | 42 | 40 | − 1 | 1.0 | 7.69 | 0.198 | 0.825 | 717.2 | 7.93 | 0.197 | 0.838 | 350.5 | ||
| 8/9/46 | 3664 | 37 | 26 | 31 | 0.96 | 8.09 | 0.186 | 0.955 | 752.7 | 7.99 | 0.187 | 0.918 | 579.9 | ||
| 6 | 725 | 30 | − 5 | 57 | − 1.3 | 8.27 | 0.192 | 0.953 | 246.3 | 7.98 | 0.188 | 0.868 | 668.4 | ||
| 6 | 353 | 32 | 4 | 38 | 0.30 | 8.39 | 0.191 | 0.932 | 533.8 | 8.33 | 0.188 | 0.882 | 569.9 | ||
| 10 | 103 | 22 | 52 | 19 | − 1.5 | 8.29 | 0.192 | 1.03 | 611.0 | 7.49 | 0.191 | 0.918 | 602.2 | ||
| 6 | 335 | 30 | 15 | 52 | − 1.4 | 7.85 | 0.186 | 0.900 | 440.5 | 7.39 | 0.181 | 0.892 | 412.5 | ||
| 6 | 136 | 50 | 1 | 32 | − 1.5 | 8.23 | 0.189 | 0.922 | 287.2 | 8.31 | 0.190 | 0.963 | 803.9 | ||
| 13 | 1524 | 39 | 14 | 3 | 1.5 | 8.04 | 0.19 | 0.917 | 856.6 | 8.23 | 0.191 | 0 .843 | 573.3 | ||
| Parietal | 40/7 | 4597 | 42 | − 51 | 41 | − .15 | 7.91 | 0.186 | 0.917 | 611.5 | 7.82 | 0.185 | 0.852 | 618.1 | |
| 31/7 | 438 | 1 | − 54 | 33 | − 3.3* | 8.43 | 0.195 | 0.921 | − 127.1* | 8.33 | 0.191 | 0.940 | 660.7* | ||
| 19 | 301 | 41 | − 69 | 39 | − 1.8 | 6.57 | 0.150 | 0.753 | 96.9 | 5.73 | 0.146 | 0.626 | 711.2 | ||
| 5 | 142 | 55 | − 13 | 23 | 2.8* | 8.06 | 0.186 | 0.992 | 556.2 | 8.38 | 0.190 | 1.01 | 406.9 | ||
| Occipital | 18 | 646 | 39 | − 77 | 0 | 1.5 | 7.61 | 0.179 | 0.952 | 571.6 | 7.28 | 0.166 | 0.753 | 430.7 | |
| Temporal | 19 | 106 | 40 | − 68 | − 13 | − .48 | 8.11 | 0.190 | 0.894 | 314.8 | 6.37 | 0.160 | 0.803 | 659.1 | |
| 22/39 | 517 | 44 | − 42 | 3 | − 2.0 | 8.38 | 0.193 | 1.03 | 280.4 | 8.32 | 0.188 | 1.01 | 483.7 | ||
| DMT | 470 | 8 | − 16 | 8 | − 3.6† | 8.42* | 0.197 | 0.959 | 321.9* | 8.29* | 0.198 | 0 .877 | 920.0 * | ||
| VAT | 145 | 11 | − 6 | 7 | 0.34 | 8.37 | 0.193 | 1.01 | 453.2 | 8.35 | 0.189 | 0.949 | 444.5 | ||
| Left | Frontal | 44/6/4/6/9 | 5073 | − 43 | 9 | 31 | − 6.1† | 8.18 | 0.191 | 0 .923 | 233.6 | 7.92 | 0.186 | 0.837 | 635.0 |
| 6 | 206 | − 4 | − 6 | 49 | − 1.9 | 8.40 | 0.178 | 1.01 | 42.7 | 8.36 | 0.186 | 0.889 | 449.7 | ||
| 6 | 359 | − 33 | − 1 | 55 | − 1.4 | 8.23 | 0.191 | 1.05 | 403.9 | 7.45 | 0.187 | 0.881 | 543.4 | ||
| 6/4 | 1135 | − 16 | − 2 | 58 | − 2.1 | 8.38 | 0.195 | 1.01 | 189.1 | 8.29 | 0.192 | 0.93 | 484.1 | ||
| 6 | 136 | − 28 | − 15 | 59 | − 2.1 | 8.37 | 0.196 | 0.978 | 48.6 | 8.29 | 0.192 | 1.03 | 305.0 | ||
| 6 | 325 | − 7 | 16 | 62 | − 5.3† | 8.04* | 0.191 | 0 .960 | − 314.2* | 5.95* | 0.164 | 0.738 | 470.4* | ||
| 6 | 112 | − 5 | 28 | 55 | − 2.5 | 8.29 | 0.196 | 1.01 | 257.8 | 6.33 | 0.171 | 0.717 | 474.5 | ||
| 4 | 157 | − 17 | − 26 | 58 | − 3.1* | 8.38 | 0.193 | 0.986 | − 251.3† | 8.32 | 0.189 | 0.910 | 519.1† | ||
| 13 | 241 | − 32 | 12 | 8 | − 2.4 | 8.37 | 0.194 | 0.984 | 224.3 | 8.32 | 0.188 | 0.875 | 749.0 | ||
| Limbic | 32 | 1458 | − 1 | 17 | 42 | − .05 | 8.37 | 0.195 | 0.973 | 672.0 | 8.34 | 0.195 | 0.857 | 585.8 | |
| Parietal | 19 | 261 | − 25 | − 67 | 35 | 1.2 | 8.39 | 0.197 | 0.990 | 207.4 | 8.32 | 0.196 | 0.988 | 548.3 | |
| 40 | 3189 | − 42 | − 53 | 37 | − 2.3 | 8.24 | 0.190 | 0.917 | 307.3 | 8.01 | 0.188 | 0.918 | 627.8 | ||
| Occipital | 18 | 108 | − 40 | − 82 | − 10 | 2.4 | 8.16 | 0.194 | 1.01 | 365.0 | 6.21 | 0.138 | 0.704 | 447.1 | |
| Temporal | 19 | 320 | − 43 | − 62 | − 13 | 2.9* | 8.37 | 0.199 | 1.04 | 573.5 | 7.01 | 0.151 | 0.715 | 369.8 | |
| 21 | 303 | − 54 | − 28 | − 7 | − 2.3 | 8.06 | 0.187 | 0.903 | 258.3 | 7.98 | 0.151 | 0.860 | 899.9 | ||
| VAT/DMT | 453 | − 12 | − 10 | 11 | − 2.9* | 8.40* | 0.201 | 0 .977 | 65.0 * | 8.29* | 0.171 | 0.866 | 772.2* | ||
p < 0.01;
p < 0.001. BA=Brodmann area; DMT=dorsomedial thalamus; VAT=ventral anterior thalamus; r=rise time; b=fall time; t0=onset time; k=magnitude. Coordinates are in mm from the anterior commissure [20] with positive is right (X), anterior (Y), and superior (Z). Negative direction of t-value indicates older group had greater activation than young group.
The hemodynamic response parameter averages for each cluster by group are listed in Table 1. Significant between-groups differences in hemodynamic response parameters were infrequent and limited to the domain of magnitude with the exception of three clusters. The differences with respect to magnitude were consistent with the %AUC analysis results. Figure 1 depicts modeled response curves in the three largest clusters: right parietal, right middle frontal, and left inferior frontal areas. Clusters in left and right thalamus and one in the left premotor area were different between groups in rise time; older adults had faster (i.e. smaller) rise times than young adults.
Fig. 1.

Models of hemodynamic response during inhibition for both young and older adults in the three largest activation clusters: right inferior parietal lobule (a), right middle frontal gyrus (b) and left inferior/middle frontal gyrus (c). The plotted symbols are for visual distinction only and do not represent actual datapoints. The groups did not significantly differ on any parameter in these clusters except in magnitude for c (old > young, p ≤ 0.01; see Table 1).
To examine the variability in the hemodynamic responses for lure trials between subjects rather than simply between groups, we calculated average waveforms for each subject with 95% confidence intervals calculated from the group s.d. for each parameter under both extremes (i.e., all high/early or low/late values). The result of this analysis using the ten largest clusters (using all clusters produced nearly identical results) is shown in Fig. 2, which shows that older and younger participants had comparable averages and comparable variability of responses. However, the high confidence interval shows the possibility of slightly earlier and larger waveforms for the older adults.
Fig. 2.
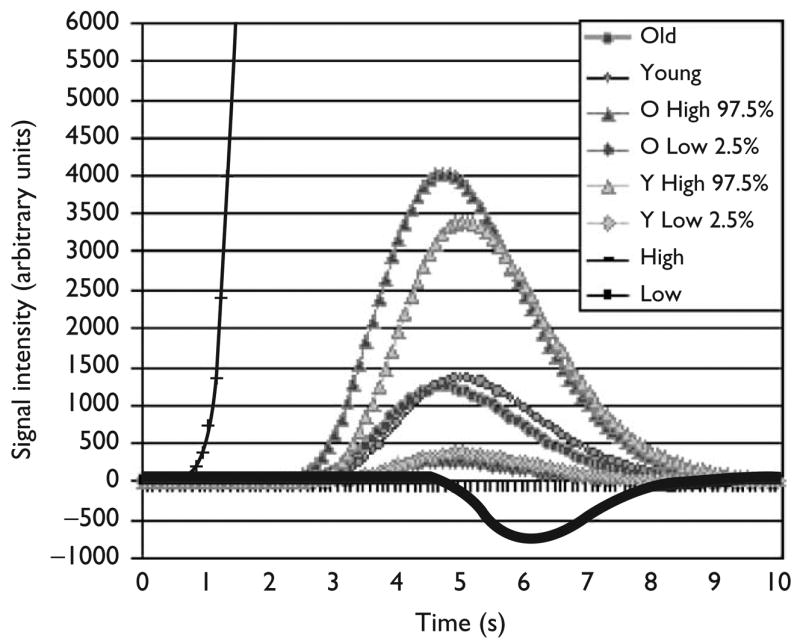
Models of hemodynamic response during inhibition averaged across the 10 largest clusters, separately for older and younger participants, including confidence intervals and high and low parameters. The plotted symbols are for visual distinction only and do not rep resent actual datapoints. The averages were comparable between groups.
DISCUSSION
The purpose of this study was to examine the integrity of the hemodynamic response in older adults as compared to young adults on an inhibition task. Analysis of the hemodynamic response parameters revealed no significant between-groups differences in onset, rise or fall parameters for any of the activated regions, except in two thalamic clusters and one premotor cluster for rise, which had a smaller (i.e., earlier) rise for older subjects. In addition, the cluster-averaged waveform (Fig. 2) suggested that older and younger averages and variability were comparable, with the exception of slightly earlier and more robust k parameter at the high end for older participants. This latter finding could be due to somewhat more extreme responses at the high end by older subjects. In contrast, it could simply be due to the larger number and size of the clusters with greater magnitude of response produced by older participants. Overall, the averages and variability were quite comparable and well within expected ranges for normal hemodynamic responses. These findings support the hypothesis and are generally consistent with the findings of Buckner et al. [15] and D’Esposito et al. [10], suggesting that the group differences in activation were not due to age-induced hemodynamic factors. The present findings, in fact, call into question whether such changes occur in healthy aging. Indeed, the current results suggest that the hemodynamic differences reported previously [7–9] might have been exacerbated by group differences in sensorimotor acuity. Furthermore, the results clearly indicate that the parameters of the general hemodynamic model used to analyze these data sets are appropriate for and not violated by older subjects. Indeed, the NLR optimization procedure used arrives at the best-fitting function for each voxel time series, while also allowing significant variability within the data and maintaining a hemodynamic waveform, which appears optimal for comparing groups expected to differ on behavioral or functional dimensions, such as old and young. Finally, because young adults exhibited some degree of activation in many of the same left prefrontal regions that were significantly more activated by older adults (Fig. 1), the results suggest that left prefrontal regions may be available to participate in inhibition, when or if needed, with those on the right [23].
CONCLUSION
When compared with young adults, older individuals had comparable hemodynamic response properties, increased magnitude of activation, and a more bilateral activation pattern for an inhibition task. Therefore, age-related difficulty with inhibition was not associated with changes in response functions or hemodynamic coupling. Thus, comparisons of healthy older and young subjects on various cognitive tasks should not be generally confounded by alterations in hemodynamic properties.
Acknowledgments
We thank Mr Kirk I. Erickson for assistance with data collection. Current author affiliations: University of Michigan, Ann Arbor, MI (S.A.L.);Trinity College, Dublin, Ireland (H.G.); National Institute of Drug Abuse IRP, Baltimore, MD (T. J. R., E.A.S.).
References
- 1.Cabeza R. Hemispheric asymmetry reduction in older adults: the HAROLD model. Psychol Aging. 2002;17:85–100. doi: 10.1037//0882-7974.17.1.85. [DOI] [PubMed] [Google Scholar]
- 2.Cabeza R, Anderson ND, Houle S, Mangels JA, Nyberg L. Age-related differences in neural activity during item and temporal-order memory retrieval: a positron emission tomography study. J Cogn Neurosci. 2000;12:197–206. doi: 10.1162/089892900561832. [DOI] [PubMed] [Google Scholar]
- 3.Grady CL, Maisog JM, Horwitz B, Ungerleider LG, Mentis MJ, Salerno JA, et al. Age-related changes in cortical blood flow activation during visual processing of faces and location. J Neurosci. 1994;14:1450–1462. doi: 10.1523/JNEUROSCI.14-03-01450.1994. [DOI] [PMC free article] [PubMed] [Google Scholar]
- 4.Madden DJ, Hoffman JM. Application of positron emission tomography to age-related cognitive changes. In: Krishman KRR, Doraiswamy PM, editors. Brain Imaging in Clinical Psychiatry. New York: M. Dekker; 1997. pp. 576–601. [Google Scholar]
- 5.Nielson KA, Langenecker SA, Garavan H. Differences in the functional neuroanatomy of inhibitory control across the adult lifespan. Psychol Aging. 2002;17:56–71. doi: 10.1037//0882-7974.17.1.56. [DOI] [PubMed] [Google Scholar]
- 6.Ogawa S, Lee T, Kay A, Tank D. Magnetic resonance imaging with contrasts dependent on blood oxygenation. Proc Natl Acad Sci USA. 1992;87:9868–9872. doi: 10.1073/pnas.87.24.9868. [DOI] [PMC free article] [PubMed] [Google Scholar]
- 7.Huettel S, Singerman J, McCarthy G. The effects of aging upon the hemodynamic response measured by functional MRI. Neuroimage. 2001;13:161–175. doi: 10.1006/nimg.2000.0675. [DOI] [PubMed] [Google Scholar]
- 8.Ross MH, Yurgelun-Todd DA, Renshaw PF, Maas LC, Mendelson JH, Mello NK, et al. Age-related reduction in functional MRI response to photic stimulation. Neurology. 1997;48:173–176. doi: 10.1212/wnl.48.1.173. [DOI] [PubMed] [Google Scholar]
- 9.Taoka T, Iwasaki S, Uchida H, Fukusumi A, Nakagawa H, Kichikawa K, et al. Age correlation of the time lag in signal change on EPI-fMRI. J Comput Assist Tomogr. 1998;22:514–517. doi: 10.1097/00004728-199807000-00002. [DOI] [PubMed] [Google Scholar]
- 10.D’Esposito M, Zarahn E, Aguirre GK, Rypma B. The effect of normal aging on the coupling of neural activity to the BOLD hemodynamic response. Neuroimage. 1999;10:6–14. doi: 10.1006/nimg.1999.0444. [DOI] [PubMed] [Google Scholar]
- 11.Marsiske M, Delius J, Maas I, Lindenberger U, Scherer H, Tesch-Roemer C. Sensory systems in old age. In: Baltes PB, Mayer KU, et al., editors. The Berlin Aging Study: aging from 70 to 100. New York: Cambridge University Press; 1999. pp. 360–383. [Google Scholar]
- 12.Buckner R, Snyder AZ, Sanders A, Raichle M, Morris J. Functional brain imaging of young, nondemented and demented older adults. J Cogn Neurosci. 2000;12:24–34. doi: 10.1162/089892900564046. [DOI] [PubMed] [Google Scholar]
- 13.Hesselman V, Zaro Weber O, Wedekind C, Krings T, Schulte O, Kugel H, et al. Age-related signal decrease in functional magnetic resonance imaging during motor stimulation in humans. Neurosci Lett. 2001;308:141–144. doi: 10.1016/s0304-3940(01)01920-6. [DOI] [PubMed] [Google Scholar]
- 14.Heuttel S, Singerman J, McCarthy G. The effects of aging upon the hemodynamic response measured by functional MRI. Neuroimage. 2001;13:161–175. doi: 10.1006/nimg.2000.0675. [DOI] [PubMed] [Google Scholar]
- 15.Buckner R, Logan J, Donaldson D, Wheeler M. Functional brain imaging of young, nondemented, and demented older adults. J Cogn Neurosci. 2000;12:24–34. doi: 10.1162/089892900564046. [DOI] [PubMed] [Google Scholar]
- 16.Folstein MF, Folstein SE, McHugh PR. Mini-mental state. A practical method for grading the cognitive state of patients for the clinician. J Psychiatr Res. 1975;12:189–198. doi: 10.1016/0022-3956(75)90026-6. [DOI] [PubMed] [Google Scholar]
- 17.Sheikh JI, Yesavage JA. Geriatric Depression Scale (GDS): recent evidence and development of a shorter version. Clin Gerontol. 1986;15:165–173. [Google Scholar]
- 18.Garavan H, Ross TJ, Stein EA. Right hemispheric dominance of inhibitory control: an event-related fMRI study. Proc Natl Acad Sci USA. 1999;96:8301–8306. doi: 10.1073/pnas.96.14.8301. [DOI] [PMC free article] [PubMed] [Google Scholar]
- 19.Wong E, Buskamp E, Hyde J. A volume optimized quadrature elliptical endcap birdcage brain coil. 11th Annual Scientific Meeting, Society for Magnetic Resonance Medicine; Berlin, Germany. 1992. [Google Scholar]
- 20.Talairach J, Tournoux P. Co-planar Stereotaxic Atlas of the Human Brain. New York: Thieme; 1988. [Google Scholar]
- 21.Cox R. AFNI: software for analysis and visualization of functional magnetic resonance neuroimages. Comput Biomed Res. 1996;29:162–173. doi: 10.1006/cbmr.1996.0014. [DOI] [PubMed] [Google Scholar]
- 22.Cohen M. Parametric analysis of fMRI signal using linear systems methods. Neuroimage. 1997;6:93–103. doi: 10.1006/nimg.1997.0278. [DOI] [PubMed] [Google Scholar]
- 23.Stuss DT, Toth JP, Franchi D, Alexander MP, Tipper S, Craik FIM. Dissociation of attentional processes in patients with focal frontal and posterior lesions. Neuropsychologia. 1999;37:1005–1027. doi: 10.1016/s0028-3932(98)00158-4. [DOI] [PubMed] [Google Scholar]