

Abstract
Purpose
Oxidative stress (OS) is believed to be a major contributor to age-related cataract and other age-related diseases.
Methods
cDNA microarrays were used to identify the spectrum and range of genes with transcript levels that are altered in response to acute H2O2-induced OS in human lens epithelial (HLE) cells. HLE cells were treated with 50 μM H2O2 for 1 hour in the absence of serum, followed by a return to complete medium. RNAs were prepared from treated and untreated cells at 0, 1, 2, and 8 hours after H2O2 treatment.
Results
The data showed 1171 genes that were significantly up- and downregulated in response to H2O2 treatment. Several functional subcategories of genes were identified, including those encoding DNA repair proteins, antioxidant defense enzymes, molecular chaperones, protein biosynthesis enzymes, and trafficking and degradation proteins. Differential expression of selected genes was confirmed at the level of RNA and/or protein. Many of the identified genes (e.g., glutathione S-transferase [MGST2], thioredoxin reductase β, and peroxiredoxin 2) have been identified as participants in OS responses in the lens and other systems. Some genes induced by OS in the current study (e.g., oxygen regulated protein [ORP150] and heat shock protein [HSP40]) are better known to respond to other forms of stress. Two genes (receptor tyrosine kinase [AXL/ARK] and protein phosphatase 2A) are known to be differentially expressed in cataract. Most of the genes point to a novel pathways associated with OS.
Conclusions
The present data provide a global perspective on those genes that respond to acute OS, point to novel genes and pathways associated with OS, and set the groundwork for understanding the functions of OS-related genes in lens protection and disease.
Oxidative stress (OS) occurs when the level of pro-oxidants (reactive oxygen species and other free radicals) exceeds the ability of the cell to respond through antioxidant defense and ultimately leads to modification and degradation of protein, damage to DNA and mitochondria, and cell death.1,2 Significant evidence points to oxidative damage as a major factor in the initiation and progression of numerous age-related diseases, including Alzheimer’s and Parkinson’s diseases, age-related macular degeneration, and age-related cataract.3 The transparent ocular lens is especially prone to oxidative damage, because the fiber cells of the lens are not renewed and therefore have to last a lifetime. Damage to these cells results in degradation of protein and ultimately in age-related cataract, which is the leading cause of blindness worldwide and the leading expense in Medicare-funded surgery in the United States.3,4
To combat damage by OS and other insults, the numerous protective systems have evolved in the ocular lens, making it an excellent model to study both the biology of aging and the molecular mechanisms associated with OS.4 The lens is an avascular and encapsulated tissue comprising a single layer of epithelial cells that terminally differentiate into fiber cells. Fiber cell differentiation is characterized by elongation of the cells, synthesis and accumulation of crystallins, and eventual degradation of the nuclei and organelles. Thus, the main metabolic part of the lens and the only part of the lens capable of responding to environmental insults through altered gene expression is the lens epithelium.4 The lens epithelium is also the first part of the lens exposed to insults, including H2O2. H2O2 is formed in the aqueous humor by a series of reactions triggered by the interaction of UV light with ascorbate and other molecules. Organ culture experiments have shown that acute OS induced by H2O2 treatment can irreversibly damage the lens epithelium, resulting in cell death and cataract.4
Among the systems that defend against OS in the lens are a high level of reduced glutathione (GSH),5 abundant antioxidant enzymes,6 and the chaperone-like functions of crystallins.7 Aging of the lens is characterized by a diminishing level of GSH and reduced activities of detoxifying enzymes.5,6 Numerous altered levels and activities of antioxidant enzymes and protective proteins have been detected after oxidative damage of lens epithelial cells.5,6,8 The lens also expresses a set of common transcription factors (e.g., AP-1, NF-κB, p53, and upstream stimulatory factor [USF]), with activities that are regulated by the redox state of the cell,1,9 and these factors are known to activate batteries of genes that participate in protection and repair. Previous work has provided evidence that the human lens epithelium (HLE) is capable of responding to the presence of OS and cataract through the altered expression of numerous genes, including the regulatory subunit of protein phosphatase 2A,8 metallothionein IIa,10 thioltransferase,11 catalase,12 glutathione peroxidase,13 multiple glutathione S-transferases,6 Na,K-ATPase,14 AP-1,15 and proline isomerase.16
These data suggest that the lens is capable of dynamic responses to OS and cataract, and in the present study we sought to elucidate the global cellular response of lens epithelial cells to H2O2-induced stress by using high-throughput cDNA microarray technology and genome-scale analysis of the data.17 A consortium including Duke University (Durham, NC), the Fred Hutchinson Cancer Center (Seattle, WA), the Massachusetts Institute of Technology (Cambridge, MA), Oregon Health and Science University (Portland, OR), the University of Northern Carolina (Chapel Hill, NC), and the National Institute of Environmental Health Science (NIEHS, Bethesda, MD) is performing similar studies of OS response in human cells, including epithelial cells, fibroblasts, and lymphoblasts.18 The acute responses of lens cells to H2O2 were evaluated under conditions that allowed almost complete survival of lens cells with negligible apoptosis and necrosis. The present data establish six major functional gene classes and 96 specific genes that respond to acute nonlethal H2O2 treatment of HLE cells. The present results provide insight into those stress regulatory mechanisms that provide lens protection against OS, and the identified genes are candidates for the study of cataract and other stress-related disorders.
Methods
Cell Culture and RNA Preparation
HLE cells SR-01-04 were grown to 70% to 80% confluence in Dulbecco’s modified minimum Eagle’s medium in the presence of 15% fetal bovine serum, and gentamicin. The cells were treated with 50 μM H2O2 for 1 hour in serum-free medium and then returned to complete medium and cultured for 2 and 8 hours (see Fig. 3). The control experiment was performed without H2O2. The cells were also treated similarly with H2O2 but grown for an additional 1 hour in the absence of serum. RNAs were prepared from separate experiments using a kit (Totally RNA; Ambion, Woodlands, TX).
Figure 3.
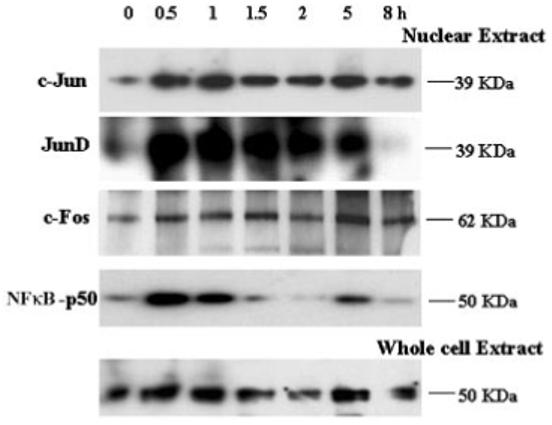
Western blot analysis of protein levels of transcription factors c-Jun, c-fos, Jun D, and NF-κB known to be regulated by redox state. Time (in hours) and relative molecular mass (in kilodaltons) are indicated.
Microarray Procedures
RNAs were analyzed by cDNA microarray hybridizations on human gene chips containing 9700 genes (developed at Albert Einstein College of Medicine [AECOM]).17 Reference RNA was prepared by pooling three RNA samples (see Fig. 4). Each hybridization was conducted in triplicate (i.e., technical replicates, because a single treatment of each cell culture did not yielded enough RNA for a biological replicate).19 Reference scanning, digitalization, normalization, and flagging of data were conducted (scanner and Genepix 3.02 software; Axon Instruments, Union City, CA, and GeneSpring 4.1 software; Silicon Genetics, San Carlos, CA). Normalized data tables can be obtained at http://www.aecom.yu.edu/thecvekllab.
Figure 4.
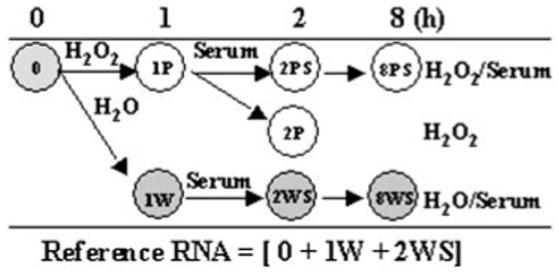
Experimental design of the treatment of HLE cells with 50 μM H2O2. Hybridizations were conducted with RNA isolated from indicated experiments (circles). Reference RNA was prepared as a 1:1:1 (wt/wt/wt) pool from three experiments, 0, 1W, and 2WS.
Quality Control, Data Analysis, and Statistics
The entire raw data set was filtered to accommodate a requirement of at least two of three good-quality measurements for each triplicate experiment (the spot’s average pixel intensity in both red and green channels must be greater than the average background pixel intensity plus 2 standard deviations). Normalization of intensity ratios across all experiments was performed based on medians of the 50th percentile. Log2-transformed ratios were further processed by the significance analysis of microarray (SAM) algorithm to generate a list of genes showing statistically significant up- or downregulation of transcripts.20 We used stringent criteria for selection, to look for a set of genes with 1% probability of false discovery rate. Gene clustering, using self-organizing maps, was conducted with Genecluster (http://www.genome.wi.mit.edu; provided in the public domain by the Whitehead Institute, Massachusetts Institute of Technology, Cambridge, MA). Patterns of gene expression that formed subcategories specific to function were analyzed with the MultiExperiment Viewer (http://www.tigr.org; provided in the public domain by The Institute for Genomic Research [TIGR], Rockville, MD).
Semiquantitative RT-PCR
Primers were designed on computer (Prime algorithm from the GCG package; Oxford Molecular Group, Campbell, CA). The primer sets and reaction conditions are shown in Table 1. Indicated transcripts were reverse transcribed and amplified with a commercial system (One Step RT-PCR; Invitrogen, Gaithersburg, MD).
Table 1.
Primer sets and Reaction Conditions
| Gene Name | Forward Primer (5′-3′) | Reverse Primer (5′-3′) | PCR Product (bp) | Annealing Temperature (°C) |
|---|---|---|---|---|
| Copper zinc superoxide dismutase (CuZnSOD) | GGGGAAGCATTAAAGGACTGACT | AATTACACCACAAGCCAAACGAC | 353 | 52 |
| Glutamylcysteine synthetase (GCSH) | TGAGGCCAACATGCGAAAAC | GGCTTGGAATGTCACCTGGAG | 409 | 55 |
| Glutathione S-transferase (GSTT2) | CCAGCCGCGCCGTCTACATCT | AGTCGTGGCCGTCCCTCAAACAG | 532 | 61 |
| Manganese superoxide dismutase (Mn SOD) | CTCCCGACCTGCCCTACGACTAC | AAACCAAGCCAACCCCAACCTGAG | 374 | 60 |
| Thioltransferase (TTase) | CTGGGAAGGTGGTTGTGTT | TTCCTATGAGATCTGTGGTTACTG | 305 | 47 |
| Glyceraldehyde-3-phosphate dehydrogenase | CCACCCATGGCAAATTCCATGGCA | TCTAGACGGCAGGTCAGGTCCACC | 600 | 60 |
| CD 47 | ACGTAAGGGTCTCATAGGT | CTCTTCGGATTTCAGGTTT | 254 | 44 |
| Amyloid precursor protein (APP) | CCACTGCAGGCACGTTGTA | CCGCCTGGCCCCTGGAGAA | 260 | 58 |
| β-Tubulin | GGGAAGGGGACCATGTTGACTG | CTGGGACCATGGACTCTGTTCG | 573 | 56 |
| Mitogen-activated kinase interacting protein 2 | CAGGCCTGAAGGATGATGGT | AGTGGCAAATGCAGGAGAGG | 296 | 52 |
| N-acetyllactosamine synthase (B4GLT1) | GCCACTGAATGCGAGAAACC | CGGGAAAATTGGGAGAGTGCT | 289 | 56 |
| Fanconi anemia group A gene | CCAAGGCCATGTCCGACTCG | CAGAAAGCATGGCCCTGGCGACG | 581 | 60 |
| Catalase | TACCCCTCCTGGACTTTTTACATC | CCTCATTCAGCACGTTCACATAGA | 541 | 52 |
Cellular and Nuclear Extract Preparations
Whole-cell and nuclear extracts of treated and untreated HLE cells were prepared according to a standard protocol.21
Western Blot Analysis
Whole-cell extracts (40 μg of total proteins) were analyzed by SDS-PAGE. The anti-catalase antiserum (Abcam, Cambridge, UK), anti-α-1-antitrypsin (Stressgen, Victoria, British Columbia, Canada), and anti-basigin22 (gift of Brian Toole, Tufts University, Boston, MA) were used at a dilution of 1:1000; the secondary antibody, anti-rabbit horseradish peroxidase (Vector Laboratories, Burlingame, CA), was used at 1:5000 dilution; and chemiluminescence was detected with a kit (Pierce, Rockford, IL). Antibodies against transcription factors were arylhydro-carbon receptor nuclear translocator (ARNT; Novus Biologicals, Littleton, CO); c-fos, c-jun, JunD, and NF-κB (p50) (Santa Cruz Biotechnology, Santa Cruz, CA); and lens epithelium-derived growth factor (LEDGF; gift of Toshimichi Shinohara, Brigham and Women’s Hospital, Boston, MA).
Flow Cytometry Analysis of Apoptotic Cells
Recovery of the cells was monitored by examining the levels of apoptosis at 0, 1, 2, 8, and 24 hours after the H2O2 treatment. Annexin V binding and propidium iodide staining were determined by flow cytometry, using reagents from Roche Molecular Biochemicals (Indianapolis, IN). The cells were treated with 50 μM H2O2 for 1 hour, as described earlier, washed with ice-cold PBS, and double stained with FITC-coupled annexin V protein and propidium iodine for 20 minutes. Flow cytometry was performed with a 488-nm laser coupled to a cell sorter (FacsCalibur; BD Biosciences, San Jose, CA). Cells stained with both propidium iodide and annexin V were considered necrotic, and the cells stained only with annexin V were considered apoptotic.23 The data are based on multiple analyses of two independent experiments.
Results
Cell Survival versus Apoptosis after H2O2 Treatment
Multiple concentrations of H2O2 were initially tested to determine an H2O2 concentration that did not induce significant apoptosis. These experiments indicated that a 1-hour treatment with 50 μM H2O2 resulted in minimal apoptosis or necrosis up to 24 hours after treatment (Fig. 1). The total apoptotic and necrotic cells was 8% compared with 2% in untreated cells. The damaged cells detached from the surface and were removed during the change of medium. Analysis of the remaining cells at 8 and 24 hours subsequent to H2O2 treatment demonstrated levels of apoptosis and necrosis that were indistinguishable from that in the control cells.
Figure 1.
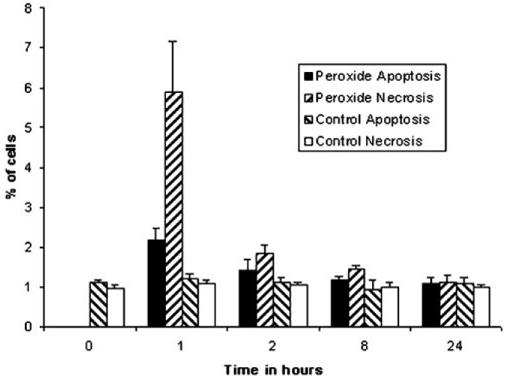
Flow cytometry analysis of the proportion of apoptotic and necrotic cells followed a 1-hour 50-μM treatment with H2O2.
Induction of Representative Genes Involved in H2O2 Detoxification
To determine that 50 μM H2O2 significantly induces gene expression in HLE cells, we evaluated by RT-PCR the transcript levels in treated lens cells of five enzymes known or believed to be essential in H2O2 protection, including CuZn and Mn superoxide dismutases (SODs), glutamylcysteine synthetase (γGCSH), glutathione S-transferase theta 2 (GSTT2), and thioltransferase (TTase) (Fig. 2). We detected elevated levels of three transcripts (CuZn and Mn superoxide dismutases, and glutathione S-transferase theta 2) at both 1 and 2 hours after the initial treatment. In contrast, transcripts encoding glutamylcysteine synthetase were reduced at 1 hour and elevated at 2 hours after the initial treatment. Because treatment with 50 μM H2O2 yielded significant gene inductions with minimal apoptosis or necrosis, this concentration of H2O2 was chosen for large-scale expression profiling of HLE cells.
Figure 2.
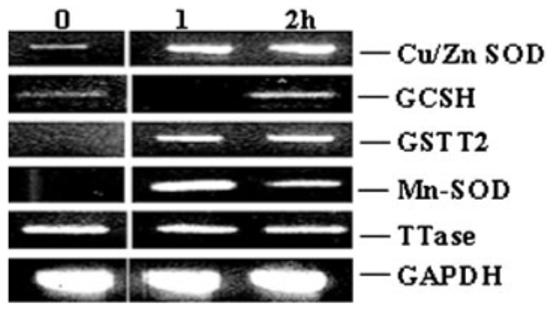
Expression of representative enzymes detoxifying OS. Semiquantitative RT-PCR analysis of CuZn superoxide dismutase (Cu/Zn-SOD), glutamylcysteine synthetase (γGCSH), glutathione S-transferase theta 2 (GSTT2), Mn superoxide dismutase (Mn-SOD), and thioltransferase (TTase) in human lens epithelial cells treated with 50 μM H2O2 for 1 and 2 hours, and control (0) human lens epithelial cells. The primers, sizes of products, and annealing temperatures are in Table 1.
Induction of Representative Genes Encoding Transcription Factors Typically Involved in H2O2 Response
Next, we examined protein levels of several transcription factors— c-Jun, c-fos, Jun D, NF-κB, ARNT, and LEDGF—all known to be regulated by various forms of stress at multiple levels (e.g., at the level of transcription, posttranslational modification, and subcellular localization).6,12,15 The immunoblots are shown in Figure 3. The data showed that as early as 30 minutes after the initial treatment with H2O2, levels of the proteins c-Jun, Jun D, c-Fos, and NF-κB in nuclear extracts were increased, in agreement with known roles of these transcription factors in the immediate response to OS. In contrast, significantly elevated levels of ARNT and LEDGF were found only at 1 hour after the treatment (data not shown). The increased levels of c-Jun, c-Fos, and Jun-D visible 30 minutes after the initial treatment are attributable to de novo transcription of these genes, mediated by the autoregulatory loops.24 In contrast, the presence of NF-κB in the nuclear extract after 30 minutes of H2O2 treatment resulted from the dissociation of the inactive cytoplasmic complex of NF-κB and IκB, followed by nuclear entry of NF-κB.24 From these data, we conclude that HLE cells treated with 50 μM H2O2 for 1 hour respond to OS by changing the RNA and protein levels of an essential group of transcription factors, demonstrating that HLE cells are widely responsive to H2O2 treatment. These data also suggest that major stress pathways were not abrogated in the SR-01-04 HLE cells.
Dynamic Changes in Expression of 1171 Genes that Respond to H2O2 Insult
To determine the spectrum and range of genes that respond to 50 μM H2O2 in HLE cells, we conducted a series of dual-color cDNA microarray hybridizations. The experimental design (Fig. 4) included several controls to distinguish effects of serum starvation and stimulation by the 50-μM H2O2 treatment. The reference RNA used was prepared as a pool of three RNAs obtained from treatments 0, 1W (H2O), and 2WS (H2O/serum). Pooling multiple RNAs is a standard practice in global gene expression studies, to enhance detection of biologically significant genes.25,26 The reference RNA in this study was always labeled with Cy3 substrate, and the tested samples (0, 1P [H2O2], 2PS, 8PS, 2P, 1W, 2WS, and 8WS) were labeled with Cy5 substrate. Reverse labeling was not conducted, because the data analysis was performed using the SAM algorithm (as described in the Methods section) to evaluate expression of each gene for its deviation from all other time points and experimental conditions.
Using the SAM analysis,20 we evaluated results of three individual experiments: H2O2/serum, H2O2, and H2O/serum (Fig. 4). The H2O2/serum pathway (0-1P-2PS-8PS) was a primary experiment to identify differentially expressed genes that respond to OS treatment. In contrast, the pathway 0-1W-2WS-8WS was a control experiment (H2O/serum), to eliminate the possibility that changes in gene expression result from serum treatment alone. To further distinguish true H2O2 gene induction from serum induction, a third pathway, H2O2 (0-1P-2P) representing OS caused by prolonged serum starvation, was also studied. Because the overwhelming majority of transcript levels at 8 hours after treatment were similar to those in the control cells and our focus was on primary-response genes, the 8-hour time point was excluded from the SAM analyses. In the H2O2/serum and H2O2 pathways, we found, respectively, 823 and 219 differentially expressed genes unique to each pathway. Differential expression of 129 transcripts was common to both courses of treatment. Altogether, 1171 statistically reliable, differentially expressed transcripts were detected, with a false discovery rate of less than 1%.
The time-course display of the relative intensities of these 1171 genes is shown in Figure 5. Individual genes are displayed as dots. The pattern of dots from each experiment indicates the amplitude of changes of the individual transcript levels. The H2O2/serum (Fig 5, top) diagram contains 823 unique and 129 common genes: 952 individual dots; H2O2 (Fig. 5, middle) contains 219 unique and 129 common genes: 348 individual dots and H2O/serum (Fig. 5, bottom) contains all 1171 genes and therefore the same number of dots. The zero time point represents the ratios of untreated cells divided by the pooled reference. After 1 hour of treatment with 50 μM H2O2, followed by cultivation in the presence of serum, transcript levels diverged into two distributions, representing up- and downregulated transcripts. Two hours after the initial treatment, a visible majority of transcripts returned to their original levels. Nevertheless, a significant proportion of transcripts (n = 237) were still upregulated by at least a factor of 1.5 (n1 = 206 genes), or downregulated by at least a factor of 0.67 (n2 = 31 genes). Eight hours after the initial treatment, the patterns indicate that the overwhelming majority of transcript levels returned to the levels in the control cells. By contrast, in the H2O2 pathway, the split between up- and downregulated genes was maintained at 2 hours after the initial treatment. In the control experiment (0-1W-2WS-8WS), transcript level changes were less dramatic and reflect the 1 hour of serum starvation followed by stimulation with serum. The normalized 8-hour time point of the H2O2/serum expression pattern and the minimal levels of apoptotic cells suggest that the H2O2-treated cells in the H2O2/serum pathway were approaching the normal state.
Figure 5.

Significant changes in transcript levels of panels of genes responding to the treatment of HLE cells responding to the 50-μM H2O2 treatment for 1 hour (Fig. 4). Diagram represents of distribution of normalized signal intensities of tested versus common reference (pooled) samples. The genes included were only the 1171 that met the SAM criteria for significance of up- or downregulation. Top: human lens epithelial cells treated with 50 μM H2O2 (H2O2/serum pathway). Middle: cells treated with 50 μM H2O2 followed by 1 hour of serum starvation, (H2O2 pathway). Bottom: control cells (H2O/serum pathway). Triplicates are shown.
Functional Classification of OS-Responsive Genes
Gene clustering based on the expression profiles revealed seven types of responses (Fig. 6). To annotate the list of 1171 genes according to their function, we performed comprehensive database searches. We used a 12-group classification system to assign putative function to 43% (n = 509) of the genes.27 The groups are (Fig. 7) (1) cell growth, division, and DNA synthesis; (2) cell rescue, defense, and death; (3) cellular organization; (4) energy and mitochondria; (5) intracellular transport; (6) ionic homeostasis; (7) metabolism; (8) protein synthesis and degradation; (9) signal transduction; (10) splicing; (11) transcription; and (12) transport facilitation. We added two groups, one containing annotated genes without any deduced function and the other containing ESTs. Some genes can be classified in at least two categories. The prime examples are regulatory kinases and phosphatases that may belong to both groups 1 (81 genes) and 9 (72 genes), as illustrated in Figure 7. Five genes from these categories were accounted for in two categories. The total number of genes in these categories that were present on the microarray was calculated from data provided by Mariadason et al.28 The presence of a number of significantly regulated genes in each category indicates that OS affects all 12 functional groups.
Figure 6.
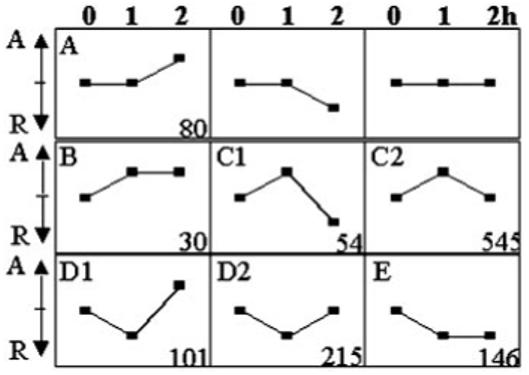
Seven representative expression profiles. The expression profiles are based on data from 0-, 1-, and 2-hour time points that yield a maximum of nine patterns of expression. Seven patterns, labeled A, B, C1, C2, D1, D2, and E, were detected using Genecluster. Clusters B, C1, C2, D1, D2, and E represent early-response genes and cluster A represents delayed-response genes.
Figure 7.
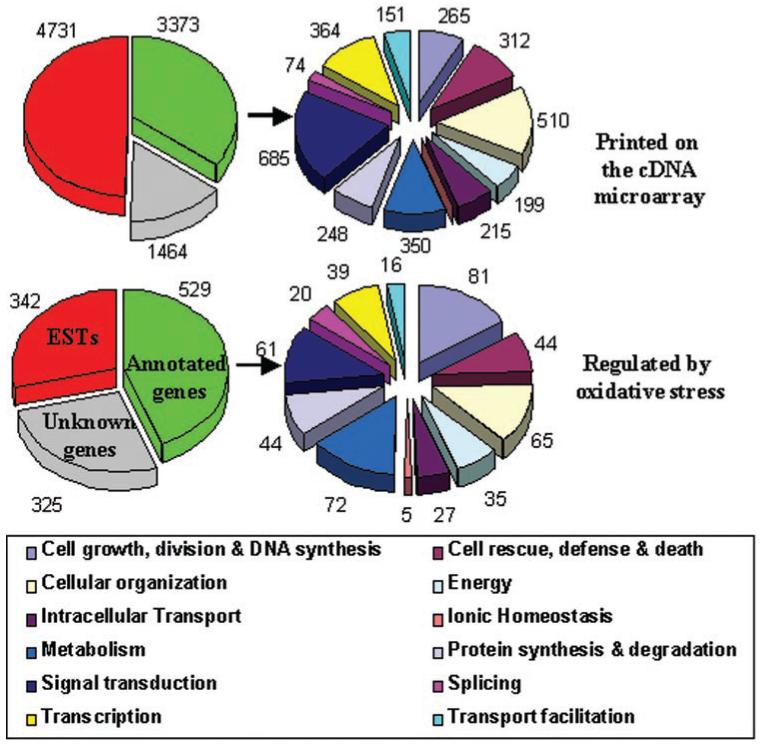
Summary diagram showing functional categories of 1171 genes selected by SAM. The genes regulated by OS were classified into 12 functional groups according to Gerstein and Jansen.24 The diagram of genes spotted on the microarray, shown for comparison was generated using independently collected annotations by Mariadason et al.28 Genes in group 6, ionic homeostasis, were not classified separately.
Secondary Confirmation of Microarray Results
To provide confirmation of transcript level differences resulting from the H2O2 treatment, a series of semiquantitative RT-PCR analyses was conducted with specific primers used to detect five representative genes: CD47, amyloid βA4 precursor protein (APP), β-tubulin (TUBB), Jun NH2-terminal kinase (JNK) interacting protein 2 (MAPK8IP2), UDP-galactose:β-N-acetylglucosamine β-1,4-galactosyltransferase 1 (B4GALT1), and Fanconi anemia complementation group A (FANCA). CD47 was selected from the group of unchanged genes and analyzed at 0, 1, 2, 3, 5, and 8 hours. The results (Fig. 8) confirm the trends in transcript levels of specific genes initially detected by the microarray study. These trends are also likely to be reflected at the protein level, because increased catalase (group 2, cell rescue, defense, and death), α-1-antitrypsin (group 8, protein synthesis and degradation), and basigin (group 3, cellular organization) were also detected at the protein level (Fig. 8D). These proteins were selected because of the availability of specific antibodies and because they represent different functional groups.
Figure 8.
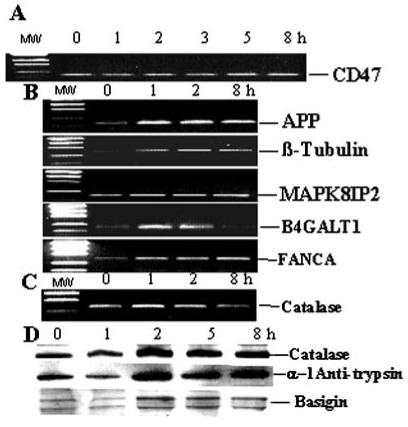
Data validation of a selected group of genes at the transcript and protein levels. (A) Semiquantitative RT-PCR analysis of CD47 transcript levels used as a control for the unchanged gene. (B) Semiquantitative RT-PCR analysis of transcript levels of amyloid βA4 precursor protein (APP, group 8), β-tubulin (TUBB, group 3), Jun NH2-terminal kinase (JNK) interacting protein 2 (MAPK8IP2, groups 2 and 9), UDP-galactose:β-N-acetylglucosamine β-1,4-galactosyltransferase 1 (B4GALT1, group 3), and Fanconi anemia complementation group A (FANCA, group 1). The primers, sizes of products, and annealing temperatures are given in Table 1. Functional groups are listed in Figure 7. (C) Semiquantitative RT-PCR analysis of catalase (group 2) transcript levels. On left, DNA ladders are shown in (A), (B), and (C). (D) Western blot analysis of catalase (group 2), α-1-antitrypsin (group 8), and basigin (group 3).
We did not examine transcript levels of additional genes (e.g., transcripts repressed by the OS treatment) with semi-quantitative RT-PCR, because we were mainly interested in genes that are upregulated with OS treatment and are therefore likely participants in the defense against OS. It was interesting that from the group of five genes encoding antioxidant enzymes, only one spot for glutamylcysteine synthase (γGCSH) was present on the array. However, this transcript was not analyzed by SAM, because five data entries from 27 chips used did not pass through the initial data-filtering step. Future studies will be undertaken to compare directly the present microarray data with the absolute magnitude of change of most biologically interesting transcript levels at an expanded number of time points, to identify peak values and respective time points of each transcript by real-time RT-PCR.
Discussion
Analysis of Smaller Categories of OS-Responding Genes
OS-related damage to the genomic DNA, if not successfully repaired, will ultimately trigger apoptosis.29 H2O2 and reactive oxygen species are decomposed by various antioxidant enzymes. Cells under OS stress respond at the level of de novo protein synthesis, identifying damaged proteins followed by degradation and/or repair, involving their refolding. Thus, we used database searches to classify genes into individual smaller categories according to function, including DNA repair, molecular chaperones, antioxidant enzymes, ribosomal and accessory proteins, protein trafficking, protein sorting, secretion and quality control, proteasome degradation, and proteinases and their inhibitors. The expression profiles used to determine similarly regulated genes were developed with self-organizing maps from the MultiExperiment Viewer software. Transcript levels are displayed in a seven-color system (Fig. 9). Our method of data presentation and analysis is based on grouping proteins according to their functions, analyzing their responses to OS, and looking for functionally similar genes present on the microarray that do not respond to the OS. We do not believe there is a direct correlation between function and the magnitude of change in gene expression, because many biological processes are regulated by a twofold change.20 In addition, a series of twofold changes in the activities of enzymes operating in the same pathway are likely to be amplified in term of biological responsiveness.
Figure 9.
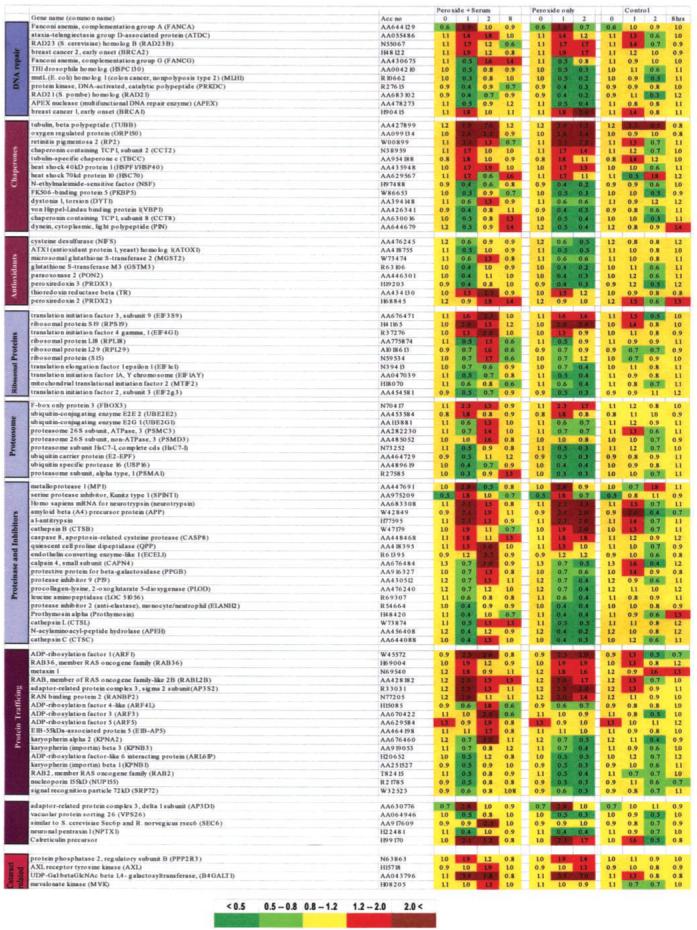
Transcript levels of genes encoding DNA repair, molecular chaperones, antioxidant proteins, ribosomal proteins and elongation factors, proteasomes, and proteinases and their inhibitors, as well as genes responsible for protein trafficking, sorting, secretion, and quality control functions subcategories and other genes (PP2A, AXL, B4GALT1, and MVK) are regulated by OS. Upregulated, downregulated, and unchanged genes are shown in red, green, and yellow, respectively. Genes considered unchanged genes were those with ratios 1 ± 0.2; upregulated genes were those with ratios between 1.2 and 2 (light red) and above 2 (dark red); downregulated genes were those with ratios between 0.5 and 0.8 (light green) and less than 0.5 (dark green).
OS and DNA Repair
The DNA repair subcategory includes 11 regulated genes, whereas 5 additional genes in this category appear not to be regulated by OS in the present system. Transcripts encoding FANCA, ATDC, RAD23B, BRCA2, and FANCG were specifically upregulated by OS between 1 and 2 hours after H2O2 treatment (Fig. 9). In contrast, the remaining six transcripts encoding TH1, MLH1, PRKDC, RAD21, APEX, and BRCA1 were repressed by OS. Induction of FANCA, FANCG, and BRCA1 by OS has not been described. It should be noted that the genes FANCA, FANCG, BRCA1, and BRCA2 may be components of the same DNA repair pathway, as judged from their subnuclear colocalization in previous studies30; however, the precise function of these genes is not currently known.31
Molecular Chaperones and Chaperone-like Proteins
The molecular chaperone group contains many genes known to be induced by OS and other forms of stress. Our data show significant upregulation of eight transcripts encoding classic heat shock proteins, chaperones involved in β-tubulin folding, and β-tubulin (TUBB; Fig. 9). Elevated levels of transcripts encoding ORP150 and β-tubulin were found both at 1 and 2 hours after OS treatment. Other members of this group were either initially activated (HSC70, TBCC) or decreased at 1 hour and upregulated at 2 hours (DYT1, VBP1, and CCT8). Five transcripts encoding proteins with chaperone and chaperone-like functions (PFDN4, TR1/gp96, CCT4, CCT7, and HSP10) did not respond to the OS treatment. Prefoldin 4 (PFDN4) was upregulated (by a factor of 1.3) only at 8 hours. OS caused prolonged induction of TUBB, RP2, CCT2, HSC71, HSP40, and ORP150 in the absence of serum (Fig. 9). ORP150 is a widely studied protein that provides protection to neurons from ischemic stress32 and is not known as an OS-induced gene. Serum stimulation of the cells specifically induces DYT1, a member of the AAA+ family of molecular chaperones.33 The heat shock proteins, HSP70 and HSP90 prevent the formation of apoptosome from Apaf-1, pro-caspase-9 and cytochrome c.34,35 Our present data raise the possibility that functionally similar proteins, HSC70 and HSP40, both induced by OS already at 1 hour are also engaged in this process. ORP150 is known as a potent inhibitor of caspase-3.32 OS induction of transcripts that encode molecular chaperones, such as ORP150, retinitis pigmentosa 2,36 and β-tubulin, raises the possibility that these proteins have a broad stress-protective function in the lens epithelium.
Enzymes Involved in the Metabolism of Glutathione and Antioxidant Enzymes
Eleven transcripts encoding various glutathione S-transferases were monitored, but only two of them (MGST2 and GSTM3) showed significant changes in their expression profiles according to SAM, whereas the remaining genes (GSTM5, GSTP1, GSTTLp28, GSTT1, GSTA3, GSTZ1, GSTA4, GSTM4, and MGST1) were not identified as statistically significant (Fig. 9). Transcripts from genes encoding glutathione peroxidase 1 and 4 and glutathione synthetase were also not changed under the present experimental conditions. Five antioxidant and detoxifying enzymes (paraoxonase 2, thioredoxin reductase, ATOX1, and peroxiredoxin 2 and 3) were selected by SAM, whereas two genes (catalase and ALDH6) did not pass the criteria for significance and/or quality of the raw data. Inspection of the raw data combined with RT-PCR and Western analysis results (Fig. 8) caused us to conclude that catalase was induced by 50 μM H2O2 in our experiments. Most of the transcripts were unexpectedly repressed at 1 hour after treatment, with the exception of thioredoxin reductase, which was upregulated in both serum-free and serum-stimulated conditions. Thus, the data suggest that constitutively expressed glutathione S-transferases are sufficient to defend cells against the stress induced in the current model and that peroxiredoxins 2, -3, and -5, together with catalase and GSTT2, serve as antioxidative enzymes. With the exception of catalase, we did not find any significant overlap between genes induced by a defined 1-hour treatment with 50 μM H2O2 and genes with expression and/or copy number that was increased in mouse lens cells resistant to the high levels (125 μM H2O2) of chronic OS identified by Spector et al.37 However, a direct comparison of these two data sets is limited because different microarrays were used.
Ribosomal Proteins and Elongation Factors
Three transcripts encoding ribosomal subunits—L18, L29, and S15—were specifically repressed by OS (Fig. 9). In contrast, the S19 subunit was activated by OS. Three transcripts encoding elongation factors EEF2, EIF3S9, and EIF5G1 showed robust induction caused by OS. Four genes encoding EIF1∊1, EIF1AY, EIF2γ3, and mitochondrial MTIF2 were selectively repressed by OS.
Protein Trafficking, Secretion, and Quality Control
The protein trafficking subcategory is composed of two subclasses, including classic proteins involved in protein trafficking and specialized proteins (nuclear import subclass) facilitating import of other proteins into the nucleus (Fig. 9). Both groups contain early-response (e.g., metaxin 1, KPNB1, and RABL2B) and delayed-response (e.g., ARF3, ARF5, and ARF4L) genes and contain numerous genes with highly upregulated transcripts (ARF1, ARF3, and KPNA2). Five genes in the subcategory protein sorting, secretion, and quality control showed significant changes in their expression profiles. Transcripts encoding AP3D1 and VPS26 are involved in protein sorting. SEC6 and NPTX1 are involved in protein secretion, and calreticulin controls the quality of newly synthesized proteins. Calreticulin also exhibits a significant antiapoptotic activity.38 Several members of this subcategory (calnexin, SEC61B, SEC63L) that were present on the chip were not affected by 50 μM H2O2-induced OS. Transcripts encoding SEC61G were induced by a factor of 1.7 only at 8 hours.
Proteasome and Ubiquitination Pathways and Other Routes of Protein Degradation
The majority of transcripts encoding various proteins involved in proteasome-mediated degradation of proteins were reduced as a specific result of imposed OS (Fig. 9). The notable exception was FBXO3, a ligase component of the ubiquitination pathway. Transcripts encoding 14 proteinases and 6 inhibitors of proteinases were found among the 1171 genes. The most notable transcript encoding a proteinase inhibitor was α-1-antitrypsin, induced by OS (Fig. 8D). Induction of amyloid βA4 precursor protein (APP) by OS in the lens has been shown.39 Neither caspase-9 nor -3, both enzymes in the top of the mitochondria-directed apoptotic cascade, was among the significantly changed genes.35 The conclusion drawn from expression profiles of these genes is that they are involved in processes favoring cell survival (e.g., α-1-antitrypsin has strong antiapoptotic activity),40 elimination of damaged proteins (e.g., FBX03 belongs to a protein ligase complex promoting ubiquitination and degradation), and mobilization of translational machinery (e.g., increase of transcript levels for elongation factors EEF2 and EIF3S9), in parallel with apparent activation of processes used during the apoptosis.
OS and Other Categories of Genes
The remaining functional categories were also analyzed in a format identical with Figure 9 and the data are displayed on our Web site (www.aecom.yu.edu/thecvekllab).
OS and Cataract
Our previous studies have identified a group of differentially expressed genes in human cataractous epithelia8,10,41 and in an Emory mouse model of age-related cataract.42 A 55-kDa regulatory subunit (R2/B/PR55) of the protein phosphatase 2A (PP2A) is downregulated in human cataractous epithelia.8 PP2A comprises two invariant subunits, A and C, combined with three different regulatory B subunits encoded by separate genes. PP2A is a major phosphatase that regulates a variety of key steps in metabolism, replication, transcription, and cell-cycle control. Recent studies have shown involvement of PP2A in various damage-sensing pathways, including the ionizing radiation.43 Our data show that H2O2 induces expression of the R3/B”/PR72 subunit while reducing expression of the scaffolding subunit A (Fig. 9), raising the possibility that the PP2A-pathway is involved both in the age-related cataract and OS response. More recent data suggest that expression of genes encoding ribosomal subunits (L21, L15, L13a, and L7a) is reduced in cataractous epithelia.41 Our present data indicate downregulation of subunits L18, L29, and S15. Genes encoding L21, L15, and L7a exhibit approximately 25% reduced expression at 1 and 2 hours after the treatment. Because of the strict parameters of SAM, these genes did not qualify for the list of 1171 genes significantly affected by H2O2 treatment. The present data validated by RT-PCR (data not shown) also show H2O2 induction of transcript levels encoding a receptor tyrosine kinase ARK/AXL that correlates with the specific upregulation of this gene in the Emory cataract mouse model.42
OS induces levels of two enzymes, B4GALT1 and MVK (Fig. 9). B4GALT1 encodes an enzyme that uses UDP-galactose as a substrate.22,44 UDP-galactose is formed by GALT1, a central enzyme in galactosidase metabolism. Mutations in GALT1 cause congenital cataracts,45 and disturbed galactose metabolism in elderly and diabetic humans is associated with cataract.46 Two more proteins participating in galactose metabolism through glycosylations, LGALS3 and FUT2, are also affected by OS in lens cells. Defects in cholesterol biosynthesis can also cause cataracts. Mutations in mevalonate kinase are associated with congenital cataracts,47 and mevalonate kinase is also induced by OS.
In conclusion, our study provides a representative global view of the acute response to OS in HLE cells. In contrast to several similar studies of OS and different cell culture models analyzing the apoptotic pathways,48,49 our study focused on successful defense mechanisms. We found multiple novel responses to OS in HLE cells and identified numerous genes for future functional studies. Our data support the idea that OS changes the levels of those specific transcripts and gene expression pathways likely to be involved in lens protection and cataract.4-6,37,49 These transcriptional responses point to candidate genes, the study of which will lead to further understanding of and development of therapies for prevention of numerous OS- and age-related diseases.51
Acknowledgments
The authors thank Geoffrey Childs and Aldo Massimi, AECOM Microarray Core, for support and advice; John Mariadason for annotation of the 9.7-K gene chip according to function; Ronald Burde, Harry Engel, and Raju Kucherlapati for encouragement during the course of the work; Kveta Cveklova for technical assistance; and Dong Lu and Ying Yang for help with the Web page design.
Supported by National Eye Institute Grants EY12200 (AC), EY13022 (MK), and EY00484 (VNR); and the Steiner family to the Department of Ophthalmology. AC is a recipient of a Research to Prevent Blindness Career Development Award.
Footnotes
Disclosure: S. Goswami, None; N.L. Sheets, None; J. Zavadil, None; B.K. Chauhan, None; E.P. Bottinger, None; V.N. Reddy, None; M. Kantorow, None; A. Cvekl, None
References
- 1.Fukagawa NK, Timblin CR, Buder-Hoffman S, Mossman BT. Strategies for evaluation of signaling pathways and transcription factors altered in aging. Antioxidants Redox Signal. 2000;2:379–389. doi: 10.1089/15230860050192152. [DOI] [PubMed] [Google Scholar]
- 2.Rosen P, Nawroth PP, King G, Moller W, Tritschler HJ, Packer L. The role of oxidative stress in the onset and progression of diabetes and its complications: a summary of a Congress Series sponsored by UNESCO-MCBN, the American Diabetes Association and the German Diabetes Society. Diabetes Metab Res Rev. 2001;17:189–212. doi: 10.1002/dmrr.196. [DOI] [PubMed] [Google Scholar]
- 3.Beatty S, Koh H, Phil M, Henson D, Boulton M. The role of oxidative stress in the pathogenesis of age-related macular degeneration. Surv Ophthalmol. 2000;45:115–134. doi: 10.1016/s0039-6257(00)00140-5. [DOI] [PubMed] [Google Scholar]
- 4.Spector A. Oxidative stress-induced cataract: mechanism of action. FASEB J. 1995;9:1173–1182. [PubMed] [Google Scholar]
- 5.Giblin FJ. Glutathione: a vital lens antioxidant. J Ocul Pharmacol Ther. 2000;16:121–135. doi: 10.1089/jop.2000.16.121. [DOI] [PubMed] [Google Scholar]
- 6.Phelps Brown N, Bron AJ. Lens Disorder. Butterworth-Heinemann; Oxford, UK: 1996. [Google Scholar]
- 7.Horwitz J. Alpha-crystallin can function as a molecular chaperone. Proc Natl Acad Sci USA. 1992;89:10449–10453. doi: 10.1073/pnas.89.21.10449. [DOI] [PMC free article] [PubMed] [Google Scholar]
- 8.Kantorow M, Kays T, Horwitz J, et al. Differential display detects altered gene expression between cataractous and normal human lenses. Invest Ophthalmol Vis Sci. 1998;39:2344–2354. [PubMed] [Google Scholar]
- 9.Allen RG, Tresini M. Oxidative stress and gene regulation. Free Radic Biol Med. 2000;28:463–499. doi: 10.1016/s0891-5849(99)00242-7. [DOI] [PubMed] [Google Scholar]
- 10.Oppermann B, Zhang W, Magabo K, Kantorow M. Identification and spatial analysis of metallothioneins expressed by the adult human lens. Invest Ophthalmol Vis Sci. 2001;42:188–193. [PMC free article] [PubMed] [Google Scholar]
- 11.Xing KY, Lou MF. Effect of H(2)O(2)on human lens epithelial cells and the possible mechanism for oxidative damage repair by thiol-transferase. Exp Eye Res. 2002;74:113–122. doi: 10.1006/exer.2001.1103. [DOI] [PubMed] [Google Scholar]
- 12.Reddan JR, Steiger CA, Dziedzic DC, Gordon SR. Regional differences in the distribution of catalase in the epithelium of the ocular lens. Cell Mol Biol. 1996;42:209–219. [PubMed] [Google Scholar]
- 13.Spector A, Kuszak JR, Ma W, Wang RR. The effect of aging on glutathione peroxidase-i knockout mice-resistance of the lens to oxidative stress. Exp Eye Res. 2001;72:533–545. doi: 10.1006/exer.2001.0980. [DOI] [PubMed] [Google Scholar]
- 14.Delamere NA, Manning RE, Jr, Liu L, Moseley AE, Dean WL. Na,K-ATPase polypeptide upregulation responses in lens epithelium. Invest Ophthalmol Vis Sci. 1998;39:763–768. [PubMed] [Google Scholar]
- 15.Li DW, Spector A. Hydrogen peroxide-induced expression of the proto-oncogenes, c-jun, c-fos and c-myc in rabbit lens epithelial cells. Mol Cell Biochem. 1997;173:159–169. doi: 10.1023/a:1006828402225. [DOI] [PubMed] [Google Scholar]
- 16.Kodama T, Mizobuchi M, Takeda R, Torikai H, Shinomiya H, Ohashi Y. Hampered expression of isoaspartyl protein carboxyl methyltransferase gene in the human cataractous lens. Biophys Biochim Acta. 1995;1245:269–272. doi: 10.1016/0304-4165(95)00092-p. [DOI] [PubMed] [Google Scholar]
- 17.Cheung VG, Morley M, Aguilar F, Massimi A, Kucherlapati R, Childs G. Making and reading microarrays. Nat Genet. 1999;21S:15–19. doi: 10.1038/4439. [DOI] [PubMed] [Google Scholar]
- 18.Gershon D. Toxicogenomics gains impetus. Nature. 2002;415(suppl):4–5. doi: 10.1038/nj6869-04a. [DOI] [PubMed] [Google Scholar]
- 19.Yang YH, Speed T. Design issues for the cDNA microarray experiments. Nat Rev Genet. 2002;3:579–588. doi: 10.1038/nrg863. [DOI] [PubMed] [Google Scholar]
- 20.Tusher VG, Tibshirani R, Chu G. Significance analysis of microarrays applied to the ionizing radiation response. Proc Natl Acad Sci USA. 2001;98:5116–5121. doi: 10.1073/pnas.091062498. [DOI] [PMC free article] [PubMed] [Google Scholar]
- 21.Hoppe-Seyler F, Butz K, Rittmuller C, von Knebel Doeberitz M. A rapid microscale procedure for the simultaneous preparation of cytoplasmic RNA, nuclear DNA binding proteins and enzymatically active luciferase extracts. Nucleic Acids Res. 1991;19:5080. doi: 10.1093/nar/19.18.5080. [DOI] [PMC free article] [PubMed] [Google Scholar]
- 22.Li R, Huang L, Guo H, Toole BP. Basigin (murine EMMPRIN) stimulates matrix metalloproteinase production by fibroblasts. J Cell Physiol. 2001;186:371–379. doi: 10.1002/1097-4652(2000)9999:999<000::AID-JCP1042>3.0.CO;2-8. [DOI] [PubMed] [Google Scholar]
- 23.Li CY, Lee JS, Ko YG, Kim JI, Seo JS. Heat shock protein 70 inhibits apoptosis downstream of cytochrome c release and upstream of caspase-3 activation. J Biol Chem. 2000;275:25655–25671. doi: 10.1074/jbc.M906383199. [DOI] [PubMed] [Google Scholar]
- 24.Rahman I. Regulation of nuclear factor-κB, activator protein-1, and glutathione levels by tumor necrosis factor-α and dexamethasone in alveolar epithelial cells. Biochem Pharmacol. 2000;60:1041–1049. doi: 10.1016/s0006-2952(00)00392-0. [DOI] [PubMed] [Google Scholar]
- 25.Lockhart DJ, Winzeler EA. Genomics, gene expression and DNA arrays. Nature. 2000;405:827–836. doi: 10.1038/35015701. [DOI] [PubMed] [Google Scholar]
- 26.Pomeroy SL, Tamayo P, Gaasenbeek M, et al. Prediction of central nervous system embryonal tumour outcome based on gene expression. Nature. 2002;415:436–442. doi: 10.1038/415436a. [DOI] [PubMed] [Google Scholar]
- 27.Gerstein M, Jansen R. The current excitement in bioinformatics-analysis of whole-genome expression data: how does it relate to protein structure and function? Curr Opin Struct Biol. 2000;10:574–584. doi: 10.1016/s0959-440x(00)00134-2. [DOI] [PubMed] [Google Scholar]
- 28.Mariadason JM, Arango D, Corner GA, et al. A gene expression profile that defines colon cell maturation in vitro. Cancer Res. 2002;62:4791–4804. [PubMed] [Google Scholar]
- 29.Rich T, Allen RL, Wyllie AH. Defying death after DNA damage. Nature. 2000;407:777–783. doi: 10.1038/35037717. [DOI] [PubMed] [Google Scholar]
- 30.Garcia-Higuera I, Taniguchi T, Ganesan S, et al. Interaction of the Fanconi anemia proteins and BRCA1 in a common pathway. Mol Cell. 2001;7:249–262. doi: 10.1016/s1097-2765(01)00173-3. [DOI] [PubMed] [Google Scholar]
- 31.Grompe M, D’Andrea A. Fanconi anemia and DNA repair. Hum Mol Genet. 2001;10:2253–2259. doi: 10.1093/hmg/10.20.2253. [DOI] [PubMed] [Google Scholar]
- 32.Tamatani M, Matsuyama T, Yamaguchi A, et al. ORP150 protects against hypoxia/ischemia-induced neuronal death. Nat Med. 2001;7:317–323. doi: 10.1038/85463. [DOI] [PubMed] [Google Scholar]
- 33.Breakefield XO, Kamm C, Hanson PI. Torsin A: movement at many levels. Neuron. 2001;31:9–12. doi: 10.1016/s0896-6273(01)00350-6. [DOI] [PubMed] [Google Scholar]
- 34.Beere HM, Wolf BB, Cain K, et al. Heat-shock protein 70 inhibits apoptosis by preventing recruitment of procaspase-9 to the Apaf-1 apoptosome. Nature Cell Biol. 2000;2:469–475. doi: 10.1038/35019501. [DOI] [PubMed] [Google Scholar]
- 35.Adrain C, Martin SJ. The mitochondrial apoptosome: a killer unleashed by the cytochrome seas. Trends Biochem Sci. 2001;26:390–397. doi: 10.1016/s0968-0004(01)01844-8. [DOI] [PubMed] [Google Scholar]
- 36.Bartolini F, Bhamidipati A, Thomas S, Schwahn U, Lewis SA, Cowan NJ. Functional overlap between retinitis pigmentosa 2 protein and the tubulin-specific chaperone cofactor C. J Biol Chem. 2002;277:14629–14634. doi: 10.1074/jbc.M200128200. [DOI] [PubMed] [Google Scholar]
- 37.Spector A, Li D, Ma W, Sun F, Pavlidis P. Differential amplification of gene expression in lens cell lines conditioned to survive peroxide stress. Invest Ophthalmol Vis Sci. 2002;43:3251–3264. [PubMed] [Google Scholar]
- 38.Liu H, Bowes RC, III, van de Water B, Sillence C, Nagelkerke JF, Stevens JL. Endoplasmic reticulum chaperones GRP78 and calreticulin prevent oxidative stress, Ca2+ disturbances, and cell death in renal epithelial cells. J Biol Chem. 1997;272:21751–21759. doi: 10.1074/jbc.272.35.21751. [DOI] [PubMed] [Google Scholar]
- 39.Frederikse PH, Garland D, Zigler JS, Jr, Piatigorsky J. Oxidative stress increases production of beta-amyloid precursor protein and beta-amyloid (Abeta) in mammalian lenses, and Abeta has toxic effects on lens epithelial cells. J Biol Chem. 1996;271:10169–10174. doi: 10.1074/jbc.271.17.10169. [DOI] [PubMed] [Google Scholar]
- 40.Ikari Y, Mulvihill E, Schwartz SM. alpha 1-Proteinase inhibitor, alpha 1-antichymotrypsin, and alpha 2-macroglobulin are the antiapoptotic factors of vascular smooth muscle cells. J Biol Chem. 2001;276:11798–11803. doi: 10.1074/jbc.M008503200. [DOI] [PubMed] [Google Scholar]
- 41.Zhang W, Hawse J, Huang Q, et al. Decreased expression of ribosomal proteins in human age-related cataract. Invest Ophthalmol Vis Sci. 2002;43:198–204. [PMC free article] [PubMed] [Google Scholar]
- 42.Sheets NL, Chauhan BK, Wawrousek E, Hejtmancik JF, Cvekl A, Kantorow M. Cataract- and lens-specific upregulation of ARK receptor tyrosine kinase in Emory mouse cataract. Invest Ophthalmol Vis Sci. 2002;43:1870–1875. [PMC free article] [PubMed] [Google Scholar]
- 43.Li X, Scuderi A, Letsou A, Virshup DM. B56-associated protein phosphatase 2A is required for survival and protects from apoptosis in Drosophila melanogaster. Mol Cell Biol. 2002;22:3674–3684. doi: 10.1128/MCB.22.11.3674-3684.2002. [DOI] [PMC free article] [PubMed] [Google Scholar]
- 44.Amado M, Almeida R, Schwientek T, Clausen H. Identification and characterization of large galactosyltransferase gene families: galactosyltransferases for all functions. Biochim Biophys Acta. 1999;1473:35–53. doi: 10.1016/s0304-4165(99)00168-3. [DOI] [PubMed] [Google Scholar]
- 45.Stambolian D, Ai Y, Sidjanin D, et al. Cloning of the galactokinase cDNA and identification of mutations in two families with cataracts. Nat Genet. 1995;10:307–312. doi: 10.1038/ng0795-307. [DOI] [PubMed] [Google Scholar]
- 46.Birlouez-Aragon I, Ravelontseheno L, Villate-Cathelineau B, Cathelineau G, Abitbol G. Disturbed galactose metabolism in elderly and diabetic humans is associated with cataract formation. J Nutr. 1993;123:1370–1376. doi: 10.1093/jn/123.8.1370. [DOI] [PubMed] [Google Scholar]
- 47.Hoffmann GF, Charpentier C, Mayatepek E, et al. Clinical and biochemical phenotype in 11 patients with mevalonic aciduria. Pediatrics. 1993;91:915–921. [PubMed] [Google Scholar]
- 48.Li J, Lee JM, Johnson JA. Microarray analysis reveals an antioxidant responsive element-driven gene set involved in conferring protection from an oxidative stress-induced apoptosis in IMR-32 cells. J Biol Chem. 2002;277:338–394. doi: 10.1074/jbc.M109380200. [DOI] [PubMed] [Google Scholar]
- 49.Carper DA, Sun JK, Iwata T, et al. Oxidative stress induces differential gene expression in a human lens epithelial cell line. Invest Ophthalmol Vis Sci. 1999;40:400–406. [PubMed] [Google Scholar]
- 50.Ottonello S, Foroni C, Carta A, Petrucco S, Maraini G. Oxidative stress and age-related cataract. Ophthalmologica. 2000;214:78–85. doi: 10.1159/000027474. [DOI] [PubMed] [Google Scholar]
- 51.Taylor A, Hobbs M. assessment of nutritional influences on risk for cataract. Nutrition. 2001;2001;17:845–857. doi: 10.1016/s0899-9007(01)00655-4. [DOI] [PubMed] [Google Scholar]