

SUMMARY
Association of the 30S initiation complex (30SIC) and the 50S ribosomal subunit, leading to formation of the 70S initiation complex (70SIC), is a critical step of the translation initiation pathway. The 70SIC contains initiator tRNA, fMet-tRNAfMet, bound in the P (peptidyl)-site in response to the AUG start codon. We have formulated a quantitative kinetic scheme for the formation of an active 70SIC from 30SIC and 50S subunits on the basis of parallel rapid kinetics measurements of GTP hydrolysis, Pi release, light scattering, and changes in fluorescence intensities of fluorophore-labeled IF2 and . According to this scheme, an initially formed labile 70S complex, which promotes rapid IF2-dependent GTP hydrolysis, either dissociates reversibly into 30S and 50S subunits or is converted to a more stable form, leading to 70SIC formation. The latter process takes place with intervening conformational changes of ribosome-bound IF2 and fMet-tRNAfMet, which are monitored by spectral changes of fluorescent derivatives of IF2 and fMet-tRNAfMet. The availability of such a scheme provides a useful framework for precisely elucidating the mechanisms by which substituting the nonhydrolyzable analogue GDPCP for GTP or adding thiostrepton inhibit formation of a productive 70SIC. GDPCP does not affect stable 70S formation, but perturbs fMet-tRNAfMet positioning in the P-site. In contrast, thiostrepton severely retards stable 70S formation, but allows normal binding of fMet-tRNAfMet(prf20) to the P-site.
Keywords: translation initiation complex, kinetic scheme, IF2, fMet-tRNAfMet, thiostrepton
INTRODUCTION
Association of the “30S initiation complex” (30SIC) and the 50S ribosomal subunit, leading to formation of the “70S initiation complex” (70SIC), is a critical step of the translation initiation pathway. The 70SIC contains initiator tRNA, fMet-tRNAfMet, bound in the P (peptidyl)-site in response to the AUG start codon. The first peptide bond is formed by the transfer of fMet to aminoacyl-tRNA bound to the A (aminoacyl) site of the 70SIC in an EF-Tu.GTP-dependent step specified by the second mRNA codon. Both the fidelity and speed of 70SIC formation require the presence of initiation factors IF1, IF2, and IF3. The guanine nucleotide binding protein IF2 plays a crucial role, interacting directly with fMet-tRNAfMet, favoring its decoding in the P-site and physically linking the 30S and 50S subunits (for reviews see references 1 - 5).
The primary goal of this study is to formulate a quantitative kinetic scheme for the complex, multistep process by which 70SIC is formed from 30SIC. Partial kinetic schemes for 70SIC formation have previously been formulated on the basis of rapid kinetics measurements of GTP hydrolysis and Pi release6 or subunit association by light scattering7,8. Here we combine these three with two additional rapid kinetics measurements made during 70SIC formation: the changes in fluorescence intensity, occurring during the association between a 30SIC and 50S subunit, of i) a coumarin derivative of B. stearothermophilus IF2, placed in position 451 within domain III9, in a region referred to as sub-domain G310 and denoted IF2C, and ii) a proflavin derivative of E. coli fMet-tRNAfMet, placed in position 20 of the D-loop, and denoted fMet-tRNAfMet (prf 20).
The availability of such a scheme provides a useful framework for precisely elucidating both the role, if any, of IF2-dependent GTP hydrolysis in 70SIC formation and the mechanism by which the antibiotic thiostrepton (ThS), a potent inhibitor of translation, interferes with IF2 function in 70SIC formation11-13. ThS binds to the L11 domain (consisting of L11 and 23S RNA helices 42 − 4414,15), and it is believed that such binding interferes with the IF2 - L11 domain interaction13 that forms part of the IF2 binding site within the ribosome13,16.
In the accompanying paper17 this approach is extended to elucidate the mechanism by which IF3 inspects the correctness of the codon-anticodon interaction at the incipient P-site during 70SIC formation, as part of its well established role of ensuring the fidelity of translation initiation and start codon selection1, 5.
RESULTS
IF2 is known to interact with 30S and 50S subunits separately18. Before presenting results of experiments in which IF2C was used to study 70SIC formation, we first determined relevant rate and equilibrium constants for IF2C interaction with 30SIC* (defined as an 30SIC lacking IF2·GTP) and with 50S subunits.
IF2C·GXP binding to 30SIC*
IF2C·GTP binding to 30SIC* proceeds via a two-phase reaction, with each phase leading to a fluorescence increase (Figure 1A). Fitting these results to a simple two-step scheme leads to the rate constants listed in Table 1 and a calculated overall Kd (= k−1k−2/k1k2) of 2.1 nM. A plot of the near-final fluorescence change values reached in Figure 1A as a function of the 30SIC*/IF2 ratio provides a clear demonstration of the tightness of IF2C binding, which is essentially stoichiometric at 0.15 μM 30SIC* (Figure 1B). Replacement of GTP by GDPCP led to a similar biphasic reaction but with weaker overall binding (Figure 1C), whereas when GTP was replaced by GDP there was a single phase of reaction and still weaker binding (Figure 1D). The relevant apparent rate and equilibrium constants are listed in Table 1. The fluorescence changes associated with the first phase of IF2C·GTP and IF2C·GDPCP binding and with the single phase of IF2C·GDP binding are similar, suggesting that the second phase is due to differences between the structures of the ribosomal complexes formed by IF2·GTP and IF2·GDPCP on the one hand and by IF2·GDP on the other. The Kd values for the GTP and GDP complexes listed in Table 1 are qualitatively consistent with previous results showing, using a cosedimentation assay, that IF2·GTP binds considerably more tightly to vacant 30S subunits than does IF2·GDP18.
Figure 1. IF2C binding to 30SIC*.
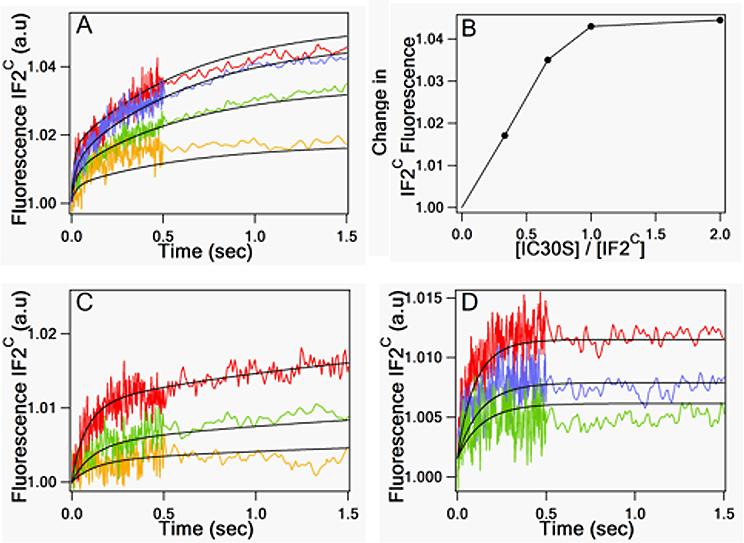
In (A), (C), and (D), IF2C was preincubated with GXP for 15 min at 37°C, and then rapidly mixed with increasing concentrations of 30SIC*. Final concentrations of 30S were: yellow traces, 0.05 μM; green traces, 0.1 μM; blue traces, 0.15 μM; red traces, 0.30 μM. 30SIC* contained, relative to 30S subunit, 1.5 equivalents of IF1, IF3, and fMet-tRNAfMet and 3.0 equivalents of AUG022mRNA. Final concentrations of IF2C and GXP were 0.15 μM and 100 μM, respectively. Solid lines through traces in (A), (C), and (D) are the results of global fitting to the one and two step binding schemes shown in Table 1. (A) In the presence of GTP. (B) Change in IF2C fluorescence in (A) (measured at 1.5 s) as a function of [30SIC*]/ [IF2C]. These results are best fit assuming saturation at a 30SIC*/IF2 ratio of 0.9. The deviation from 1.0 is due to imprecision in the estimated concentrations of both IF2 and 30SIC*. (C) In the presence of GDPCP. (D) In the presence of GDP.
Table 1.
Rate and equilibrium constants for IF2 interaction with 30SIC* or 50S Rate constants were determined by fitting the data presented in Figure 1A, C, and D and Figure 2E to the mono- or biphasic kinetic schemes shown below, as described (see Experimental).
| GTP, 30SIC* | GDPCP, 30SIC* | GDP, 30SIC* | GDP, 50S | |
|---|---|---|---|---|
| Kd | 2.1 ± 0.5 nM | 62 ± 7 nM | 190 ± 15 nM | 2.0 ± 0.2 μM |
| k1 | 290 ± 10 μM−1s−1 | 32 ± 1 μM−1s−1 | 18 ± 1 μM−1s−1 | 1.6 ± 0.1 μM−1s−1 |
| k-1 | 1.2 ± 0.1 s−1 | 2.7 ± 0.2 s−1 | 3.5 ± 0.1 s−1 | 3.2 ± 0.1 s−1 |
| k2 | 1 ± 0.1 s−1 | 0.32 ± 0.02 s−1 | ||
| k-2 | 0.5 ± 0.1 s−1 | 0.27 ± 0.02 s−1 |
Interaction of IF2C·GTP and IF2C·GDP with 50S subunit
IF2·GTP binding to 50S subunits is accompanied by a biphasic change in IF2C fluorescence, rapid GTP hydrolysis, and much slower Pi release (Figure 2A). Each of these three processes was further examined as a function of 50S concentration (Figure 2B-D). IF2C fluorescence increase was also used to examine IF2C·GDP binding to 50S subunits (Figure 2E). The results obtained allow us to formulate a quantitative kinetic model (Scheme 1) which accounts for all of the data presented in Figure 2. According to Scheme 1, an initial very rapid binding of IF2C to the 50S subunit (step 1) is followed by rapid GTP hydrolysis (step 2), and by two steps that each result in an increase in IF2C fluorescence intensity: a conformational change that follows GTP hydrolysis (step 3) and a considerably slower Pi release (step 4). IF2·GTP binds more tightly to 50S subunits (Kd, 0.4 μM) than IF2·GDP (Kd, 2.0 μM) although the difference is less marked than the 100-fold factor found for 30SIC.
Figure 2. Kinetic measures of IF2·GTP interaction with the 50S subunit.
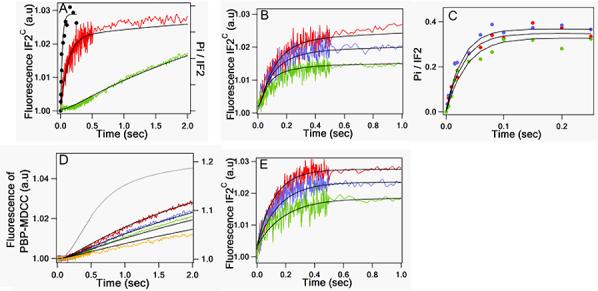
IF2 was pre-incubated with GTP or GDP for 15 min at 37 °C prior to rapid combination with varying concentrations of 50S subunits. In figures B-E, 50S concentrations were: green traces, 1.2 μM; blue traces, 2.0 μM; red traces 3.0 μM. No Pi was released over this time scale when IF2 was rapidly mixed with GTP in the absence of 50S. All concentrations are final after mixing. (A) 50S subunit, 3.0 μM; IF2c fluorescence (red trace) 0.15 βM IF2, 100 μM GTP; GTPase (black trace) 0.3 μM IF2, and 36 μM GTP: the plateau stoichiometry of Pi formation was 0.4/IF2, with the low stoichiometry attributable to surface inactivation of IF2. Pi release (green trace) 0.45,μM IF2, 100 μM GTP. (B) IF2C fluorescence; IF2C, 0.15μM; GTP, 100μM. (C) GTPase; IF2, 0.3μM; GTP 36μM. (D) Pi release; IF2, 0.45 μM; GTP, 100 μM. The grey trace is recapitulated from Figure 3, showing Pi release during 70SIC formation at 3.0 μM 50S. Note the difference in vertical scales for Pi release from 50S (left) and from 70SIC (right). (E) IF2C fluorescence; IF2C, 0.15μM; GDP, 100μM. For (A) – (D), solid lines through experimental traces for 50S experiments are the results of global fitting to Scheme 1. The solid lines in (E) are fit to a one-step binding reaction.
SCHEME 1.

IF2.GTP interaction with 50S subunits
IF2C forms functional 70SIC complexes
Upon addition of a Phe-tRNAPhe·EF-Tu·GTP ternary complex to a functional 70SIC, a dipeptidyl-tRNA (fMetPhe-tRNAPhe) is rapidly formed. As shown in Figure 3, 70SIC complexes formed using either the underivatized IF2V451C variant or IF2C undergo such reaction with the same apparent rate constant (0.20 ± 0.03 s−1) which, in turn, is indistinguishable from that measured earlier with B. stearothermophilus wt-IF2 under similar conditions6. This rather slow rate may be linked to the tight binding of B. stearothermophilus IF2.GDP to the 70SIC. A much faster rate of dipeptide formation is seen when E. coli IF2, which does not bind as tightly, replaces B. stearothermophilus IF2 (Qin, H., Grigoriadou, C. and Cooperman, B. S., in preparation).
Figure 3. Dipeptide formation measured by quenched flow.
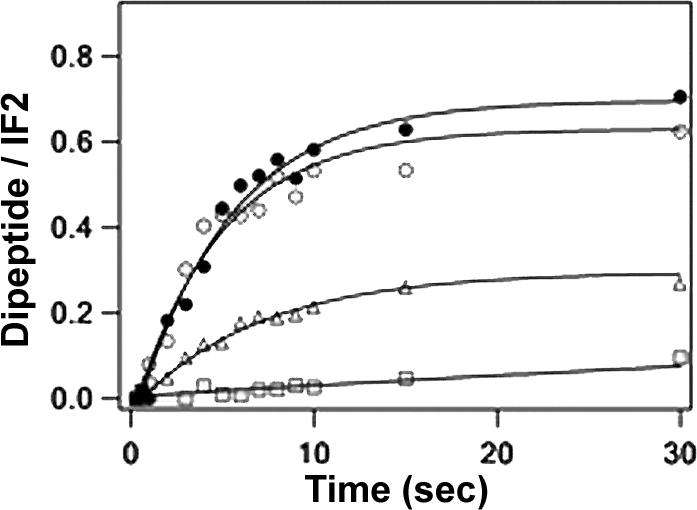
30SIC formed in the presence of GTP using either IF2 (solid circles) or IF2C (open circles) was rapidly mixed with a solution containing 50S subunit and ternary complex in the absence or presence of thiostrepton. The triangles show the results of replacing GTP with GDPCP. The squares show the results of adding 3.0 μM thiostrepton. Concentrations were: 30S, 0.3 μM; IF1, IF3 and fMet-tRNAfMet, 0.45 μM; IF2, 0.15 μM; AUG022mRNA, 0.9 μM; GTP, 200 μM; 50S, 0.5 μM; EF-Tu, 2.0 μM; [3H]-Phe-tRNA, 1.0 μM; phosphoenol pyruvate, 0.5 mM; pyruvate kinase, 0. 18μg/ml. All concentrations are final after mixing. The solid lines are fit to an apparent one-step reaction with Igor-Pro.
Rapid kinetic measurements of 70SIC formation from 30SIC as a function of 50S concentration
Following rapid mixing of 30SIC with 50S subunit, light scattering increases as a result of 70S ribosome formation (Figure 4A). The increase is biphasic with time, and becomes more rapid and complete with increasing 50S concentration over the range shown. The apparent rate constant for the first phase of reaction has a linear dependence on 50S concentration (Figure 4B), demonstrating that it corresponds to 50S binding to 30SIC, with an association rate constant of 34 μM−1s−1 and a dissociation rate constant of 35 s−1. On the other hand, the apparent second phase rate constant clearly saturates as a function of 50S concentration. As more fully explained below, the two phases are indicative of an initially formed labile 70S particle (first phase) that is converted to a more stable form (second phase). In agreement with recent results of others7,8, 70S formation is totally dependent upon the presence of both IF2 and fMet-tRNAfMet.
Figure 4. Kinetics of light scattering changes upon 70S formation.
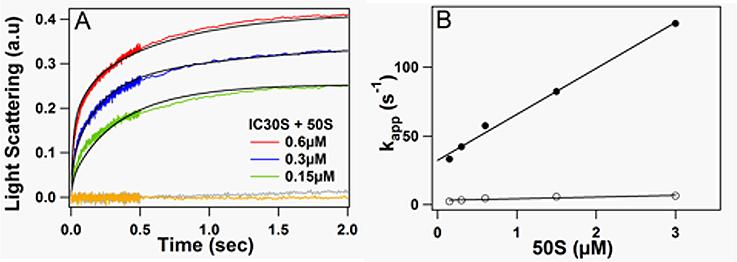
(A) 30SIC was rapidly mixed with varying amounts of 50S subunits. Final 50S concentrations for red, green and blue traces are indicated. Except as otherwise indicated, the final concentrations of 30SIC components were: 30S, 0.3μM; IF1, IF3 and fMet-tRNAfMet, 0.45μM; IF2, 0.15μM; AUG022mRNA, 0.9μM; and GTP, 100μM. The grey and orange traces were obtained in the presence of 3.0 μM 50S and in the absence of either IF2 or initiator tRNA, respectively. Very similar results were obtained when E. coli IF2α replaced B. stearothermophilus IF2. Solid lines through experimental traces are the results of global fitting to Scheme 2. (B) Dependence of apparent rate constants for phases 1 (closed circles) and 2 (open circles) on 50S concentration (phase 1: intercept = 32 ± 2 s−1, slope 33 ± 1.5 μM−1s−1; phase 2: limiting value 7 ± 1 s−1.
Parallel measurements of IF2C fluorescence changes occurring upon rapid mixing of 30SIC with 50S subunits are displayed in Figure 5. The observed fluorescence changes, corrected for the light scattering increase which also accompanies such mixing (Figure 4), is triphasic (Figure 5A), with two initial increases followed by a decrease. The evolution of fluorescence change depends on 50S concentration (Figure 5B). The first and second phases of IF2C fluorescence change show very similar dependence on 50S concentration as seen for light scattering change, with essentially identical rate constants (Figure 5C), and can be attributed to conformational changes in IF2 associated with initial formation of a 70S complex followed by rearrangement of that complex, respectively. The magnitude of the decrease seen in the third phase is also strongly dependent upon 50S concentration (Figure 5B), a point we return to below.
Figure 5. Kinetics of IF2C fluorescence change upon 70S initiation complex formation.
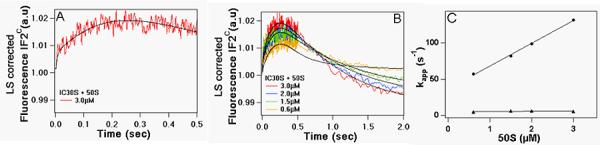
30SIC was rapidly mixed with varying amounts of 50S subunits. Final concentrations of 30SIC components after mixing were: 30S, 0.3μM; IF1, IF3 and fMet-tRNAfMet, 0.45μM; IF2C, 0.15μM; AUG022mRNA, 0.9μM; GTP, 100μM. (A) Triphasic change, [50S] = 3.0 μM. (B) as a function of [50S]. Solid lines through experimental traces are the results of global fitting to Scheme 2. (C) Plots of kapp1 (λ) and kapp2 (σ) for the first two phases of IF2C fluorescence change vs. [50S].
Release of Pi takes place after a distinct lag phase following rapid mixing of 30SIC with 50S subunit, in agreement with prior results6, and displays only weak dependence on 50S concentration (Figure 6). The rate of Pi release from 70SIC is considerably higher than the rate of Pi release following GTP hydrolysis on the isolated 50S subunit (Figure 2D). This difference may be related to the conformational changes in IF2 bound within the 70S ribosome following GTP hydrolysis and Pi release that have been observed by cryoelectron microscopy16.
Figure 6. Kinetics of Pi release upon 70S formation as a function of 50S subunit concentration.
30SIC was rapidly mixed with 50S subunits. Final concentrations of 30SIC components after mixing were: 30S, 0.3 μM; IF1, IF2, IF3 and fMet-tRNAfMet, 0.45 μM; AUG022mRNA, 0.9 μM; and GTP, 100μM. Final 50S concentrations are indicated. Very similar results were obtained when E. coli IF2α replaced B. stearothermophilus IF2. Solid lines through experimental traces are the results of global fitting to Scheme 2.
Direct comparisons of rapid kinetic measurements
The time-dependent changes of the three observables described in Figures 4-6 are directly compared at the same 50S concentration to measurements of single-turnover GTPase and fMet-tRNAfMet(prf 20) fluorescence change (Figure 7). The latter proceeds in three phases, with rapid and slow increases separated by an intermediate phase in which little or no change occurs. Beginning with the more rapid reactions, it can be seen (Figure 7A) that i) GTPase reaches completion first; ii) the GTPase rate is slower than the apparent rates of the first phases of light scattering, IF2C fluorescence change and fMet-tRNAfMet(prf 20) fluorescence change and comparable to the apparent net rate for the first two phases of IF2C fluorescence change; and iii) the second phase of light scattering increase proceeds more slowly than GTPase. The three slower processes, comprising the third phase of IF2C fluorescence change, Pi release, and fMet-tRNAfMet (prf 20) fluorescence increase, all proceed at comparable rates (Figure 7B), although the latter is slightly faster. That fMet-tRNAfMet (prf20) is fully functional in 70SIC formation has been shown elsewhere19.
Figure 7. Direct comparison of rapid kinetic measures accompanying 70SIC formation.

All concentrations are final after mixing. In each experiment, 50S concentration was 3 μM. IF2c fluorescence corrected for light scattering (red traces); Concentrations of 30SIC components were: 30S, 0.3 μM; IF1, IF3 and fMet-tRNAfMet, 0.45 μM; IF2C, 0.15 μM; AUG022mRNA, 0.9 μM; GTP, 100 μM. Light scattering (blue traces); concentrations were the same as for IF2C fluorescence, with IF2 replacing IF2C. GTPase (black traces and solid circles); concentrations were the same as for light scattering with the following differences: 30S, 0.45 μM; IF2, 0.3 μM; GTP, 36 μM.; Pi release (green traces); concentrations were the same as for light scattering except for IF2 (0.45 μM). fMet-tRNAfMet(prf 20) fluorescence (orange traces); concentrations are the same as for Pi release, but with fMet-tRNAfMet (prf20) 0.18μM, replacing fMet-tRNAfMet. (A) Early time period; (B) Extended time period. For convenience of presentation, the rapid initial phase of fMet-tRNAfMet (prf20) fluorescence change on mixing with 50S subunits is not shown. The plateau stoichiometries of Pi formation and release were both 0.8 ± 0.1/IF2. Solid lines through experimental traces are the results of global fitting to Scheme 2.
A quantitative kinetic scheme for 70SIC formation
The results presented in Figures 4 - 7 permit formulation of a kinetic model describing the mechanism of 70SIC formation (Scheme 2), with the rate constants shown. In Scheme 2, the binding of 50S to 30SIC to form the 70S·IF2B·GTP·fMet-tRNAO complex (step 1), as measured by the first phases of light scattering and IF2C and fMet-tRNAfMet(prf20) fluorescence change, is followed by rapid GTP hydrolysis (step 2), yielding the complex, 70S·IF2B·GDP.Pi·fMet-tRNAO. This complex then partitions, either reversibly dissociating to the 30S·IF2A'·GDP.Pi·fMet-tRNAN' complex and free 50S subunits (step 2') or undergoing a conformational change to form 70S·IF2C·GDP.Pi·fMet-tRNAO (step 3), the latter being monitored by the second phase of IF2C fluorescence change. Step 3 is followed by a conformational change within ribosome-bound initiator tRNA (step 4), which is essentially the rate-determining step for 70SIC formation, and is measured by a marked increase in fMet-tRNAfMet(prf20) fluorescence, presumably reflecting movement into the P-site. Such movement would i) likely follow the loss of IF3-fMet-tRNAfMet interactions that appear to be present in a cryoelectronmicroscopy reconstruction of an IF2-GDPNP-stalled 70S complex20, and ii) be accompanied by the loss of IF2 association, via the C-terminal half of domain IV (sub-domain C-2) with the acceptor end of fMet-tRNA16, 21. Ternary complex, EF-Tu·GTP·aa-tRNA, is shown as binding directly to the 70S·IF2D·GDP·fMet-tRNAP initiation complex in Scheme 2, based on recent evidence from our laboratory (Qin, H., Grigoriadou, C. and Cooperman, B. S., in preparation) that such binding occurs with IF2·GDP still bound to the ribosome.
SCHEME 2.

70SIC Formation
Partitioning of the 70S·IF2B·GDP.Pi·fMet-tRNAQ complex between the dissociation step 2' and step 3 is consistent with the observed dependence of the rate of the second phase of IF2C fluorescence change on 50S concentration, since higher 50S concentration should favor step 3. In contrast, the rates of fMet-tRNAfMet(prf20) fluorescence change and of Pi release show little dependence on 50S concentration, strongly suggesting that the 70S complexes following step 3 dissociate less readily into 30S and 50S subunits. Thus, the IF2B to IF2C conformational change appears to coincide with a tightening of the 30S:50S interaction.
We attribute most or all of the third phase of IF2C fluorescence change (Figure 5), corresponding to a decrease in fluorescence intensity, to competition by 50S subunits, present in excess, for binding the IF2C·GDP formed during 70SIC formation via steps 5' and 5”. This attribution is consistent with i) the relative fluorescence intensities of IF2C·GDP bound to 70SIC (1.15) and to 50S subunits (1.05), setting the value for IF2C·GDP equal to 1.00; ii) the expected weaker binding of IF2 within the 70SIC complex following hydrolysis of IF2·GTP to IF2·GDP16,18,20; and iii) the rate and affinity characterizing IF2C·GDP binding to 50S subunits (Figure 2).
A potential objection to our interpretation of light scattering changes via Scheme 2 is that the biphasic increase, rather than being intrinsic to the mechanism of 30S + 50S association, represents a heterogeneity artifact, in which some 30SICs bind more rapidly to 50S and others bind more slowly. While it is difficult to totally exclude this possibility for a multimolecular entity with the complexity of a 30SIC, there are several reasons for believing that this is not so. Thus, heterogeneity cannot be due to partial binding of either IF2 or fMet-tRNAfMet, since each is required for 70S formation (Figure 4A). Similarly, light scattering kinetics experiments (Figure 4) were conducted at IF1, IF3, and mRNA concentrations that were demonstrated to be saturating, making it unlikely that heterogeneity would arise from partial binding of any one of these components. In addition, GTP hydrolysis proceeds via a single phase that is considerably more rapid than the second phase of light scattering change: i.e., there is no second phase of GTP hydrolysis that could be attributed to a slower binding fraction of the 30SIC preparation.
Finally, we note that formulation of Scheme 2 on the basis of changes observed in Figures 4 – 7 assumes no contribution to these changes from reactions of the 50S·IF2·GTP complex (Figure 2), which could in principle be formed via dissociation of IF2·GTP from 30SIC followed by IF2.GTP binding to the 50S subunit. This assumption is fully justified, since the rate of formation of 50S·IF2·GTP by this route, which can be predicted utilizing the rate constants for IF2·GTP dissociation from 30SIC (Table 1) and 50S subunit interaction with IF2·GTP (Scheme 1), is far from competitive with 50S binding to 30SIC to form 70S·IF2B·GTP·fMet-tRNAO (Scheme 2).
Replacement of GTP by GDPCP
Scheme 2 provides a useful framework for investigating the effects of replacing GTP by the nonhydrolyzable analogue GDPCP. In agreement with previous results6 replacement of GTP by GDPCP during 70SIC formation had very little effect on either the magnitude or the rate of observed light scattering changes (data not shown). In contrast, such substitution results in significant differences in the fluorescence changes observed with both IF2C and fMet-tRNAfMet (prf 20) (Figure 8).
Figure 8. Effect of GDPCP on 70SICS formation.

All concentrations are final after mixing. Experiments were carried out in the presence of 100 μM GTP (red traces) or GDPCP (grey traces). (A) IF2c fluorescence corrected for light scattering; the concentrations of 30SIC components were: 30S, 0.3μM; IF1, IF3 and fMet-tRNAfMet, 0.45 μM; IF2C, 0.15 μM; AUG022mRNA, 0.9 μM. 50S concentration was 3.0 μM (B) fMet-tRNAfMet(prf 20) fluorescence; concentrations were the same as in (A) except that IF2 (0.45 μM) replaced IF2C and fMet-tRNAfMet (prf20) (0.18μM) replaced fMet-tRNAfMet. 50S was 1.2 μM. Inset shows expanded time scale. As in Figure 7B, the rapid initial phase of fMet-tRNAfMet (prf20) fluorescence change on mixing with 50S subunits is not shown.
In particular, the magnitude of the 2nd phase of the IF2C fluorescence intensity increase is much reduced, indicating that the conformational change in 70S-bound IF2C that normally accompanies step 3 is incomplete (Figure 8A). The magnitude of the third phase decrease, most of which is due to competition by 50S subunits with 70S ribosomes for IF2C binding, is also reduced, suggesting that IF2·GDPCP dissociates less readily from 70S ribosomes than does IF2·GDP. This is consistent with both recent experiments from this laboratory directly investigating this point (Qin, H., Grigoriadou, C. and Cooperman, B. S., in preparation) and cryoelectronmicroscopy results16.
The fluorescence increase in fMet-tRNAfMet(prf 20) corresponding to the putative movement of fMet-tRNAfMet into the P-site is retained (Figure 8B), but comes after a lag period that is longer than that seen in the presence of GTP. Moreover, in the presence of GDPCP, the fluorescence increase in fMet-tRNAfMet(prf 20) is followed by a decrease which is not seen with GTP. This is due either to a further movement of the initiator tRNA on the ribosomal surface, or to its partial dissociation from the ribosome. Either one of these possibilities could be consistent with the observation that substitution of GDPCP for GTP leads to a severe reduction of the stoichiometry of dipeptide formation (Figure 3), paralleling earlier results with non-hydrolyzable GTP analogues22, 23.
Thiostrepton (ThS) effects
Scheme 2 also provides a useful framework for elucidating the effect of thiostrepton on IF2 promotion of 70SIC formation. The changes resulting from adding ThS on the five rapid kinetic measures employed in this work (Figure 9) indicates that its main inhibitory effect is on step 3, inhibiting the IF2 conformational change that normally accompanies conversion of the 70S.IF2B.GDP.Pi.fMet-tRNAfMetO complex into the 70S.IF2C.GDP.Pi.fMet-tRNAfMetO complex, and inducing dissociation of the 70S.IF2B.GDP.Pi.fMet-tRNAfMetO complex into 30S and 50S subunits via step 2'. In accord with this suggestion, GTP hydrolysis, which proceeds via steps 1 and 2, is little affected by ThS addition (Figure 9C), whereas the 2nd phase of IF2 conformational change appears to be suppressed (Figure 9A). Moreover, although ThS inhibition of step 3 would, by itself, increase dissociation of the 70S.IF2B.GDP.Pi.fMet-tRNAfMetO complex via step 2', consistent with the observed reduction in light scattering change in the rapid first phase (Figure 9B), the magnitude of this reduction requires that added ThS also increases the dissociation constant for step 2', from 2.5 μM to about 9 μM. On the other hand, at very long times, the second phase of light scattering change in the presence of ThS does approach the values seen in the absence of ThS, with a time dependence (apparent t1/2 ∼ 3 s) that is similar to that seen for both Pi release (Figure 9D) and fMet-tRNAfMet(prf20) fluorescence change (Figure 9E). This suggests that, in the presence of ThS, the normally rapid step 3 becomes rate determining for all three changes (second phase light scattering, Pi release, increase in prf20 fluorescence intensity). Finally, the lack of a third phase decrease in IF2C fluorescence can be reasonably attributed to ThS interfering more strongly with IF2 binding to the 50S subunit than to the 70S subunit.
Figure 9. Effect of thiostrepton on rapid kinetic measures of 70SICS formation.
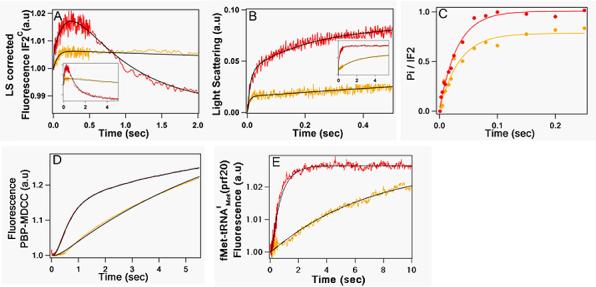
In all cases, 50S subunits ± thiostrepton was rapidly added to 30SIC (red trace, -thiostrepton, yellow trace, + 6 μM thiostrepton). All concentrations are final after mixing. Insets in (A) and (B) show expanded time scales. (A) IF2c fluorescence corrected for light scattering; the concentrations of 30SIC components were: 30S 0.3 μM; IF1, IF3, fMet-tRNAfMet 0.45 μM; mRNA 0.9 μM; IF2C 0.15 μM; and GTP 100 μM. 50S concentration was 3.0 μM. (B) Light scattering; concentrations were the same as in (A), with IF2 replacing IF2C. (C) GTPase; concentrations were the same as in (B) except for IF2 (0.3 μM) and GTP 36 (μM). (D) Pi release; concentrations were the same as in (B) except for IF2 (0.45 μM) and 50S (1.2μM). (E) fMet-tRNAfMet(prf20) fluorescence; concentrations were the same as in (D), with fMet-tRNAfMet(prf20) (0.18μM) replacing fMet-tRNAfMet. As in Figure 7B, the rapid initial phase of fMet-tRNAfMet (prf20) fluorescence change on mixing with 50S subunits is not shown. Solid lines through experimental traces are the results of fitting using Igor Pro (IF2C fluorescence, triple exponential; light scattering, double exponential; GTPase, single exponential) or Scientist (Pi release, fMet-tRNAfMet(prf20) fluorescence).
Despite the strong ThS inhibition of the rate of fMet-tRNAfMet(prf20) fluorescence change, such change is virtually complete after 10 s (Figure 9E). This is in strong contrast to ThS inhibition of dipeptide formation, which persists well past 30 s (Figure 3), a point we return to below.
DISCUSSION
We report here the most complete and quantitative kinetic scheme (Scheme 2) describing the mechanism for 70SIC formation from 30SIC so far formulated. According to Scheme 2, the initial 70S complex formed as a result of step 1, while sufficient to support IF2-dependent GTP hydrolysis, can readily dissociate into 30S and 50S subunits. According to Scheme 2, it is the subsequent conformational changes that occur in steps 3 and 4 that are crucial for both formation of a more stable 70S particle and for accommodation of fMet-tRNAfMet in the P-site of the 50S subunit. The timing of step 3 (kapp ∼ 6 s−1 at 20 °C) suggests that it could coincide with the formation of the final set of bridges joining the 30S and 50S subunits (t1/2 ∼ 50−100 ms at 20 °C)24, leading to stable 70S formation.
As mentioned above, the present results concerning the rates of GTP hydrolysis and Pi release during 70SIC formation are in excellent quantitative accord with measurements reported earlier6. However, some of our results differ in important respects from those of Antoun et al.8, leading to significant differences between the less detailed scheme for 70SIC formation, based exclusively on measurement of light-scattering changes presented by these workers, and Scheme 2. In particular, Antoun et al.8 interpret their results as showing only a single phase of light scattering change, corresponding to a 2nd order 30S + 50S binding step, and explain the apparent saturation of the rate of association as a function of 50S concentration as being due to a required, first-order dissociation of IF3 from 30SIC prior to 50S association.
However, additional results of ourselves18,25 (Milon, P., Konevega, A.L., Gualerzi, C.O. and Rodnina, M.V., in preparation) and others20 provide strong evidence that IF3 dissociation, which is required for 70SIC formation, comes after initial 70S formation, either concomitantly with or following step 3. Further, the Antoun et al.8 scheme is problematic in failing to account for GTPase activity. This activity requires 30S + 50S association and proceeds much more rapidly [kapp 30 s−1 at 20 °C in both Tomsic et al.6 and this work] than the saturated rate constant reported by Antoun et al.8 for 30S + 50S association, 3 s−1 at 37 °C. By contrast, Scheme 2 provides a straightforward way for rationalizing both rapid GTPase activity and the saturation of the rate of 30S + 50S association as a function of 50S concentration.
At present we can only speculate as to the reasons for the apparent discrepancies between our light scattering results and those of Antoun et al.8. One likely candidate is the differences in upstream sequences from the AUG initiation codon in the mRNA employed in both studies. The 022 mRNA used here has a relatively short Shine-Dalgarno sequence (4 nts) separated by a long spacer (9 nts) from AUG26. By contrast, the MFTI-mRNA used by Antoun et al.8 has a relatively long Shine-Dalgarno sequence (8 nts) separated by a short spacer (5 nts) from AUG. Recent work (Milon, P., Konevega, A.L., Gualerzi, C.O. and Rodnina, M.V., in preparation) demonstrates that an upstream sequence similar to that of MFTI-mRNA substantially retards 30SIC association with 50S subunits compared to that seen with 022 mRNA. As well, the higher temperature employed by Antoun et al.8 (37 °C vs. 20 °C) might make it harder to resolve the first and second phases.
The key conformational change in IF2 occurring in Step 3 of Scheme 2 comes after GTP hydrolysis, consistent with large differences seen in the structures of the 70S complexes of IF2.GDPCP and IF2.GDP16. Accordingly, interference with this IF2 conformational change, whether by substituting GDPCP for GTP (Figure 8A) or by adding thiostrepton (Figure 9A), negatively impacts formation of a productive 70SIC, in both cases leading to reduced dipeptide formation (Figure 3), albeit by different mechanisms. Thus, substitution of GDPCP for GTP does not affect the rate of stable 70S formation, and its inhibitory effect on dipeptide formation most likely arises from an alteration in the positioning of fMet-tRNAfMet, as seen by differences in the fluorescence of fMet-tRNAfMet(prf20) (Figure 8B). This is consistent with the localization of fMet-tRNAfMet in a novel site, between the classical P site and the P/E site, for an initiation complex formed in the presence of GDPNP, a similar nonhydrolyzable GTP analog 20 .
In contrast, thiostrepton severely retards stable 70S formation, inducing a 25-fold decrease in the rate constant for Step 3 (Figure 9B). Cryoelectronmicroscopy structures indicate a continuous movement of the N-terminal portion of domain IV (sub-domain C-1) of IF2 toward the L11 domain that includes the thiostrepton binding site12 (D. Wilson and P. Fucini, personal communication) in going from the IF2.GDPNP structure obtained in the presence of IF120, to the IF2.GDPCP structure (a model for the GDP.Pi state, see the accompanying paper), and finally to the IF2.GDP structure, each of the latter obtained in the absence of IF116. Taken together, these results lead us to propose that thiostrepton inhibits this movement, and step 3, by direct steric perturbation of IF2 interaction with the L11 domain. This perturbation, while not affecting the equilibrium binding levels of either fMet-tRNAfMet or of ternary complex13, may inhibit dipeptide formation by, in turn, distorting the binding of either A-site bound Phe-tRNAPhe or P-site bound fMet-tRNAfMet. We favor the former possibility, because the spectral change of fMet-tRNAfMet(prf20) bound in the P-site eventually reaches the same level in the presence of thiostrepton as that seen in its absence (Figure 9E).
In contrast to its effect on step 3, thiostrepton has little effect on step 2, IF2-GTPase (Figure 9C), paralleling its lack of effect on single-turnover ribosomal EF-G-dependent GTPase27,28. This lack of effect suggests that the proposed proximal thiostrepton perturbation of IF2 domain IV (sub-domain C-1) interaction with the L11 domain is not propagated to the distal GTP binding site in domain II of IF2 (sub-domain G2), which, as in the case of EF-G, is located quite near to the sarcin-ricin loop16,20,29.
MATERIALS AND METHODS
Materials
IF2C. The B. stearothermophilus V451C-IF2 mutant was prepared as described (Spurio et al., 2000), concentrated in buffer 1 (50 mM Tris-HCl pH 7.5; 800 mM NH4Cl; 1 mM DTT; 1 mM EDTA pH 8.0), and labeled in buffer 2 (50 mM Tris-HCl pH 7.5; 800 mM NH4Cl; 0.01% TritonX100) at a concentration of ∼15 μM with a 100-fold molar excess of 7-diethylamino-3-(4'-maleimidylphenyl)-4-methyl-coumarin [CPM], (Invitrogen). After incubation for 2 h with stirring at room temperature, the reaction was terminated by adding β-mercaptoethanol to a final concentration of 35 mM. Excess dye was removed by gel filtration on G-25 column (Sigma) pre-equilibrated in buffer A (20 mM Tris-HCl pH 7.5; 200 mM NH4Cl; 1 mM DTT; 0.1 mM EDTA pH 8.0; 5 % glycerol) , and concentrated using Centricon filters with membrane YM30. Labeled protein had a stoichiometry of 0.8 to 0.9CPM/protein, calculated using a ε384,CPM of 33,000 M−1cm−1 (Invitrogen). IF2 stoichiometry was estimated by Bradford30 assay. Other proteins. E. coli IF1, IF2 and IF3 and B. stearothermophilus IF222,26,31 and EF-Tu32 were prepared as described. tRNA and mRNA. 35S-labeled fMet-tRNAfMet, fMet-tRNAfMet(prf20), Phe-tRNAPhe, and 022 mRNA were prepared as described previously 19,32,33. Ribosomes and ribosomal subunits. Tight-coupled 70S ribosomes were prepared from MRE600 Escherichia coli cells as previously described34. 30S and 50S ribosomal subunits were prepared by zonal centrifugation of the 70S tight-coupled ribosome in 20 mM Tris-HCl pH 7.5; 2 mM MgCl2; 200 mM NH4Cl; 2 mM β-mercaptoethanol. Fractions containing 30S and 50S subunits were separately pooled and Mg2+ concentration was adjusted to 10 mM. Ribosomal subunits were stored in 20 mM Tris-HCl pH 7.5; 10 mM MgCl2; 100 mM NH4Cl, 1 mM β-mercaptoethanol at −80°C.
Rapid kinetics measurements
All measurements were performed in 25 mM Tris-HCl pH 7.5; 70 mM NH4Cl; 30 mM KCl; 7 mM MgCl2; 1 mM DTT) at 20 °C. Except as otherwise indicated, IF2 refers to B. stearothermophilus V451C-IF2 in all figure legends.
Light scattering, IF2C fluorescence, fMet-tRNAfMet(prf20) fluorescence, Pi release
Measurements were performed in an SX.18MV stopped-flow spectrophotometer (Applied Biophysics). For light scattering and IF2C fluorescence, excitation was at 395 nm and output was monitored using a KV455 nm long pass filter (Schott). This procedure allowed IF2C changes to be corrected for light-scattering changes using point-by-point subtraction with replacement of IF2C by underivatized V451C-IF2. Measuring light scattering at 436 nm without a cutoff filter gave fully equivalent results. Pi release was monitored using fluorescent phosphate binding protein and a Pi-MOP system as described32 with excitation at 436 nm and output monitoring using the 455 nm long pass filter. For fMet-tRNAfMet(prf20), excitation was at 462 nm and output monitoring utilized a 495 nm long pass filter.
GTPase activity and dipeptide formation
Measurements were performed in a KinTec RQF-3 apparatus. GTPase measurements employed [γ-32P] GTP. Aliquots were quenched with 0.6M HClO4 / 1.8mM KH2PO4 solution, and [32P] Pi was extracted into ethyl acetate as a dodecamolybdate complex27, 35. Background due to the ribosome-independent GTPase activity of B. stearothermophilus IF2 was subtracted36. GTPase/IF2 stoichiometry was consistently lower when measured for 50S subunits than for 70S ribosomes (Figures 2 and 7). In these experiments, 50S subunits in one syringe are mixed with IF2.GTP alone, or with IF2.GTP as part of the 30SIC, respectively, in the other. We attribute the lower GTPase/IF2 stoichiometry in the 50S experiment to surface inactivation of IF2 in the syringe prior to mixing. One would expect this effect to be reduced in the 70S experiment, since much of the IF2 surface would be buried within the 30SIC. Dipeptide measurements employed EF-Tu.GTP. [14C]Phe-tRNAPhe. Aliquots containing dipeptide were quenched with 5 M aqueous NH3, lyophilized, taken up in 500 μl of water, and eluted with water from an analytical grade cation exchange column (Bio-Rad 50W-X8, 400 μl) that had been prewashed with 0.01N HCl and water. Dipeptide eluted in the flow-through and ∼5 column volumes.
Kinetic analyses
Apparent rate constants and microscopic constants for specific kinetic schemes were determined using the programs Igor-Pro (Wavemetrics) and Scientist (MicroMath Research, LC), respectively. The latter allows global fitting of multiple experimental parameters to a specific scheme, and requires setting of initial values of rate constants. For global fitting of IF2 interaction with 50S to Scheme 1, initial values for the GTP hydrolysis (single exponential) and Pi release (double exponential) steps were estimated using fitted apparent rate constants, and initial values of Kd for IF2.GDP.Pi and IF2.GDP binding to 50S were set to 2.0 μM (Table 1) as estimated from Scientist (MicroMath Research, LC) in figure 5E. For the global fitting of 70SIC formation to Scheme 2, initial values were estimated based on apparent rate constants (light scattering change, double exponential; IF2C fluorescence change, triple exponential, Pi release, double exponential; GTP hydrolysis, single exponential; fMet-tRNAfMet(prf20) fluorescence change, triple exponential) and relevant values in Table 1. Global fitting of multiple data sets (Scheme 1: Figure 2; Scheme 2, Figures 4 – 7) inevitably leads to imperfect fits for some of the curves, since the fitted rate constants represent consensus values for all of the data, rather than the best fits obtainable when each data set is fit separately. Small differences in rate constants that could result from dye introduction into IF2 and/or fMet-tRNAfMet might also be a contributing factor.
In Scheme 2, GXP is either GTP or GDPCP; F is IF2; M is fMet-tRNAfMet; 30S is 30S containing IF1, IF3, and mRNA; and TC is ternary complex (Phe-tRNAPhe.EF-Tu.GTP). The subscripts A-F and N-P refer to different conformations of IF2C and fMet-tRNAfMet(prf20), respectively, that have different fluorescent intensities.
ACKNOWLEDGMENTS
Supported by NIH grant GM071014 to BSC, by MIUR grants (PRIN, 2002, 2003 and 2005) to COG and by funds of the graduate program in “Biology” of the University of Camerino on behalf of C.G. and S.M. We thank Nora Zuño for excellent technical assistance
Footnotes
Publisher's Disclaimer: This is a PDF file of an unedited manuscript that has been accepted for publication. As a service to our customers we are providing this early version of the manuscript. The manuscript will undergo copyediting, typesetting, and review of the resulting proof before it is published in its final citable form. Please note that during the production process errors may be discovered which could affect the content, and all legal disclaimers that apply to the journal pertain.
REFERENCES
- 1.Gualerzi CO, Pon CL. Initiation of mRNA translation in prokaryotes. Biochemistry. 1990;29:5881–5889. doi: 10.1021/bi00477a001. [DOI] [PubMed] [Google Scholar]
- 2.Boelens R, Gualerzi CO. Structure and function of bacterial initiation factors. Curr. Protein Pept. Sci. 2002;3:107–119. doi: 10.2174/1389203023380765. [DOI] [PubMed] [Google Scholar]
- 3.Ramakrishnan VA. Ribosome structure and the mechanism of translation. Cell. 2002;108:557–572. doi: 10.1016/s0092-8674(02)00619-0. [DOI] [PubMed] [Google Scholar]
- 4.Laursen BS, Sorensen HP, Mortensen KK, Sperling-Petersen HU. Initiation of protein synthesis in bacteria. Microbiol. Mol. Biol. Rev. 2005;69:101–123. doi: 10.1128/MMBR.69.1.101-123.2005. [DOI] [PMC free article] [PubMed] [Google Scholar]
- 5.Gualerzi CO, Brandi L, Caserta E, Garofalo C, Lammi M, La Teana A, Petrelli D, Spurio R, Tomsic J, Pon CL. Role of the initiation factors in the early events of mRNA translation in bacteria. Cold Spring Harbor Symp. Quant. Biol. 2001;66:363–376. doi: 10.1101/sqb.2001.66.363. [DOI] [PubMed] [Google Scholar]
- 6.Tomsic J, Vitali LA, Daviter T, Savelsbergh A, Spurio R, Striebeck P, Wintermeyer W, Rodnina MV, Gualerzi CO. Late events of translation initiation in bacteria: a kinetic analysis. Embo. J. 2000;19:2127–2136. doi: 10.1093/emboj/19.9.2127. [DOI] [PMC free article] [PubMed] [Google Scholar]
- 7.Antoun A, Pavlov MY, Andersson K, Tenson T, Ehrenberg M. Ribosome formation from subunits studied by stopped-flow and Rayleigh light scattering. Biol. Proced. Online. 2004;6:35–54. doi: 10.1251/bpo71. [DOI] [PMC free article] [PubMed] [Google Scholar]
- 8.Antoun A, Pavlov MY, Lovmar M, Ehrenberg M. How initiation factors tune the rate of initiation of protein synthesis in bacteria. EMBO J. 2006;25:2539–2550. doi: 10.1038/sj.emboj.7601140. [DOI] [PMC free article] [PubMed] [Google Scholar]
- 9.Szkaradkiewicz K, Zuleeg T, Limmer S, Sprinzl M. Interaction of fMet-tRNAfMet and fMet-AMP with the C-terminal domain of Thermus thermophilus translation initiation factor 2. Eur J Biochem. 2000;267:4290–4299. doi: 10.1046/j.1432-1033.2000.01480.x. [DOI] [PubMed] [Google Scholar]
- 10.Caserta E, Tomsic J, Spurio R, La Teana A, Pon CL, Gualerzi CO. Translation initiation factor IF2 interacts with the 30S ribosomal subunit via two separate binding sites. J. Mol. Biol. 2006;362:787–799. doi: 10.1016/j.jmb.2006.07.043. [DOI] [PubMed] [Google Scholar]
- 11.Cameron DM, Thompson J, March PE, Dahlberg AE. Initiation factor IF2, thiostrepton and micrococcin prevent the binding of elongation factor G to the Escherichia coli ribosome. J. Mol. Biol. 2002;319:27–35. doi: 10.1016/S0022-2836(02)00235-8. [DOI] [PubMed] [Google Scholar]
- 12.Cameron DM, Thompson J, Gregory ST, March PE, Dahlberg AE. Thiostrepton-resistant mutant of Thermus thermophilus. Nucleic Acid Res. 2004;32:3220–3227. doi: 10.1093/nar/gkh644. [DOI] [PMC free article] [PubMed] [Google Scholar]
- 13.Brandi L, Marzi S, Fabbretti A, Fleischer C, Hill WE, Gualerzi CO, Stephen Lodmell J. The translation initiation functions of IF2: targets for thiostrepton inhibition. J. Mol. Biol. 2004;335:881–894. doi: 10.1016/j.jmb.2003.10.067. [DOI] [PubMed] [Google Scholar]
- 14.Conn GL, Draper DE, Lattman EE, Gittis AG. Crystal structure of a conserved ribosomal protein-RNA complex. Science. 1999;284:1171–1174. doi: 10.1126/science.284.5417.1171. [DOI] [PubMed] [Google Scholar]
- 15.Wimberly BT, Guymon R, McCutcheon JP, White SW, Ramakrishnan V. A detailed view of a ribosomal active site: the structure of the L11-RNA complex. Cell. 1999;97:491–501. doi: 10.1016/s0092-8674(00)80759-x. [DOI] [PubMed] [Google Scholar]
- 16.Myasnikov AG, Marzi S, Simonetti A, Giuliodori AM, Gualerzi CO, Yusupova G, Yusupov M, Klaholz BP. Conformational transition of initiation factor 2 from the GTP- to GDP- bound state visualized on the ribosome. Nat. Struct. Mol. Biol. 2005;12:1145–1149. doi: 10.1038/nsmb1012. [DOI] [PubMed] [Google Scholar]
- 17.Grigoriadou C, Marzi S, Pan D, Gualerzi CO, Cooperman BS. The translational fidelity function of IF3 during the transition from 30S to 70S initiation complex. 2007. accompanying manuscript. [DOI] [PMC free article] [PubMed]
- 18.Pon CL, Paci M, Pawlik RT, Gualerzi CO. Structure-function releationship in Escherichia coli initiation factors. Biochemical and biophysical characterization of the interaction between IF-2 and guanosine nucleotides. J. Biol. Chem. 1985;260:8918–8924. [PubMed] [Google Scholar]
- 19.Pan D, Kirillov SV, Cooperman BS. Kinetically competent intermediates in the translocation step of protein synthesis. Mol. Cell. 2007;25:519–529. doi: 10.1016/j.molcel.2007.01.014. [DOI] [PMC free article] [PubMed] [Google Scholar]
- 20.Allen GS, Zavialov A, Gursky R, Ehrenberg M, Frank J. The cryo-EM structure of a translation initiation complex from Escherichia coli. Cell. 2005;121:703–712. doi: 10.1016/j.cell.2005.03.023. [DOI] [PubMed] [Google Scholar]
- 21.Guenneugues M, Meunier S, Boelens R, Caserta E, Brandi L, Spurio R, Pon CL, Gualerzi CO. Mapping the fMet-tRNA binding site of initiation factor IF2. EMBO J. 2000;19:5233–5249. doi: 10.1093/emboj/19.19.5233. [DOI] [PMC free article] [PubMed] [Google Scholar]
- 22.La Teana A, Pon CL, Gualerzi CO. Late events in translation initiation. Adjustment of fMet-tRNA in the ribosomal P-site. J. Mol. Biol. 1996;256:667–675. doi: 10.1006/jmbi.1996.0116. [DOI] [PubMed] [Google Scholar]
- 23.Antoun A, Pavlov MY, Andersson K, Tenson T, Ehrenberg M. The roles of initiation factor 2 and guanosine triphosphate in initiation of protein synthesis. EMBO J. 2003;22:5593–5601. doi: 10.1093/emboj/cdg525. [DOI] [PMC free article] [PubMed] [Google Scholar]
- 24.Hennelly SP, Antoun A, Ehrenberg M, Gualerzi CO, Knight W, Lodmell JS, Hill WE. A time-resolved investigation of ribosomal subunit association. J. Mol. Biol. 2005;346:1243–1258. doi: 10.1016/j.jmb.2004.12.054. [DOI] [PubMed] [Google Scholar]
- 25.Fabbretti A, Pon CL, Hennelly SP, Hill WE, Lodmell JS, Gualerzi CO. The real-time path of translation factor IF3 onto and off the ribosome. Mol Cell. 2007;25:285–296. doi: 10.1016/j.molcel.2006.12.011. [DOI] [PubMed] [Google Scholar]
- 26.La Teana A, Pon CL, Gualarzi CO. Translation of mRNAs with degenerate initiation triplet AUU displays high initiation factor 2 dependence and is subject to initiation factor 3 repression. Proc. Natl. Acad. Sci. USA. 1993;90:4161–4165. doi: 10.1073/pnas.90.9.4161. [DOI] [PMC free article] [PubMed] [Google Scholar]
- 27.Rodnina MV, Savelsbergh A, Matassova NB, Katunin VI, Semenkov YP, Wintermeyer W. Thiostrepton inhibits the turnover but not the GTPase of elongation factor G on the ribosome. Proc. Natl. Acad. Sci. USA. 1999;96:9586–9590. doi: 10.1073/pnas.96.17.9586. [DOI] [PMC free article] [PubMed] [Google Scholar]
- 28.Seo HS, Abedin S, Kamp D, Wilson DN, Nierhaus KH, Cooperman BS. EF-G-dependent GTPase on the ribosome. conformational change and fusidic acid inhibition. Biochemistry. 2006;45:2504–2514. doi: 10.1021/bi0516677. [DOI] [PubMed] [Google Scholar]
- 29.Connell SR, Takemoto C, Wilson DN, Wang H, Murayama K, Terada T, Shirouzu M, Rost M, Schuler M, Giesebrecht J, Dabrowski M, Mielke T, Fucini P, Yokoyama S, Spahn CM. Structural basis for interaction of the ribosome with the switch regions of GTP-bound elongation factors. Mol. Cell. 2007;25:751–764. doi: 10.1016/j.molcel.2007.01.027. [DOI] [PubMed] [Google Scholar]
- 30.Bradford MM. A rapid and sensitive method for the quantitation of microgram quantities of protein utilizing the principle of protein-dye binding. Anal. Biochem. 1976;72:248–254. doi: 10.1006/abio.1976.9999. [DOI] [PubMed] [Google Scholar]
- 31.Spurio R, Brandi L, Caserta E, Pon CL, Gualerzi CO, Misselwitz R, Krafft C, Welfle K, Welffle H. The C-terminal subdomain (IF2 C-2) contains the entire fMet-tRNA binding site of initiation factor IF2. J. Biol. Chem. 2000;275:2447–2454. doi: 10.1074/jbc.275.4.2447. [DOI] [PubMed] [Google Scholar]
- 32.Pan D, Kirillov S, Zhanq CM, Hou YM, Cooperman BS. Rapid ribosomal translocation depends on the conserved 18−55 base pair in P-site transfer RNA. Nat. Struct. Mol. Biol. 2006;13:354–359. doi: 10.1038/nsmb1074. [DOI] [PubMed] [Google Scholar]
- 33.Rodnina MV, Semenkov YP, Wintermeyer W. Purification of fMet-tRNA(fMet) by fast protein liquid chromatography. Anal. Biochem. 1994;219:380–381. doi: 10.1006/abio.1994.1282. [DOI] [PubMed] [Google Scholar]
- 34.Rodnina MV, Wintermeyer W. GTP consumption of elongation factor Tu during translation of heteropolymeric mRNAs. Proc. Natl. Acad. Sci. USA. 1995;92:1945–1949. doi: 10.1073/pnas.92.6.1945. [DOI] [PMC free article] [PubMed] [Google Scholar]
- 35.Wahler BE, Wollenberger A. Determination of orthophosphate in the presence of phosphate compounds with an affinity for acids and molybdate. Biochem. Z. 1958;329:508–520. [PubMed] [Google Scholar]
- 36.Severini M, Spurio R, La Teana A, Pon CL, Gualerzi CO. Ribosome-independent GTPase activity of translation initiation factor IF2 and of its G-domain. J. Biol. Chem. 1991;266:22800–22802. [PubMed] [Google Scholar]