Abstract
EmrE is an Escherichia coli H+-coupled multidrug transporter that provides a unique experimental paradigm because of its small size and stability, and because its activity can be studied in detergent solution. In this work, we report a study of the transient kinetics of substrate binding and substrate-induced proton release in EmrE. For this purpose, we measured transient changes in the tryptophan fluorescence upon substrate binding and the rates of substrate-induced proton release. The fluorescence of the essential and fully conserved Trp residue at position 63 is sensitive to the occupancy of the binding site with either protons or substrate. The maximal rate of binding to detergent-solubilized EmrE of TPP+, a high-affinity substrate, is 2 × 10⁷ M−1·s−1, a rate typical of diffusion-limited reactions. Rate measurements with medium- and low-affinity substrates imply that the affinity is determined mainly by the koff of the substrate. The rates of substrate binding and substrate-induced release of protons are faster at basic pHs and slower at lower pHs. These findings imply that the substrate-binding rates are determined by the generation of the species capable of binding; this is controlled by the high affinity to protons of the glutamate at position 14, because an Asp replacement with a lower pK is faster at the same pHs.
Keywords: drug resistance, fluorescence, ion-coupled transporter, membrane protein, transient kinetic
EmrE is a small multidrug transporter from Escherichia coli that extrudes a range of positively charged aromatic drugs in exchange for two protons, thus rendering bacteria resistant to these drugs (1–3). EmrE provides a unique experimental paradigm not only because of its size and stability but also because, under proper conditions, the detergent-solubilized protein binds the substrate and releases protons in a mode that reflects, with high fidelity, its catalytic activity in the membrane; this has enabled a detailed study of the molecular basis of substrate recognition and the coupling between protons and substrate (4–10). EmrE has only one membrane-embedded charged residue, Glu-14, which is also conserved in >200 homologous proteins in bacteria and archaea (11, 12). This residue provides the core of the coupling mechanism, because its deprotonation is essential for substrate binding (6, 13). Conversely, the substrate induces proton release, and both reactions (substrate binding and proton release) have been observed directly in the detergent-solubilized preparation of EmrE (9). That the binding sites for both substrates and protons overlap and the occupancy of these sites is mutually exclusive provides the basis of the coupling mechanism (5, 6). The fine-tuning of the pKa is essential, because replacement of Glu-14 with Asp results in a decrease in the pKa of the carboxyl and generates a protein that, at physiological pH, has already released the previously bound protons and binds substrate but cannot couple the substrate flux to the proton gradient (4, 9).
A possible explanation for the environment that leads to this finely tuned and high pKa may stem from experimental data that imply a role for at least three aromatic residues (Trp-63, Tyr-40, and Tyr-60) in each EmrE monomer. Our results suggest that, in the absence of substrates, the carboxyls of Glu-14 in the binding cavity are stabilized by interaction with protons or with at least part of the six aromatic residues (three from each monomer) (14, 15).
Close interaction between substrates and aromatic residues has been observed in the binding sites of multidrug-recognizing transcription factors (16–18). Aromatic residues such as tryptophan can interact with cations through a strong noncovalent force termed the cation/π interaction (for review, see ref. 19). It has been suggested that aromatic residues in a protein can pull a cationic substrate (or a proton) out of water and into a nominally hydrophobic environment (19).
EmrE has four Trp residues, only one of which (Trp-63) is fully conserved and essential for activity (14). A protein with a single Trp at position 63 has been created and shown to be functional, provided at least two of the other Trp residues are replaced with another aromatic residue (Tyr). By using purified wild-type and single Trp-63 proteins, we have detected a substrate-induced change in Trp fluorescence (14).
To understand the mechanism of ion-coupled transporters, it is necessary to understand the properties of ion binding and release and the interaction between ions and substrate. EmrE is the only transporter where substrate binding and proton release have been observed in a detergent-solubilized preparation, and it thereby provides an experimental paradigm to break down a multistep process to its individual steps. Here we use transient kinetics to measure the microscopic constants of the substrate-induced change in Trp fluorescence. The maximal rates measured suggest that, at alkaline pH, the reaction rates are quite close to a typical diffusion-limited value, and therefore the change in fluorescence reflects binding to the protein before further conformational changes. At acidic pH, binding to the wild-type protein is slower, but a mutant with an Asp replacement at position 14 such that the carboxyl displays a lower pKa shows a shift in the pH dependence of the rates. The results imply that the rates are determined by the generation of the species capable of binding, which is controlled by the affinity to protons of the carboxyl at position 14.
Results
The Fluorescence of Trp-63 in EmrE Depends on the Protonation State of Glu-14 and on the Occupancy of the Binding Site.
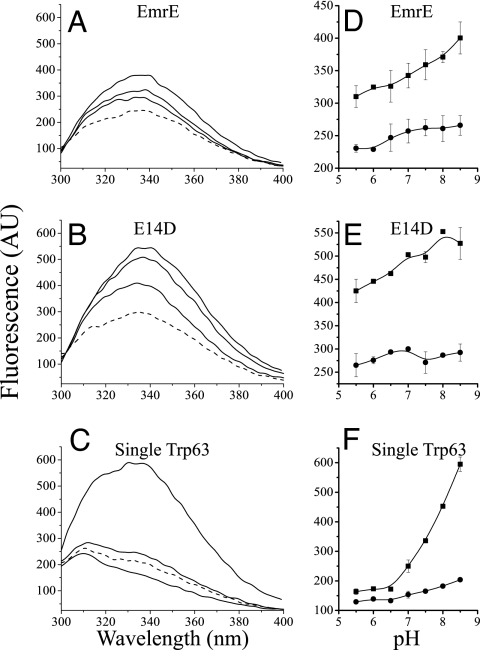
The tryptophan fluorescence of the detergent-solubilized EmrE is shown in Fig. 1A. The intensity of the fluorescence of EmrE at 338 nm is pH-dependent, with minor change between pH 5.5 and 7.0 and a 50% increase between pH 7.0 and 8.5 (Fig. 1D).
Fig. 1.
Tryptophan fluorescence spectra of EmrE mutants at different pH values with/without substrate. (A–C) Emission spectra (excitation at 280 nm) of 0.5 μM EmrE (A), 0.5 μM E14D (B), and 2 μM single Trp63 (C). The lowest solid line is at pH 5.5, the middle is at pH 7.0, and the highest is at pH 8.5. The dashed line represents protein at pH 8.5 after addition of 50 μM of the substrate TPP+. The shoulder at ≈310 nm in the spectra of the single Trp-63 mutant (that bears seven Tyr residues) is not observed upon excitation at 295 nm and was assigned to Tyr fluorescence (14). (D–F) Summary of the pH dependence of the fluorescence intensity at the emission peak at 338 nm of free (squares) and substrate-bound protein (circles).
In a mutant where Glu-14 is replaced with Asp, substrate binding and release are practically independent of pH in the range 6.5–8.0 (13). This is because of the lower pKa of the aspartate at position 14, as a result of which the protein is largely deprotonated above pH 6.0. The tryptophan fluorescence in the E14D mutant (Fig. 1B) shows higher intensity than the wild type, and the pH dependence is shifted to more acidic pH (Fig. 1E). These results suggest that the fluorescence of the protein is affected by the protonation state of position 14, and that the deprotonated protein is more fluorescent than the protonated one. As previously reported, binding of the high-affinity substrate TPP+ promotes significant quenching of the tryptophan fluorescence (14). The fluorescence of the bound protein is the lowest one of the three states and is only slightly affected by the pH (Fig. 1). To further study this phenomenon, we explored the fluorescence of a mutant with a single tryptophan at position 63. This mutant displays a remarkable pH dependence of its fluorescence: at pH 5.5, the fluorescence at 338 nm is practically nil and is mostly due to the tyrosine fluorescence that peaks at 310 nm. The Tyr peak is not observed when excitation is at 295 nm (14). There is very little change in fluorescence intensity until pH 7.0, but between pH 7.0 and 8.5, there is a dramatic increase in the emission of Trp-63 (Fig. 1 C and F). As observed with the wild type, addition of TPP+ quenches the fluorescence, and the effect of the pH on the fluorescence of the substrate-bound protein is mild (Fig. 1).
The above results suggest that the fluorescence intensity of EmrE reflects mainly changes in Trp-63 and reports the occupancy of the binding site. The fluorescence level reports approximately three states of EmrE. The most fluorescent is the free deprotonated protein; the free protonated protein is less fluorescent; and the substrate-bound protein is the least fluorescent conformation, with a minor increase in the emission at basic pH values. There is no observable shift in the peak of the fluorescence, suggesting that in all these states, Trp-63 remains in a hydrophobic environment.
Pre-Steady-State Measurements of the Binding Reaction.
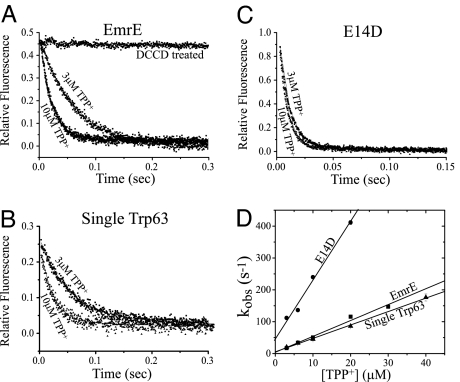
To study the transient kinetics of substrate binding to detergent-solubilized EmrE, we followed the fluorescence quenching promoted by the binding of the high-affinity substrate tetraphenyl phosphonium (TPP+)+ by using a stopped-flow apparatus. Upon mixing 0.5 μM purified EmrE with a saturating concentration of TPP+, a rapid decrease in fluorescence is observed. Typical curves at pH 7.0 of EmrE, single Trp-63, and E14D are shown in Fig. 2 A–C. Pretreatment with N,N-dicyclohexyl carbodiimide (DCCD), a carbodimide that inhibits binding activity, prevents fluorescence quenching (Fig. 2A). The observed rate of this reaction (kobs = 1/τ), calculated by using a first-order exponential fit, increases linearly with the substrate concentration, and the slope of this increase represents the association rate constant (kon) of TPP+ to EmrE according to Eq. 1:
Fig. 2D shows the kobs vs. [TPP+] curves at pH 7.0. The kon of the reaction for the single Trp-63 mutant is very similar to that of the wild type (4.2 × 10⁶ M−1·s−1 and 4.9 × 10⁶ M−1·s−1, respectively). This result implies this mutant is functionally similar to the wild type also in its pre-steady-state characteristics, in addition to the steady-state data shown before (14). The E14D mutant shows a higher kon (1.8 × 10⁷ M−1·s−1), as shown in Fig. 2D, supporting the contention that the protonation state of the protein affects the rate of association with substrates.
Fig. 2.
Stopped-flow measurements of tryptophan fluorescence quenching induced by substrate binding at pH 7.0. EmrE (0.5 μM) (A), 2 μM single Trp-63 (B), and 0.5 μM E14D (C) were mixed with 3 or 10 μM TPP+. Excitation was at 280 nm, and emission was collected with >320-nm cutoff filter. Each curve is the average of 5–10 repeats, and the data are fitted to an exponential equation. (D) Summary of the observed rates (kobs = 1/τ) of the binding reaction at increasing TPP+ concentrations at pH 7.0. The rate increases linearly, and the slope represents the association constant (kon) according to Eq. 1.
pH Dramatically Affects Binding Rates.
Steady-state measurements of TPP+ binding to EmrE at nanomolar substrate concentration showed a steep pH dependence, with practically no binding up to pH 6.8–7.0 and increase up to pH 9.0. Binding to the E14D mutant is shifted to acidic pH and plateaus at pH 7.0 (13).
The amplitudes and rates of the fluorescence change in the stopped-flow measurements are also pH-dependent and differ among mutants, in agreement with the steady-state data presented in Fig. 1. Although at neutral and acidic pH, the fluorescence quenching is a first-order reaction, at basic pH, another slow exponential component emerges. This component is negligible in the wild type and E14D, but in the single Trp-63 mutant, the amplitude of the slow component above pH 8.0 is significant [supporting information (SI) Fig. 7], suggesting it is related to Trp-63, and it is partly masked by the other three tryptophan residues in the wild type. The slow component will be discussed below; here, we will refer only to the fast component.
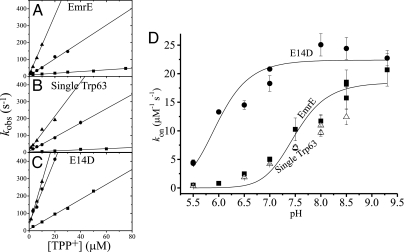
The kon value in EmrE increases with pH. At pH 5.5, it is on the level of 4 × 10⁵ M−1·s−1 and increases to saturation above pH 8.5 to a level of ≈2 × 10⁷ M−1·s−1 at pH 9.3 (Fig. 3 A and D). The single Trp-63 mutant behaves similar to the wild type (Fig. 3 B and D), whereas the E14D displays a completely different pH dependence profile. As shown in Fig. 3, at pH 5.5, its kon value is still close to that of wild type, but this value dramatically increases and reaches 2×10⁷ M−1·s−1 at pH 7.0, which stays static until pH 9.3. The maximal kon of ≈2×10⁷ M−1·s−1 suggests that the binding is very fast at basic pHs for EmrE and at most of the pH range for E14D.
Fig. 3.
pH dependence of the association constant (kon). The plot of the kobs of the binding reaction against the TPP+ concentration is presented for EmrE (A), single Trp-63 (B), and E14D (C), at three pH values: 5.5 (squares), 7.0 (circles), and 8.5 (triangles). The slope represents the kon according to Eq. 1. (D) Summary of the kon for EmrE (squares), single Trp 63 (open triangles), and E14D (circles) at the pH range from 5.5 to 9.3. The EmrE and E14D data are fitted to the equation for Model C (SI Fig. 10).
Simultaneous Measurement of Substrate-Induced Proton Release and Substrate Binding Shows That in Wild Type, the Two Phenomena Occur with Similar Rates.
The results shown in Fig. 3 suggest that the binding rate of the Asp replacement is maximal and higher than 107 M−1·s−1 at all of the range above pH 6.0. On the other hand, the rate of binding to EmrE depends highly on pH, suggesting that the protonation state of the carboxyl at position 14 influences the rates of the reaction. To characterize the deprotonation reaction associated with substrate binding, we have developed a spectroscopic method to follow the release of protons from the protein based on the use of the pH indicator Phenol-red (SI Fig. 8). Phenol red changes its absorption profile with pH and does not interact with the transporter, as judged from the fact that it does not inhibit the TPP+-binding activity of EmrE (data not shown).
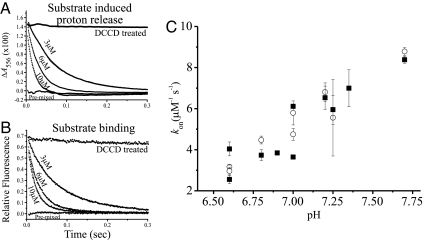
Typical curves of simultaneous stopped-flow measurements of substrate-induced proton release and substrate binding are shown in Fig. 4 A and B. The release of protons follows a first-order exponential reaction in the pH range tested, suggesting that the two protons in the EmrE dimer are indistinguishable and are released at identical rates. These data are in agreement with the results that the two Glu-14 residues in the dimer responsible for the release of the protons are “biochemically equivalent” (9, 10). As shown for the steady-state measurements (9, 10), DCCD inhibits substrate binding, and no proton release is visible when TPP+ is mixed with protein pretreated with DCCD. The release is induced by substrate binding and consequently depends on substrate concentration. The kon values for the substrate-induced release of the protons are similar to the values of the substrate-binding kon obtained by using tryptophan fluorescence changes (Fig. 4C). The kon values for binding obtained at these conditions are in agreement with the data presented in Fig. 3, even though they were performed at different protein and buffer concentrations and in the presence of phenol red. When the same experiment is performed with the E14D mutant at a pH (6.7) above the pKa of Asp-14, substrate-induced proton release is 11.4×10⁶ M−1·s−1, several-fold faster than the release from the wild-type protein.
Fig. 4.
Parallel measurement of the kinetics of substrate-binding and substrate-induced proton release. (A) Stopped-flow measurements of proton release: 3 μM EmrE in a solution of 0.15 M NaCl, 0.08% DDM buffered with 100 μM phenol red (pH 7.0) was mixed with 3, 6, and 10 μM TPP+. Shown also is protein inhibited with DCCD (pretreated with 500 μM, 60 min at room temperature) and protein mixed with TPP+ before the experiment. Absorption changes at 556 nm were collected. (B) Same solutions as in A, measured for tryptophan fluorescence changes at 280-nm excitation and >320-nm emission. The data on A and B are an average of 5–10 repeats, fitted to an exponential equation. (C) Summary of the kon values obtained from measurements like those presented in A and B for 1.5 or 3 μM EmrE at different pH values. The kon was calculated by using the slope of the linear fit of the kobs against [TPP+] according to Eq. 1. Squares are kon obtained from substrate-induced proton release measurements, and open circles are kon obtained from the same solutions measured for substrate binding by using tryptophan fluorescence changes.
pH Dependence of Steady-State TPP+-Binding Affinity to EmrE.
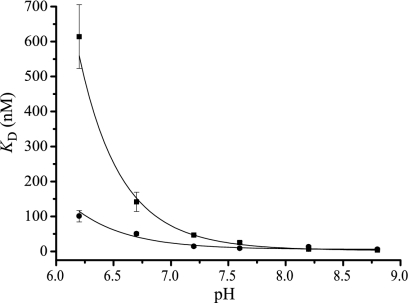
To further study the nature of the pH dependence, we measured the steady-state Kd with radiolabeled TPP+ at various pHs. These results, summarized in Fig. 5, show that the affinity of EmrE to TPP+ decreases below pH 8.2, and this decrease becomes steep below pH 7.0. Similar results were obtained with a mutant with only a single carboxyl at position 14 (data not shown), suggesting again that this is the only carboxyl involved in substrate and proton binding (7). The E14D mutant shows a different profile and displays maximal affinity above pH 7.0 (Fig. 5, circles), suggesting again that the affinity at a given pH is a function of the pKa of the carboxyl at position 14.
Fig. 5.
pH dependence of the equilibrium Kd of EmrE and E14D. Purified protein was immobilized on Ni-NTA beads and bound to increasing [3H]TPP+ concentrations at various pH values as described in Materials and Methods. The Kd values are presented for EmrE (squares) and E14D (circles).
Affinity of EmrE to Various Substrates Is Determined by the koff.
EmrE is a multidrug transporter, and the detergent-solubilized protein binds not only TPP+ but also a wide variety of other substrates (9, 11, 13). Therefore, it provides a good paradigm to study the basis of multiple substrate recognition. Many EmrE substrates are colored and have intrinsic fluorescence when excited at 280 nm; for this reason, we could not use most of them in those experiments. Two substrates were chosen in addition to TPP+ (SI Fig. 9): one is TPMP+ that is structurally close to TPP+ but displays an affinity almost 2 orders of magnitude lower that EmrE, as judged from Ki of transport (15); the other is ethidium+, a planar molecule with completely different structure and much lower affinity compared with TPP+ (15). Both substrates were tested at pH 7.25 and displayed first-order exponential reaction for both tryptophan fluorescence quenching and proton release. For both molecules, the dependence of the kobs on substrate concentration is shown in SI Fig. 9. The calculated kon values for TPMP+ binding are 2.1×10⁶ M−1−s−1 for substrate-induced proton release and 3.7×10⁶ M−1·s−1 for substrate binding. Ethidium+ binding shows similar values (3.9×10⁶ M−1·s−1 for release and 4.9×10⁶ M−1·s−1 for binding). These kon values are in the same order of magnitude as those measured with TPP+. That the association constant is similar for substrates with completely different affinity implies that the factor determining the large affinity differences between the various substrates is the dissociation.
Trp-63 Is Involved in Slow Conformational Change After Release of Protons and Substrate Binding.
At basic pHs, another very small exponential component is detectable in the quenching of the tryptophan with the wild-type protein (not shown). Because of its size, this component is difficult to analyze and quantitate. However, in the Trp-63 mutant, the second component becomes visible enough for analysis (SI Fig. 7). We assume that in the wild-type protein, the slow reaction is reflecting changes in the fluorescence of Trp-63, but these are masked by the fluorescence of the other tryptophans. In contrast to the fast exponent, the rate constants of this one (≈1.5 s−1) were independent of pH and substrate concentration (SI Fig. 7). This result suggests that this fluorescent decay is a zero-order reaction that may reflect a conformational change taking place after the substrate is already bound to the protein.
Discussion
The fluorescence of Trp-63 in EmrE reflects the occupancy of the binding site in the protein: the highest fluorescence is observed when the protein is fully deprotonated, the protonated protein displays a lower fluorescence, and the substrate-bound protein displays the lowest. Interestingly, the environment to which Trp-63 is exposed, as reflected by the wavelength of its fluorescence peak, does not change significantly at the three different states, suggesting that Trp-63 does not go through large conformational changes that expose it to different environments. A possible reason for the different fluorescence levels could be due to quenching or energy transfer to the substrate or to other amino acids not yet identified.
The maximal rates of substrate binding of ≈2 × 10⁷ M−1·s−1 are quite close to typical values in diffusion-limited processes. Therefore, we suggest that binding does not necessitate major conformational changes of the protein. Various substrates bind to EmrE with similar kon despite their different apparent affinities, implying that the lower affinities to the substrates tested are due to higher koff rates. In the case of the H+-coupled LacY, lactose permease of E. coli, the kon determined for one of the substrates was 4.3 × 10⁶ M−1·s−1, about five times slower that the maximal kon reported here for EmrE (20). Recent structural evidence for LacY also suggests an induced fit mechanism for substrate binding, in line with the slower association-binding constant (21). In some cases, electrophysiological tools have been used to study fast reactions. Binding of Na+ to the Na+-coupled GABA transporter GAT1 expressed in Xenopus oocytes was found to be slower than expected from a diffusion-limited reaction, and it was concluded that a conformational change is needed before binding (22). In the latter case, it could not be established whether this reflects recruiting of a preexisting binding site to the extracellular face of the membrane or a conformational change that creates the binding site. Further studies are needed to establish the properties of EmrE when membrane-embedded, but the detergent-solubilized system provides the advantage of studying substrate binding and proton release independently of all other steps in the catalytic cycle. The detergent-solubilized system has been shown to reflect well the substrate specificity, affinities, and pH dependence of the wild-type protein and other mutants studied (8, 9, 12, 13, 23).
The kon values for binding to the single Trp-63 mutant in the pH range measured are essentially identical to the kon values for binding to the wild-type protein. These findings further validate the use of the mutant to study the mechanism of catalysis. Moreover, the results suggest that Trp-63 is the one responsible for most of the fluorescence changes in the wild-type protein. The changes in fluorescence of Trp-63 are extremely large and, under optimal conditions, most of the fluorescence is quenched by either protons or substrate.
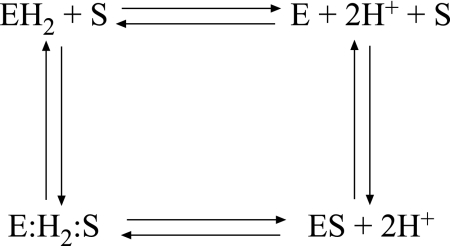
Fig. 6 describes possible paths for the substrate-binding reaction cycle in EmrE. If binding were to occur through an intermediate complex (E:H2:S) or to the singly protonated species, we would expect to detect two or three exponents in the binding curves at pHs where a fraction of the protein is protonated or partially protonated. Because this is not the case, the formation of an intermediate complex does not seem likely. Several kinetic models yield reasonably good fits to the pH dependence of the rate constants of the substrate binding (SI Fig. 10). In the most rigorous analysis, substrate can bind to all of the protonation states of the protein (Fig. 6), and the model assumes two different pKas (Model A, SI Fig. 10). In a variation of the above, a single pKa is assumed (Model B), and then binding is allowed only to the deprotonated protein (Model C). All of the mathematical fits have to be challenged with the following experimental findings (summarized in SI Table 1): (i) Stoichiometry of proton release as determined from steady-state measurements is 2H+/functional unit (dimer) (9). This finding is supported also by stoichiometry of the whole transport process: 2H+/substrate (3). (ii) In steady-state measurements, the maximal substrate-induced release of protons from a practically fully protonated protein is at ≈7, and therefore we conclude that the pKa must be well above 7 (9). This contention is supported also by the pH dependence of the Trp-63 fluorescence (Fig. 1F). (iii). Although EmrE releases two protons upon substrate binding, the substrate-induced proton release is a first-order reaction (Fig. 4A), supporting the contention that the two protons display identical or very similar pKas. (iv) Substrate binding always shows a single exponential.
Fig. 6.
The substrate-binding reaction cycle in EmrE. E, nonprotonated EmrE; EH2, protonated EmrE; ES, substrate bound EmrE; E:H2:S, hypothetical ternary complex of protonated EmrE and substrate.
The fit to a model that assumes, as a first approximation, no binding to either the singly or doubly protonated protein, and that both protons have a single or very similar pKa (Model C), is not optimal but is the only one in agreement with the accumulated experimental data mentioned above (summarized in SI Table 1). The suboptimal fit may be due to some degree of binding to the protonated species and/or cooperativity in the step of proton release, so that they kinetically behave as a single species (Model D). The existence of cooperativity requires further study for full elucidation of the mechanism. Because the number of parameters required to accurately estimate a Hill coefficient is too large, it cannot be done with the available data. From the fit of Model C (Fig. 3D and SI Fig. 10), we get a preequilibrium pKa of ≈7.3 for Glu-14 and 5.8 for Asp-14. The pKas from this fit are lower than the equilibrium pKas (8.3–8.5 and 6.7, respectively) (9), which could be due to different effects on rates and on steady states, to a lower accuracy of the steady-state measurements, or to the need to obtain a model that describes better the reaction.
Taken as a whole, the results support a binding mechanism as described in the upper part of the scheme in Fig. 6, where either substrate or protons bind to a form in which the binding site is not occupied by other molecule and induce a shift in the equilibrium. The suggested reaction path implies that first, EH2 + S dissociate to E + S + 2H+, and it rapidly leads to the formation of ES + 2H+. In this case, we expect that the kobs will saturate at high substrate concentrations, and this is not observed. The rate of spontaneous proton release to water was shown to relate to the pKa of the protonated group according to: koff = 4 × 10¹⁰−pKa (24). If the pKa of Glu-14 is 7.3, the rate of spontaneous proton release will be 2,000 s−1. Therefore, deviation from linearity in Fig. 3 A–C would be observable only at higher substrate concentrations, where the resulting rates are above those measurable by using a standard stopped flow.
The suggested mechanism necessitates the fine-tuning of the pKa of the carboxyl at position 14 and hints at cooperativity in the step of proton release. In a protein with an Asp replacement that displays a lower pKa, the coupling of the two fluxes is impaired (6). The fit in Fig. 3 for the E14D mutant predicts a preequilibrium pKa of 5.8, whereas the kon(E) is 2.2 × 10⁷ M−1·s−1 respectively, similar to that of the WT. Taking into consideration the expected rate of proton release for this mutant is ≈60,000 s−1 (according to the above equation) might explain the impairment in coupling between the two fluxes.
The work described here provides tools for the study of the kinetics of substrate-induced effects on protonation of H+-coupled transporters, an essential step in understanding the mechanism of action of these important proteins. Direct measurements of microscopic constants of other reactions in the transport cycle will require further experimentation and development of the necessary paradigms.
Materials and Methods
Bacterial Strains and Plasmids.
E. coli TA15 cells (25) were transformed with plasmid pGP1–2, which encodes for the regulated expression of T7 polymerase under the inducible control of the λPL promoter (26). Plasmids used for EmrE gene expression are pT7–7 (26) derivatives with the hexahistidine tag by using a Myc epitope as linker (13). Throughout this work, for simplicity, Myc- and His-tagged protein is named EmrE. The E14D-EmrE and single Trp-63 EmrE mutants were previously characterized (13, 14). Single Trp-63 is Cys-less EmrE with the tryptophan at position 31 replaced with cysteine and at position 45 and 76 with tyrosine (14).
Overexpression and Purification of EmrE.
TA15 cells that bear plasmids pGP1–2 and pT7–7 containing His-tagged EmrE constructs were grown to A600 = 1.5 and induced for EmrE expression as described in refs. 9 and 14. EmrE was solubilized with 1% DDM and purified by using Ni affinity chromatography and gel filtration (9, 14). Protein purity was confirmed by SDS/PAGE.
[3H]TPP+-Binding Assay.
The TPP+-binding assay was previously described (13). In brief, purified EmrE was immobilized on Ni-NTA beads and washed with 150 mM NaCl, 0.08% DDM, 15 mM Tris-Mes buffer at different pHs. After 20-min incubation at appropriate concentrations of [3H]TPP+, the protein was eluted with imidazole, and radioactivity was measured in a scintillation counter.
Steady-State Tryptophan Fluorescence Measurements.
Fluorescence was recorded with an LS 50 B luminescence spectrometer (PerkinElmer, Beaconsfield, U.K.), as described (14). All experiments were carried out in an 0.5 × 1-cm stirred quartz cuvette in a solution containing 0.08% DDM, 0.15 M NaCl, and 15 mM Tris·HCl or Tris-Mes (at pH 6.5 and lower).
Steady-State Measurements of Proton Release.
Substrate-induced proton release was measured in a diode-array spectrophotometer (Hewlett–Packard 8452A) with 3 μM unbuffered EmrE prepared as described (9) in a solution of 0.08% DDM, 150 mM NaCl buffered with 100 μM of the pH indicator phenol red titrated to various pH values with NaOH, at 25°C.
Stopped-Flow Measurements of Tryptophan Fluorescence Changes.
Pre-steady-state measurements were performed in SX-18mv stopped-flow apparatus (Applied Photophysics, Surrey, U.K). Tryptophan fluorescence measurements were performed by using the same solutions and protein concentration as in the steady-state fluorescence measurements. Protein and increasing concentrations of TPP+ were rapidly mixed; fluorescence was measured with 280-nm excitation and emission at >320-nm cutoff. All measurements were performed at 25°C. Each curve is the average of 5–10 repeats. The observed rate (1/τ) was calculated by using the exponential fit of the data. At high TPP+ concentrations, the rate was fast, and increasing parts of the fluorescence decay occurred in the dead time; thus the amplitude of the reaction decreased. Correction of the fit with 1.5-ms dead time restored the amplitude, and the observed rate remained linear at all of the TPP+ concentrations tested. All data analysis was performed by using Origin 7.0 software (OriginLab, Northampton, MA).
Transient Kinetic Measurements of Tryptophan Fluorescence Changes and Release of Protons.
The assay was performed with 1.5 or 3 μM EmrE or 3 μM E14D in 0.08% DDM, 0.15 M NaCl solution, buffered with 100 μM phenol red titrated to different pH values. Tryptophan fluorescence was measured as described above. The same solutions were measured in parallel for proton release by moving to absorbance setup and measuring changes in A556, representing the acidification of the solution caused by the release of the protons from the protein. The optic path length was 1 cm. The actual pH in each experiment was estimated by using a calibration curve similar to the one used in the steady-state proton release measurements (see SI Fig. 8). Each curve is an average of 5–10 repeats. Data for proton release were fitted to a single exponential equation.
Supplementary Material
Acknowledgments
S.S. is Mathilda Marks–Kennedy Professor of Biochemistry at the Hebrew University of Jerusalem. We thank Michal Harel from the Department Biological Chemistry, Weizmann Institute of Science, for technical help and great hospitality. We thank an anonymous reviewer for deepening our insight into the mechanistic aspects of the binding reaction. This work was supported by National Institutes of Health Grant NS16708 and Israel Science Foundation Grant 119/04.
Footnotes
The authors declare no conflict of interest.
This article is a PNAS Direct Submission.
This article contains supporting information online at www.pnas.org/cgi/content/full/0704425104/DC1.
References
- 1.Schuldiner S, Granot D, Mordoch SS, Ninio S, Rotem D, Soskin M, Tate CG, Yerushalmi H. News Physiol Sci. 2001;16:130–134. doi: 10.1152/physiologyonline.2001.16.3.130. [DOI] [PubMed] [Google Scholar]
- 2.Yerushalmi H, Lebendiker M, Schuldiner S. J Biol Chem. 1995;270:6856–6863. doi: 10.1074/jbc.270.12.6856. [DOI] [PubMed] [Google Scholar]
- 3.Rotem D, Schuldiner S. J Biol Chem. 2004;279:48787–48793. doi: 10.1074/jbc.M408187200. [DOI] [PubMed] [Google Scholar]
- 4.Yerushalmi H, Schuldiner S. J Biol Chem. 2000;275:5264–5269. doi: 10.1074/jbc.275.8.5264. [DOI] [PubMed] [Google Scholar]
- 5.Yerushalmi H, Schuldiner S. FEBS Lett. 2000;476:93–97. doi: 10.1016/s0014-5793(00)01677-x. [DOI] [PubMed] [Google Scholar]
- 6.Yerushalmi H, Schuldiner S. Biochemistry. 2000;39:14711–14719. doi: 10.1021/bi001892i. [DOI] [PubMed] [Google Scholar]
- 7.Yerushalmi H, Mordoch SS, Schuldiner S. J Biol Chem. 2001;276:12744–12748. doi: 10.1074/jbc.M010979200. [DOI] [PubMed] [Google Scholar]
- 8.Gutman N, Steiner-Mordoch S, Schuldiner S. J Biol Chem. 2003;278:16082–16087. doi: 10.1074/jbc.M213120200. [DOI] [PubMed] [Google Scholar]
- 9.Soskine M, Adam Y, Schuldiner S. J Biol Chem. 2004;279:9951–9955. doi: 10.1074/jbc.M312853200. [DOI] [PubMed] [Google Scholar]
- 10.Weinglass AB, Soskine M, Vazquez-Ibar JL, Whitelegge JP, Faull KF, Kaback HR, Schuldiner S. J Biol Chem. 2005;280:7487–7492. doi: 10.1074/jbc.M413555200. [DOI] [PubMed] [Google Scholar]
- 11.Ninio S, Rotem D, Schuldiner S. J Biol Chem. 2001;276:48250–48256. doi: 10.1074/jbc.M108231200. [DOI] [PubMed] [Google Scholar]
- 12.Sharoni M, Steiner-Mordoch S, Schuldiner S. J Biol Chem. 2005;280:32849–32855. doi: 10.1074/jbc.M504910200. [DOI] [PubMed] [Google Scholar]
- 13.Muth TR, Schuldiner S. EMBO J. 2000;19:234–240. doi: 10.1093/emboj/19.2.234. [DOI] [PMC free article] [PubMed] [Google Scholar]
- 14.Elbaz Y, Tayer N, Steinfels E, Steiner-Mordoch S, Schuldiner S. Biochemistry. 2005;44:7369–7377. doi: 10.1021/bi050356t. [DOI] [PubMed] [Google Scholar]
- 15.Rotem D, Steiner-Mordoch S, Schuldiner S. J Biol Chem. 2006;281:18715–18722. doi: 10.1074/jbc.M602088200. [DOI] [PubMed] [Google Scholar]
- 16.Neyfakh AA. Mol Microbiol. 2002;44:1123–1130. doi: 10.1046/j.1365-2958.2002.02965.x. [DOI] [PubMed] [Google Scholar]
- 17.Godsey MH, Zheleznova Heldwein EE, Brennan RG. J Biol Chem. 2002;277:40169–40172. doi: 10.1074/jbc.R200018200. [DOI] [PubMed] [Google Scholar]
- 18.Zheleznova EE, Markham P, Edgar R, Bibi E, Neyfakh AA, Brennan RG. Trends Biochem Sci. 2000;25:39–43. doi: 10.1016/s0968-0004(99)01514-5. [DOI] [PubMed] [Google Scholar]
- 19.Dougherty DA. Science. 1996;271:163–168. doi: 10.1126/science.271.5246.163. [DOI] [PubMed] [Google Scholar]
- 20.Smirnova IN, Kasho VN, Kaback HR. Biochemistry. 2006;45:15279–15287. doi: 10.1021/bi061632m. [DOI] [PMC free article] [PubMed] [Google Scholar]
- 21.Mirza O, Guan L, Verner G, Iwata S, Kaback HR. EMBO J. 2006;25:1177–1183. doi: 10.1038/sj.emboj.7601028. [DOI] [PMC free article] [PubMed] [Google Scholar]
- 22.Mager S, Naeve J, Quick M, Labarca C, Davidson N, Lester HA. Neuron. 1993;10:177–188. doi: 10.1016/0896-6273(93)90309-f. [DOI] [PubMed] [Google Scholar]
- 23.Schuldiner S. Trends Biochem Sci. 2007;32:252–258. doi: 10.1016/j.tibs.2007.04.002. [DOI] [PubMed] [Google Scholar]
- 24.Adelroth P, Brzezinski P. Biochim Biophys Acta. 2004;1655:102–115. doi: 10.1016/j.bbabio.2003.10.018. [DOI] [PubMed] [Google Scholar]
- 25.Goldberg EB, Arbel T, Chen J, Karpel R, Mackie GA, Schuldiner S, Padan E. Proc Natl Acad Sci USA. 1987;84:2615–2619. doi: 10.1073/pnas.84.9.2615. [DOI] [PMC free article] [PubMed] [Google Scholar]
- 26.Tabor S, Richardson C. Proc Natl Acad Sci USA. 1985;82:1074–1078. doi: 10.1073/pnas.82.4.1074. [DOI] [PMC free article] [PubMed] [Google Scholar]
Associated Data
This section collects any data citations, data availability statements, or supplementary materials included in this article.


