Abstract
Dietary proteins are mostly absorbed as di- and tripeptides by the intestinal proton-dependent transporter PepT1. We have examined the effects of leptin on PepT1 function in rat jejunum and in monolayers of the human enterocyte-like 2 cell Caco-2. Leptin is produced by the stomach and secreted in the gut lumen. We show here that PepT1 and leptin receptors are expressed in Caco-2 and rat intestinal mucosal cells. Apical (but not basolateral) leptin increased Caco-2 cell transport of cephalexin (CFX) and glycylsarcosine (Gly-Sar), an effect that was associated with increased Gly-Sar uptake, increased membrane PepT1 protein, decreased intracellular PepT1 content, and no change in PepT1 mRNA levels. The maximal velocity (Vmax) for Gly-Sar transport was significantly increased by leptin, whereas the apparent Michaelis-Menten constant (Km) did not change. Furthermore, leptin-stimulated Gly-Sar transport was completely suppressed by colchicine, which disrupts cellular translocation of proteins to plasma membranes. Intrajejunal leptin also induced a rapid twofold increase in plasma CFX after jejunal perfusion with CFX in the rat, indicating enhanced intestinal absorption of CFX. These data revealed an unexpected action of gastric leptin in controlling ingestion of dietary proteins.
Introduction
The small intestine is the major site of dietary fat and protein absorption. Under physiological conditions, dietary proteins are degraded in a series of steps by hydrolytic enzymes originating in the stomach, pancreas, and small intestine. This results in a mixture of free amino acids and small peptides, mainly di- and tripeptides (1, 2) that are efficiently absorbed by enterocytes. Recently, a cDNA encoding an apical membrane protein that accounts for di- and tripeptide transport capability (PepT1) has been cloned (3–6). PepT1, which cotransports peptides with H+ (7), has a broad specificity that includes many di- and tripeptides (7, 8). In the small intestine, the H+-dependent PepT1 is expressed and localized at the brush border membrane in the duodenum, jejunum, and ileum (9). In contrast, PepT1 expression is not detected in the esophagus, stomach, or colon (9). Kinetic properties of PepT1, as well as its functional and structural characteristics, have been studied extensively by functional expression of PepT1 in Xenopus laevis oocytes (10, 11). In addition, human PepT1 (hPepT1) is appropriately expressed on the apical membrane of the human epithelial model cell line Caco-2 (7, 12–14), thus providing an in vitro model for analysis of the biology of this transporter.
Although there is some evidence indicating that feeding is a major regulator of peptide transport activity (15–19), little is known about the hormones and neurotransmitters that control peptide absorption and the intracellular signaling networks they trigger. Brush border peptide transport is inhibited by the activation of protein kinase C or an increase in intracellular Ca2+ (20). In addition, increasing intracellular cAMP levels by cholera toxin or forskolin treatment inhibited peptide transport (21), whereas the α2A adrenoceptor agonist clonidine (which decreases cAMP levels) stimulated transport of the peptidomimetic drug cephalexin (CFX) in the engineered Caco-2-3B cell line (22) and in the rat jejunum in vivo (23). One study reported that physiological levels of insulin induced a twofold increase in peptide transport in Caco-2 cells (24).
We require more data to understand the physiological mechanisms that control the absorption process of nutrients during the assimilation of a meal. This is particularly important because the PepT1 transport system can also be used to transfer a range of orally administered peptidomimetic drugs into the blood (25–28).
Leptin, the ob gene product, was initially reported to be produced by adipose cells (29). It is released into the circulation and transported across the blood-brain barrier into the hypothalamus, where it activates specific leptin receptors (30) that regulate energy homeostasis by altering energy intake and expenditure (31). Subsequent studies have shown that leptin is also produced by nonadipose tissues, including the stomach (32–34). Unlike adipocyte leptin, stomach-derived leptin is rapidly secreted into the blood and the gastric lumen after exogenous CCK-8 administration or feeding in rats (33), and after infusion of pentagastrin or secretin in humans (34). In addition, we recently emphasized that some of the stomach-derived leptin secreted in the gastric juice was not fully degraded by proteolysis (34). This suggests that it reaches the intestine in an active form, and thus can initiate biological processes involved in controlling functions of the intestinal tract, such as absorption and secretion. Therefore, we hypothesized that gastric leptin might control absorption of dietary proteins by modulating the activity of PepT1. This study was aimed at verifying this hypothesis.
We determined whether rat intestinal cells or human colon adenocarcinoma Caco-2 cells express leptin receptors. We also investigated the in vitro and in vivo effects of leptin on peptide transport by using glycylsarcosine (Gly-Sar) and the β-lactam antibiotic CFX as substrates for PepT1.
We demonstrated for the first time that apical leptin is involved in the control of intestinal peptide transport via the brush border transporter PepT1 in vitro in Caco-2 cells that exhibit enterocyte-like differentiation, and in vivo using a rat jejunal perfusion model.
Methods
Cell culture.
Caco-2 cells (passages 35–45) were cultured in DMEM supplemented with 20% FBS and 1% nonessential amino acids. Cells were kept at 37°C in 5% CO2 and 90% humidity. When confluent in 25-cm2 flasks, Caco-2 cells were trypsinized and plated at a density of 5 × 10⁴ cells/cm2 on collagen-coated permeable supports (Transwell-Clear 1-cm2 polyester membranes with 0.4-μm pores; Costar, Corning Inc., New York, New York, USA) for transport studies and cell-surface biotinylation studies. 6-well cluster trays were used for protein or membrane extractions. The medium was changed every day, and the cells were used at day 17 after seeding, except when otherwise stated. Whatever the passage used, the same differentiation phenomenon was observed, i.e., exponential growth from day 1 to day 7, with the Caco-2 cells remaining undifferentiated. At confluence (from day 10), the Caco-2 cells started to express a differentiated phenotype.
RT-PCR analysis.
Total RNA was extracted from Caco-2 cells using TRIzol reagent (Invitrogen, Carlsbad, California, USA). Briefly, 2 μg of total RNA was reverse transcribed with 200 U of reverse transcriptase using the Superscript II kit (Invitrogen) according to the manufacturer’s recommendations. hPepT1 was then amplified for 40 cycles in a total volume of 25 μl containing 1× PCR buffer (50 mM KCl and 20 mM Tris-HCl, pH 8.4), 200 μM dNTP, 1.5 mM MgCl2, 10 pmol of each sense and antisense primers, and 0.25 U Taq polymerase (Invitrogen). Primers specific for human PepT1 corresponding to nucleotide positions 210–229 (sense: 5′-TCCACCGCCATCTACCATAC-3′) and 689–708 (antisense: 5′-GGACAAACACAATCAGGGCT-3′) of the cDNA (accession number U13173) were used. The primers specific for leptin receptor isoform Ob-Rb corresponded to nucleotide positions 2,931–2,950 (sense: 5′-GCCAACAACTGTGGTCTCTC-3′) and 3,149–3,168 (antisense 5′-AGAGAAGCACTTGGTGACTG-3′) of the cDNA (GenBank accession number U66497).
The thermal cycling program was 95°C for 45 seconds, followed by a hybridization step at 58°C for 45 seconds and an elongation step at 72°C for 45 seconds. PCR products were separated on a 2% agarose gel and visualized by ethidium bromide.
Transport studies.
On the day of the experiment, transepithelial electrical resistance was measured in each well containing Caco-2 cells using a Millicel-ERS ohmmeter (Millipore SA, Molsheim, France). Before transport studies, the culture medium was removed, and the apical and basolateral compartments were washed three times with Krebs modified buffer of the following composition: 5.4 mM KCl, 2.8 mM CaCl2, 1 mM MgSO4, 0.3 mM NaH2PO4, 137 mM NaCl, 0.3 mM KH2PO4, 10 mM glucose, and 10 mM HEPES/Tris (pH 7.4) or 10 mM MES/Tris (pH 6.0). The pH was adjusted to 6.0 in the apical compartment and to 7.4 in the basolateral compartment. The cells were then incubated in Krebs modified buffer for 15 minutes at 37°C with continuous circular shaking. 3H Gly-Sar (specific activity 2.1 Ci/mmol; Isotopchim Chimie Fine, Peyruis, France) diluted with unlabeled Gly-Sar to a final concentration of 20 μM was added to the apical compartment at time 0. For competition studies, glycylglycine (Gly-Gly, 50 mM) was added to the apical compartment prior to the addition of 3H Gly-Sar. Iso-osmolarity in these studies was maintained by addition of 50 mM mannitol in control and leptin studies. Transepithelial electrical resistance was determined before and after treatment of the cells with or without leptin.
Gly-Sar flux from the apical to the basolateral compartment was measured in 50-μl aliquots taken every 10 minutes from the basolateral compartment over a period of 1 hour. Radioactivity was counted using a β counter. The effect of leptin (0.1–10 nM) was evaluated by comparing the average basal Gly-Sar flux (three samples taken during the 0- to 30-minute incubation period, which allowed drawing a regression line of flux over time) with the average flux measured after leptin addition at 30 minutes (three samples taken during the 30- to 60-minute incubation period) to the Caco-2 cell monolayer. The 0-to-30-minute period allowed exclusion of experiments in which basal Gly-Sar transport was threefold higher than the usual values. At the end of the incubation period with 2 nM leptin alone or in association with 50 mM Gly-Gly in the apical compartment, cell monolayers were washed with Krebs modified buffer (pH 7.4) to remove any loosely associated radiolabel. The cells were solubilized in 1 ml of 1 N NaOH, and cell-associated radioactivity was determined by liquid scintillation counting.
To examine the kinetics of peptide transport in Caco-2 monolayers, Gly-Sar transport was measured as a function of dipeptide concentration in the presence or absence of 2 nM leptin added to the apical compartment. Furthermore, the effect of 2 hours pretreatment with brefeldin A and colchicine was studied on leptin-induced (2 nM) Gly-Sar transport in Caco-2 cell monolayers.
To discount any effect of leptin on paracellular permeability, transport experiments were performed at 4°C or using [14C]mannitol as nontransported substrate in the presence or absence of leptin added to the apical compartment.
In another set of experiments, CFX was used as a substrate for PepT1. The same protocol as for 3H Gly-Sar was used, except that aliquots were taken every 5 minutes for a period of 30 minutes, and no radioactive marker was used. CFX was measured in the samples by HPLC as described below.
Protein extraction.
Cells from different areas of the intestine (jejunum, ileum, and colon) were isolated as previously described (35). Briefly, rat jejunum crypt cells were separated from villus cells by shaking the everted jejunum for successive periods in a dispersing solution containing EDTA. Cell fractions were characterized by optical microscopy. (Villus sheets are morphologically different from crypts, which are composed of rows of columnar epithelial cells.) Villus cells were then characterized by their brush border–associated alkaline phosphatase activity, which was six times higher in villus cells than in crypt cells, as reported (35). Rat ileal and colonic cells were isolated as described (36). Caco-2 cells were washed twice with ice-cold PBS, scraped from the well, and centrifuged at 2,000 g at 4°C for 5 minutes.
For total protein extraction, intestinal cell or Caco-2 cell pellets were homogenized at 4°C in lysis buffer containing 0.1 mg/ml PMSF, 100 μM benzamidine, and 100 mM NaVO4.
For membrane preparations, the Caco-2 pellet was resuspended and carefully homogenized in HEPES (5 mM) containing the above protease inhibitors. The pellet was then incubated for 30 minutes at 4°C and centrifuged at 13,000 g at 4°C for 30 minutes. The resulting pellet was suspended in PBS by repeated passage through an 18-gauge needle.
For intracellular protein extraction, filter-grown cells were rinsed with PBS supplemented with 0.1 mM CaCl2 and 1 mM MgCl2. Basolateral and apical sides of the monolayers were incubated with freshly prepared sulfosuccinimidobiotin (sulfo-NHS-biotin; Pierce, Rockford, Illinois, USA) diluted in the same supplemented PBS solution (0.5 mg/ml) for 30 minutes at 4°C. The reaction was quenched with 50 mM NH4Cl, and cells were lysed with a solution of 1% (wt/wt) Triton X-100 in 20 mM Tris (pH 8.0), 50 mM NaCl, 5 mM EDTA, and 0.2% (wt/vol) BSA supplemented with protease inhibitors. The protein solution was diluted with 500 μl of lysis buffer and then incubated with streptavidin-agarose (Pierce) for 24 hours at 4°C to bind biotinylation proteins. The solution was then centrifuged at 13,000 g at 4°C for 30 minutes, and the resulting supernatant corresponding to the intracellular protein was saved. Protein concentration was determined using the Bio-Rad Protein Assay (Bio-Rad Laboratories, Hercules, California, USA).
Western blot analysis.
Proteins (20–40 μg) were resolved on 7.5% SDS-PAGE gels. Resolved proteins were transferred to nitrocellulose membranes and subjected to immunoblot analysis. The blots were blocked for 1 hour with 5% nonfat dry milk in blocking buffer. After washing with blocking buffer, the blots were incubated for 1 hour at 37°C with a 1:1,000 dilution of a rabbit anti-hPepT1 serum. Anti-hPepT1 was raised against the C-terminal 20 amino acids of hPepT1 (14) or with goat anti-leptin receptor antibodies (1:750 dilution) M-18, raised with synthetic peptide KNCSWAQGLNFQKRTDTL, or K-20, raised with synthetic peptide KLFCGPPNTTDDSFLSPA) (Santa Cruz Biotechnology Inc., Santa Cruz, California, USA). After washing twice for 30 minutes in nonfat dry milk in blocking buffer, blots were further incubated for 1 hour at 37°C with anti-rabbit (for hPepT1) or anti-goat (for leptin receptors) horseradish peroxidase–conjugated Ob-R antibody, diluted to 1:1,000. The specificity of the immunoreactive bands for leptin receptor was checked by overnight preadsorption of the antiserum with the corresponding homologous peptide (20 μg per ml of diluted antiserum) before immunoblotting. The membrane was washed twice for 30 minutes in nonfat dry milk in blocking buffer and then probed using the ECL chemiluminescence system (Amersham Pharmacia Biotech, Piscataway, New Jersey, USA). The intensity of the bands was quantified using NIH Image (Scion Corp., Frederick, Maryland, USA). The results were expressed in relation to the vehicle-treated cells, and the value of each time control was arbitrarily set to 1. Results are expressed as mean ± SEM.
Northern blot analysis.
Total RNA was isolated from Caco-2 cells with TRI Reagent (Molecular Research Center Inc., Cincinnati, Ohio, USA). Total RNA (20 μg) was denatured by heating at 65°C in 20 mM HEPES (pH 7.2), 1 mM EDTA, 50% formamide, and 6% formaldehyde for 15 minutes, then subjecting it to electrophoresis on a 1.2% agarose gel containing 2% formaldehyde. Resolved RNA was transferred to a nylon membrane (NEN Life Science Products Inc., Boston, Massachusetts, USA) and covalently cross-linked by exposure to UV light. Hybridization was performed in a solution containing 7% SDS, 1% BSA, 10% polyethylene glycol 8000, 250 mM NaCl, 1.25 mM EDTA (pH 8.0), and 125 mM Na2HPO4. hPepT1 cDNA probe (2.6 kb) was labeled with [α-P32]cytidine-5′-triphosphate using the Rediprime II random primer labeling system (Amersham Pharmacia Biotech). A GAPDH cDNA probe was used as control (Ambion Inc., Austin, Texas, USA).
Animals.
All studies were carried out in male Wistar rats (260–280 g) (Iffa Credo, L’Arbresle, France) that had been deprived of food for 18 hours with water available ad libitum. The animals were treated in accordance with European Community Standards concerning the care and use of laboratory animals (INSERM and Ministère de l’Agriculture et de la Forêt, Paris, France).
Jejunal perfusion technique.
The rats were anesthetized with intramuscular ethylurethane (1.2 g/kg; Prolabo, Paris, France). A laparotomy was performed, and an inflow cannula made of Silastic tubing (1.65 mm outside diameter, 0.76 mm inside diameter, 10 cm long) (Dow Corning Corp., Midland, Michigan, USA) was inserted in the jejunum approximately 1 cm below the ligament of Treitz. An outflow cannula was set up at a distance of 10 cm. The bile duct was ligated to prevent possible enterohepatic recycling of CFX. The jejunal segment was then flushed with saline solution (prewarmed to 37°C) to remove residual intestinal contents. Perfusion solutions were delivered with a peristaltic pump at a flow rate of 4 ml/15 min (Minipuls 2; Gilson Co., Paris, France) through an inlet tube water-jacketed at 37°C before its entry into the jejunal segment. The solution used for jejunal perfusion was a Krebs-Ringer buffer (pH 7.5) containing 0.5 mM MgCl2, 4.5 mM KCl, 120 mM NaCl, 0.7 mM Na2HPO4, 1.5 mM NaH2PO4, 1.2 mM CaCl2, 15 mM NaHCO3, 10 mM glucose, and 20 mg/l of phenolsulfonphthalein as a nonabsorbable marker. After a 30-minute stabilization period, 20 or 100 nM of recombinant murine leptin or vehicle was added in Krebs-Ringer buffer. For peptide transport studies, 1 mM CFX (Sigma Chemical Co., St. Louis, Missouri, USA) was dissolved in Krebs-Ringer buffer with or without 50 mM Gly-Gly. During each 15-minute period, the perfusion fluid was collected, and sodium chloride, total CO2, calcium, glucose, and water fluxes were determined by current biochemical methods using a laboratory automate (Koné, Evry, France). Blood was collected for CFX determination as described below.
To calibrate the system, the response to an intravenous infusion of 30 and 100 μg/kg/h of vasoactive intestinal peptide (VIP) (Neosystem, Strasbourg, France) was determined. These doses of VIP have been previously shown to respectively inhibit basal absorption and stimulate secretion of water and electrolytes in rat jejunal loops in situ (37).
Blood sampling.
A short polyethylene catheter (0.58 mm inside diameter, 0.965 mm outside diameter, 15 mm long) (Becton Dickinson and Co., Parsippany, New Jersey, USA) was inserted into a carotid artery and secured by a double ligature around the polyethylene part of the catheter. The rat was immediately injected with 250 IU/kg heparin through the catheter and the carotid was immediately clamped. Blood samples (0.4 ml) were collected in tubes containing EDTA (0.08 mg). They were centrifuged at 10,000 g for 3 minutes, and plasma was collected and stored at –20°C until the CFX assay. To compensate for blood loss, an equal volume of Haemaccel (Fresenius Kabi France, Sevres, France) was injected through the carotid catheter after each blood sample was taken. During the experiments, normal body temperature was maintained with a heating device.
HPLC determination of CFX.
The CFX concentration in plasma was determined by HPLC. Two hundred microliters of plasma, 40 μl of water, and 300 μl of acetonitrile (Merck Eurolab, Fontenay-sous-Bois, France) were mechanically mixed. The mixture was centrifuged at 6,700 g for 5 minutes. Then 4 ml of dichloromethane (Merck Eurolab) was added to the supernatant, the mixture was shaken for 15 minutes, and 50 μl of the aqueous supernatant was injected into the chromatograph. Chromatographic separation was performed on a Supelcosil LC-18 column, 250 × 4.6 mm, 5 μm (Sigma Aldrich, St. Quentin-Fallavier, France) attached to an SPD-6AV UV detector and an integrator (Eurosep Instruments, Cergy-Pontoise, France). The flow rate was 1.5 ml/minute. The mobile phase was composed of 0.01 M sodium acetate buffer, pH 5.2 (Prolabo), and acetonitrile (94.5:5.5 vol/vol).
Immunohistochemical studies.
Rats were anesthetized with intraperitoneal sodium pentobarbital (40 mg/kg), and the jejunum was removed and embedded in OCT frozen in liquid nitrogen, and stored. Sections (7 μm) of jejunum were incubated in normal rabbit serum (1:1,000) for 20 minutes, followed by an overnight incubation at 4°C with C-terminal leptin receptor antibody M-18 (dilution 1:50) raised with synthetic peptide KNCSWAQGLNFQKRTDTL (Santa Cruz Biotechnology Inc.). The slides were then incubated with biotinylated anti-goat IgG diluted 1:400. Immunohistochemical staining was performed using streptavidin peroxidase complex (DAKO Corp., Carpinteria, California, USA) and 3′,3′-diaminobenzidine hydrochloride as a peroxidase chromogen (Sigma Chemical Co.). The specificity of the reaction was tested by omitting the primary antibody and by preabsorption of the antiserum with the homologous synthetic peptide (40 μg per ml of diluted antiserum) overnight before immunohistochemistry studies. Nuclei were counterstained with Mayer’s hemalum.
Statistical analysis.
Results are expressed in the figures and table as mean ± SEM. Values were compared by ANOVA, followed if significant by the Dunnett multigroup comparison test or by the nonparametric Mann-Whitney U test when the variances of the groups compared were different.
Results
Caco-2 cells express PepT1 and leptin receptors.
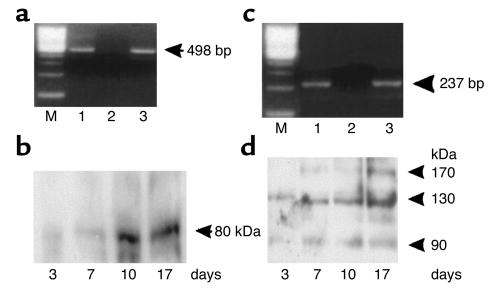
RT-PCR and Western blot analysis were used to study the expression of the oligopeptide transporter PepT1 as a function of cell differentiation. A 498-bp product, corresponding to nucleotide positions 210–708 of hPepT1, and 100% identical to the hPepT1 transcript as confirmed by cDNA sequencing, was detected 3 days and 17 days after seeding (Figure 1a). The amount of PepT1 immunoreactive protein (80 kDa) was very low after 3 days, progressively increased after confluence was reached (day 7), and remained at a high level after confluence (days 10–17) (Figure 1b). These results confirm previous studies showing that Caco-2 cells are a good in vitro model for analyses of the biology of hPepT1 (7, 13, 14).
Figure 1.
Expression of PepT1 and leptin receptors in Caco-2 cells. Three to seventeen days after cell seeding, total RNA and total protein were extracted and subjected to RT-PCR and Western blot analysis, respectively. (a) RT-PCR of hPepT1 RNA. Lane 1, Caco-2 cells after 3 days of culture. Lane 2, negative control omitting reverse transcriptase. Lane 3, Caco-2 cells after 17 days of culture. Arrow indicates the expected size (498 bp) of the PCR product. (b) Western blot analysis of hPepT1 protein. A polyclonal anti-hPepT1 antibody was used. This representative immunoblot shows a ∼80-kDa protein that varies with the differentiation state of the Caco-2 cells (3 to 17 days of culture). (c) RT-PCR analysis of Ob-Rb RNA. Lane 1, Caco-2 cells after 3 days of culture. Lane 2, negative control omitting reverse transcriptase. Lane 3, Caco-2 cells after 17 days of culture. Arrow indicates the expected size (237 bp) of the PCR product. (d) Western blot analysis of leptin receptor protein. In this representative immunoblot, immunoreactive proteins of approximately 90 kDa, 130 kDa, and 170 kDa were detected in Caco-2 cells.
A 237-bp product corresponding to nucleotide positions 2,931–3,168 of Ob-Rb was detected 3 days and 17 days after seeding (Figure 1c). It was 100% identical to the human Ob-Rb transcript as confirmed by cDNA sequencing. The amount of 130-kDa immunoreactive leptin receptor protein was very low 3 days after seeding, and increased along with cell differentiation. An additional ∼170-kDa immunoreactive leptin receptor protein was detected at day 17 (Figure 1d), and probably corresponded to a glycosylated form of the long isoform of the leptin receptor.
Intestinal cells express leptin receptor proteins.
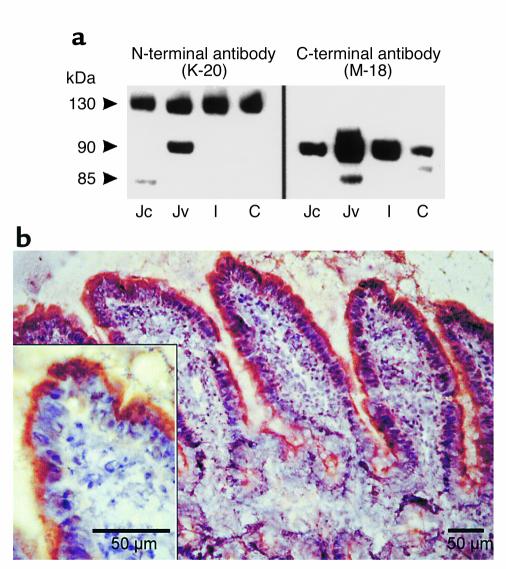
The leptin receptor proteins were detected by immunoblotting intestinal extracts, using an N-terminal leptin receptor antibody that recognizes all leptin receptor isoforms, and a C-terminal leptin receptor antibody that recognizes only short leptin receptor isoforms (Figure 2a). Two Ob-R immunoreactive proteins, with relative molecular masses of approximately 130 and 90 kDa, corresponding to Ob-Rb and one of the short forms of Ob-R, respectively, were detected with the N-terminal Ob-R antibody (Figure 2a, left panel). The ∼130-kDa protein was detected in the intestinal cells from jejunum to colon. With the C-terminal antibody (Figure 2a, right panel), two immunoreactive proteins of 90 and 85 kDa were detected. The 90-kDa protein was present in all intestinal sections from the jejunum to the colon; it was most highly expressed in the jejunum villus cells. The 85-kDa protein was detected in the jejunum with a prominent band in the villus cells. Both of these immunoreactive bands were leptin receptor–specific, since they were no longer detected after antibody adsorption with the corresponding peptide (not shown). Immunohistochemical studies further demonstrated leptin receptor proteins in jejunal mucosa. With the C-terminal antibody, the immunostaining was located at the brush border membrane of the enterocytes (Figure 2b). Collectively, these results indicate that human intestinal Caco-2 cells and rat enterocytes contain leptin receptors.
Figure 2.
Expression of leptin receptor proteins in rat intestinal epithelium. (a) Western blot analysis of isolated rat jejunal villus (Jv), jejunal crypt (Jc), ileal (I), and colonic (C) cell extracts with anti–leptin receptor antibodies. At left are representative immunoblots with antibody K-20, an N-terminal leptin receptor antibody that recognizes all leptin receptor isoforms. Immunoreactive proteins of ∼90 and ∼130 kDa were detected. At right are representative immunoblots with antibody M-18, a C-terminal leptin receptor antibody that recognizes only short leptin receptor isoforms. Immunoreactive proteins of ∼85 and ∼90 kDa were detected. (b) Immunostaining of leptin receptor in a frozen section of the rat jejunum. Jejunum sections were prepared and incubated with a C-terminal leptin receptor antibody as described in Methods. Immunostaining was detected in the brush border of enterocytes. Inset: High magnification of the staining at the apex of the jejunal enterocytes. Bar = 50 μm.
Leptin increases transepithelial flux of Gly-Sar and CFX in Caco-2 cell monolayers.
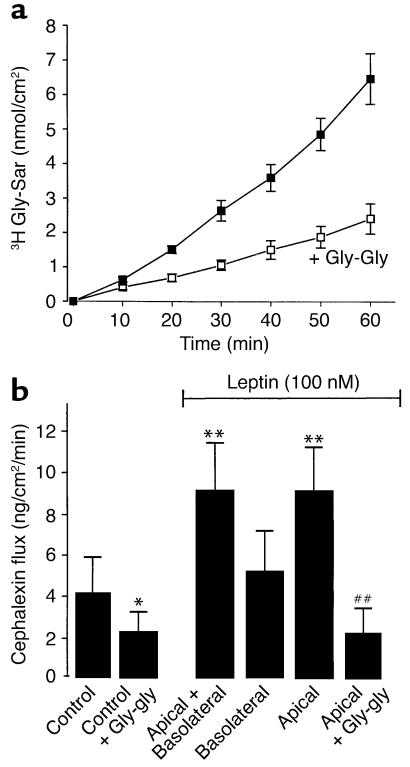
To measure transepithelial peptide transport, Caco-2 cell monolayers were incubated for 60 minutes with 3H Gly-Sar or CFX in the apical compartment at pH 6.0, the optimum pH for hPepT1-mediated dipeptide uptake across the apical plasma membrane in Caco-2 cell monolayers. The amount of Gly-Sar transported from the apical to the basolateral compartment increased linearly with incubation time (Figure 3a). Gly-Gly is known to be transported by hPepT1 and to competitively inhibit Gly-Sar uptake across the apical membrane of Caco-2 cell monolayers. We demonstrated that 50 mM Gly-Gly added to the apical reservoir inhibited transepithelial peptide transport (Gly-Sar) by 65%. Similar results have been found with CFX (data not shown).
Figure 3.
Gly-Sar and CFX transport in Caco-2 cells. (a) Time course of basal Gly-Sar transport. Transport of Gly-Sar was measured in confluent monolayers of Caco-2 cells every 10 minutes for 60 minutes at 37°C with continuous circular shaking. The pH was 6.0 in the apical compartment and 7.4 in the basolateral compartment. Gly-Gly (50 mM) decreased basal transport of Gly-Sar. Results are mean ± SEM (n = 6 experiments). (b) Leptin effect on CFX transport in Caco-2 cells. In these experiments, basal CFX transport was measured from 0 to 15 minutes; leptin was added 15 minutes after CFX, and CFX transport in the presence of leptin in either the basolateral or apical compartment, or in both compartments, was measured from time = 15 minutes to time = 30 minutes. For competition studies, Gly-Gly (50 mM) was added at time = 0. Results are mean ± SEM (n = 4 experiments). *P < 0.05 vs. control; **P < 0.01 vs. control. ##P < 0.01 vs. apical leptin.
Under basal conditions, the apical-basolateral CFX flux was 4 ng/cm2/min (Figure 3b). The addition of 100 nM leptin to both sides (apical and basolateral) of the Caco-2 cell monolayers induced a twofold increase in CFX transport (Figure 3b). Addition of 100 nM leptin exclusively to the apical compartment resulted in a twofold increase in CFX flux that was similar to that observed when leptin was present on both sides (apical and basolateral), while addition of leptin to the basolateral compartment alone had no effect on CFX transport. This apical effect of leptin on CFX transport was completely suppressed by the apical addition of Gly-Gly in excess (50 mM) (Figure 3b).
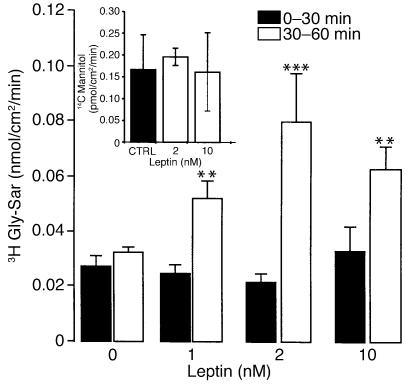
A similar increase in Gly-Sar transport was observed after apical incubation with leptin. This apical effect was concentration dependent: apical to basolateral Gly-Sar transport increased twofold with 1 nM leptin, and fourfold with 2 nM leptin (Figure 4). In addition, the apical to basolateral mannitol flux was not altered after treatment with leptin, indicating that leptin had no effect on paracellular permeability (Figure 4, inset).
Figure 4.
Dose-response curve of Gly-Sar transport stimulation by leptin. Caco-2 cells were used at day 17. At time = 30 minutes, vehicle (0) or different concentrations of leptin (1–10 nM) were added to the apical compartment containing Gly-Sar. Basal apical to basolateral Gly-Sar or mannitol fluxes were measured between 0 and 30 minutes (Gly-Sar + vehicle or mannitol + vehicle) and compared with fluxes between 30 and 60 minutes (Gly-Sar + leptin or mannitol + leptin) as described in Methods. Inset: Effect of leptin (2 nM and 10 nM) treatment on apical to basolateral flux of 14C mannitol (0,5 μCi/well). Results represent mean ± SEM of six determinations. **P < 0.01 vs. control. ***P < 0.0001 vs. control.
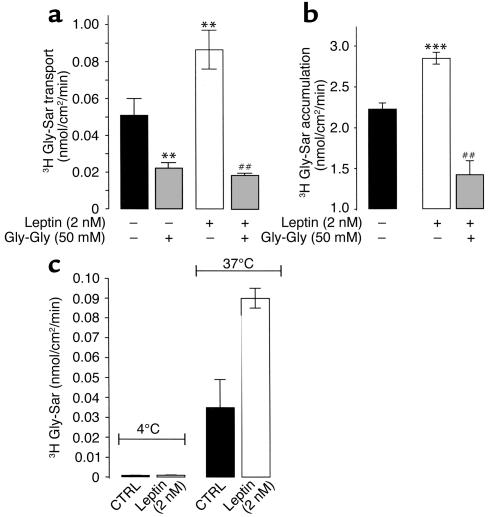
Moreover, the addition of an excess of Gly-Gly (50 mM) to the apical compartment resulted in a drastic decrease in basal Gly-Sar transport, and completely suppressed the leptin-induced (2 nM) increase in Gly-Sar transport (Figure 5a). This increase of Gly-Sar transport was associated with an increase in intracellular accumulation of Gly-Sar that was significantly reduced in the presence of an excess of Gly-Gly (Figure 5b). This leptin stimulation of Gly-Sar transport was temperature dependent, and was no longer observed when the cells were incubated at 4°C (Figure 5c). The transepithelial electrical resistance (TEER) per cm2 in control cells (548 ± 5 Ω, n = 12) was not significantly different from the TEER per cm2 in leptin-treated cells (551 ± 6.4 Ω, n = 12). Together, these data indicate that leptin improvement of apical-basolateral peptide transport involves a carrier-mediated process.
Figure 5.
Effect of leptin on Gly-Sar transport and uptake in Caco-2 cell monolayers. Transport (a) or uptake (b) of Gly-Sar were measured in confluent monolayers of Caco-2 cells at day 17 every 10 minutes for 60 minutes with continuous circular shaking. The pH was 6.0 in the apical compartment and 7.4 in the basolateral compartment. Basal apical to basolateral Gly-Sar movement was measured between 0 and 30 minutes (Gly-Sar + vehicle) and compared with fluxes between 30 and 60 minutes (Gly-Sar + leptin) as described in Methods. At the end of the incubation period with 2 nM leptin in the apical compartment, cell monolayer–associated Gly-Sar was determined. Results represent mean ± SEM of six determinations. **P < 0.01 vs. control. ##P < 0.01 vs. apical leptin (2 nM). (c) Temperature dependence (4°C vs. 37°C) of leptin-stimulated apical to basolateral Gly-Sar transport. Results are mean ± SEM of six experiments.
Leptin increases maximal velocity and membrane PepT1 protein in Caco-2 cell monolayers.
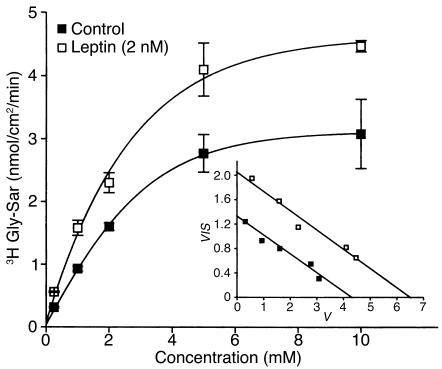
To determine whether leptin might affect peptide transport by modifying the intrinsic activity of PepT1, the effect of leptin on the kinetics of Gly-Sar transport was studied (Figure 6). Kinetics analysis of the data (Figure 6, inset) indicated that leptin significantly increased the maximal velocity (Vmax) (6.55 ± 0.31 nmol/cm2/min vs. 4.33 ± 0.09 nmol/cm2/min for control; P < 0.01), but did not modify the Michaelis-Menten constant Km (0.30 ± 0.03 mM vs. 0.31 ± 0.04 mM for control, NS, P > 0.05). These data exclude changes in the affinity of PepT1 for Gly-Sar upon leptin challenge.
Figure 6.
Effect of leptin on kinetic parameters of Gly-Sar transport in Caco-2 cells. Transport of Gly-Sar was measured in confluent monolayers of Caco-2 cells at day 17, every 10 minutes for 60 minutes with continuous circular shaking. The pH was 6.0 in the apical compartment and 7.4 in the basolateral compartment. After 15 minutes of equilibration, Gly-Sar was added to the apical compartment with or without 2 nM leptin. Figure shows apical to basolateral steady-state fluxes of Gly-Sar as a function of apical Gly-Sar concentration in control monolayers and in monolayers treated with 2 nM leptin. Results are mean ± SEM of four experiments. Inset: Eadie-Hofstee plots (V vs. V/S) of Gly-Sar flux, where V is rate of transepithelial flux (nmol/cm2/min) and S is substrate concentration (mM).
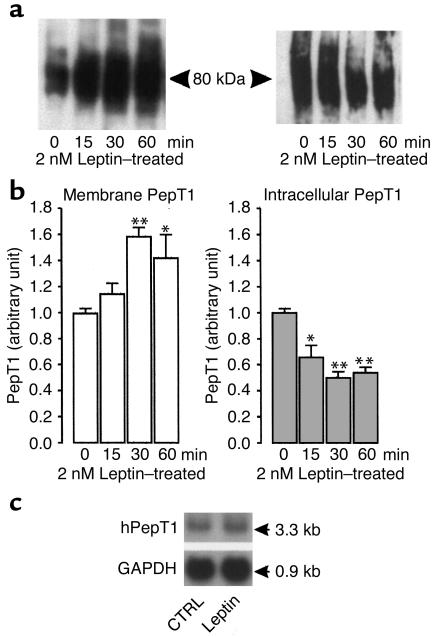
To further investigate the mechanism of leptin action, we carried out Western blot analysis using the anti-hPepT1 antibody on plasma membranes and intracellular proteins prepared from vehicle- or leptin-treated cells (Figure 7). In vehicle-treated cells, the amount of membrane PepT1 immunoreactive protein did not change with incubation time. Apical addition of leptin (2 nM) induced a time-dependent increase in the amount of membrane PepT1 and a decrease in the intracellular content of PepT1 (Figure 7a).
Figure 7.
Leptin modifies the amount of PepT1 protein in Caco-2 cell monolayers. Confluent Caco-2 cells were incubated for different periods of time with vehicle or 2 nM recombinant murine leptin added to the apical compartment. The Caco-2 cells were washed twice with ice-cold PBS, scraped from the well, and centrifuged. Membrane proteins were extracted as described in Methods. For intracellular extracts, apical and basolateral membranes were excluded by biotinylation. Membranes and intracellular proteins were subjected to Western analysis. (a) Representative immunoblots of hPepT1 protein in membranes of leptin-treated cells (left) and in intracellular extracts from leptin-treated cells (right). A band of ∼80 kDa was detected in each. (b) Densitometric analysis of immunoblots of hPepT1 protein. The changes are expressed as mean ± SEM of three to four analyses. The levels of PepT1 at each incubation time were calculated in relation to the vehicle-treated cells, and the value of each time control was arbitrarily set to 1. *P < 0.05 and **P < 0.01 vs. vehicle. (c) Effect of leptin on abundance of mRNA encoding hPepT1. Caco-2 cells were incubated with vehicle (CTRL) or leptin (2 nM) for 60 minutes. Total mRNA was extracted from control and leptin-treated cells and subjected to Northern blot analysis using 32P-labeled cDNAs encoding hPepT1 and GAPDH.
Densitometric analysis of the immunoblots showed a rapid and significant increase (+60% at 30 minutes, P < 0.01 vs. control) in the amount of membrane PepT1 protein. This increase was still observed 60 minutes (+45%, P < 0.05 vs. control) after exposure to leptin. It was associated with a significant decrease in the amount of intracellular PepT1 protein (–50% at 30 minutes, P < 0.01) (Figure 7b) that was still observed 60 minutes after apical addition of leptin (–40%, P < 0.01 vs. control).
Northern blot analysis of total RNA extracted from vehicle- or leptin-treated cells further showed that PepT1 mRNA levels were not significantly different in the two groups 60 minutes after apical exposure to leptin (Figure 7c).
Colchicine but not brefeldin A inhibits the leptin-induced increase in transepithelial flux of Gly-Sar in Caco-2 cell monolayers.
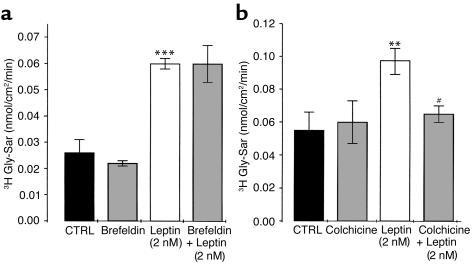
To get a deeper insight into the mechanism of leptin effect, brefeldin A and colchicine were used as pretreatments. Brefeldin A selectively breaks up the Golgi apparatus that is essential for the processing of newly synthesized PepT1 (38); colchicine disorganizes the microtubules, disrupting the translocation of proteins targeted for membrane insertion (39, 40). Brefeldin pretreatment did not affect basal- or leptin-induced Gly-Sar transport (Figure 8a), whereas colchicine pretreatment significantly reduced the leptin stimulation of Gly-Sar transport in Caco-2 cell monolayers (Figure 8b).
Figure 8.
Colchicine but not brefeldin suppressed leptin-stimulated Gly-Sar transport. (a) Brefeldin (5 μM), (b) colchicine (10 μM), or vehicle (CTRL) was added to Caco-2 cell monolayers for preincubation 2 hours before Gly-Sar was added to the apical compartment at time = 0. At time = 30 minutes, vehicle (CTRL) or leptin (2 nM) was added to the apical compartment containing Gly-Sar. Basal apical to basolateral Gly-Sar fluxes were measured between 0 and 30 minutes (Gly-Sar + vehicle) and compared with fluxes between 30 and 60 minutes (Gly-Sar + leptin) as described in Methods. Results represent mean ± SEM of four determinations. **P < 0.01 and ***P < 0.001 vs. control. #P < 0.01 vs. 2 nM leptin alone.
Leptin increases CFX transport without affecting electrolyte fluxes in vivo in rats.
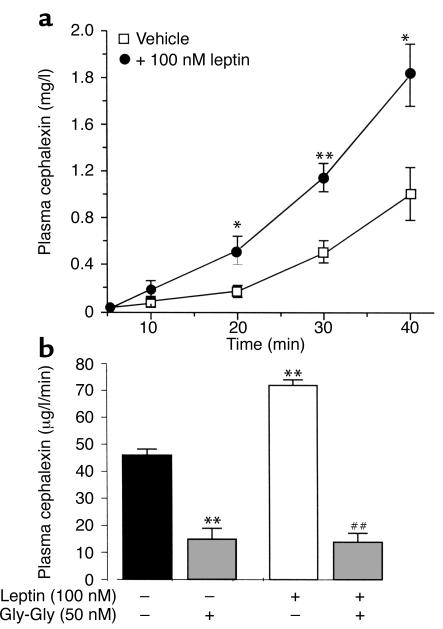
When CFX was infused at a constant rate into the jejunum of anesthetized rats (basal conditions), plasma CFX concentration increased as a function of perfusion time (Figure 9a). Concomitant intrajejunal perfusion with leptin (100 nM) induced a significant increase of CFX absorption across the intestinal mucosa. This increase was also observed with a lower concentration of leptin (20 nM), but was not statistically significant (not shown). After 100 nM leptin, plasma CFX increased by 150% within 20 minutes (P < 0.05 vs. vehicle); this increase reached 80% (P < 0.01 vs. control) after 40 minutes of perfusion (Figure 9a). The addition of an excess of Gly-Gly (50 mM) decreased basal CFX absorption by about 70%, and completely abolished the leptin effect (Figure 9b), indicating that the transepithelial transport of CFX and the effect of leptin are PepT1 specific.
Figure 9.
Leptin increases CFX absorption in vivo. (a) Evolution of plasma concentration of CFX during intrajejunal perfusion with 1 mM CFX (along with vehicle or 100 nM leptin) for 40 minutes. Results represent mean ± SEM in groups of six rats. *P < 0.05 and **P < 0.01 vs. vehicle. (b) Plasma concentration of CFX in the presence of 50 mM Gly-Gly competing for the dipeptide transporter in the jejunal lumen. Results represent mean ± SEM in groups of six rats. **P < 0.01 vs. control. ##P < 0.01 vs. leptin alone.
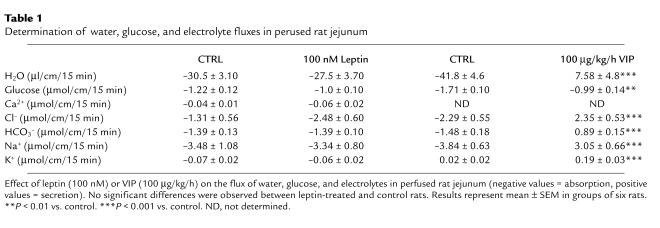
Under the same conditions of jejunal perfusion, leptin (100 nM) did not alter the flux of water, electrolytes (Ca2+, Na+, K+, HCO3–, and Cl–), or glucose; the perfused jejunal segments did respond to VIP with a dose-related increase of water and electrolyte secretion (Table 1). Finally, macroscopic and histological examinations showed no significant differences in the aspect of perfused intestinal segments of rats treated with vehicle or leptin (not shown). These results confirm the specificity of leptin’s effect on the PepT1-mediated transport of peptides.
Table 1.
Determination of water, glucose, and electrolyte fluxes in perused rat jejunum
Discussion
We provide evidence in this report that leptin can increase the transport of peptides across the intestinal epithelial barrier via the proton-dependent transporter PepT1, suggesting that leptin might be a key parameter in the hormonal regulation of this transporter.
There is now compelling evidence showing that dietary proteins are absorbed as di- and tripeptides rather as free amino acids (2, 41–43). This absorption process is carried out by the intestinal brush border transporter PepT1, which transfers peptides from a region of low (intestinal lumen) to a region of high (enterocyte cytoplasm) dipeptidase activity. Therefore, PepT1 appears to be essential for the efficient absorption of dietary proteins, and thus for nitrogen supply to the organism. Most studies on PepT1 transporter have focused on its fundamental kinetic properties and its functional and structural characterization (10, 11, 44). Few reports have dealt with the metabolic regulation of PepT1, although there is strong evidence of its long-term molecular regulation by feeding (18, 19). Fasting (45) and a high-protein diet (15) have each been shown to increase the levels of PepT1 mRNA and protein in the brush border of intestinal cells. Recently, we demonstrated that different alterations of the enteric neuronal input to the intestinal epithelium also resulted in a short term control of PepT1 in the rat in vivo (23).
We demonstrate first herein that leptin increases peptide transport via the intestinal proton-dependent transporter, PepT1, in Caco-2 cells in vitro. The human intestinal Caco-2 cell line is a commonly used in vitro model for studying intestinal epithelial permeability (46). This cell line spontaneously differentiates into polarized cell monolayers with microvilli on the apical surfaces, thus constituting an interesting enterocyte model under standard cell culture conditions (47). After reaching confluence, these cells express a whole set of brush border membrane enzymes, which are differentiation markers of small intestine enterocytes (47), as well as most transporters found normally in the small intestine, such as PepT1. These properties make this cell line a useful in vitro model for the investigation of enterocyte functions. We confirm herein that Caco-2 cells express PepT1 and show that PepT1 transcript was detected 3 days after seeding, and that the amount of PepT1 protein steadily increased from day 3 and remained at high levels after cells reached confluence. This time-dependent increase in the amount of PepT1 is concordant with the demonstration that the transepithelial transport of Gly-Sar (which was detectable as early as 7 days after seeding) steadily increased to reach maximal transport at day 14, and was maintained at days 18 and 21 of culture (7). We also demonstrated that leptin induces a short-term two- to fourfold stimulation of Gly-Sar and CFX transport via PepT1. Interestingly, leptin improved peptide transport only when it was incubated in the apical compartment facing Caco-2 cells in vitro.
These data obtained with Caco-2 cells were further confirmed in vivo in the rat jejunum, where intraluminal leptin induced a twofold increase in plasma CFX concentration after jejunal perfusion with CFX, thus indicating enhanced intestinal absorption of CFX. The enhancement of CFX transport by leptin was completely suppressed by an excess of dipeptides. However, intrajejunal leptin did not alter the flux of glucose, water, or electrolytes, thus demonstrating that this control of di- and tripeptide transport was independent of water, electrolyte, and glucose fluxes (48). This observation is line with data showing that insulin treatment does not affect glucose transport (49), but increases dipeptide transport in Caco-2 cells (24). Therefore, it appears that leptin increase of peptide transport is likely to involve PepT1.
The effect of leptin when added to the apical pole of Caco-2 cells or of normal enterocytes is consistent with the demonstration that Caco-2 and rat intestinal (jejunum to colon) cells express leptin receptors. Indeed, the relative molecular mass (Mr) of the 130-kDa band that was immunoreactive to the N-terminal anti–leptin receptor antibody was consistent with the predicted Mr of Ob-Rb, based on its amino acid composition. It was also similar to the reported Mr of pancreatic islets transfected with Ob-Rb cDNA to overproduce wild-type Ob-Rb (50). The ∼90-kDa protein that was also observed probably corresponds to short isoforms of the leptin receptor. The ∼85-kDa protein found in villus cells of the rat jejunum that was no longer detected after immunoadsorption does not correspond to any of the known short leptin receptors on the basis of amino acid composition. This band could represent a degradation product of leptin receptor or a novel leptin receptor protein in the jejunum.
The leptin receptor is a member of the gp130 family of cytokine receptors. It occurs in several isoforms (Ob-Ra through Ob-Rf) that result from alternative splicing of the Ob-R gene (51, 52). In the present study, immunohistochemical studies of jejunum mucosa localized the short leptin receptor isoforms on the brush border membranes. In a number of polarized epithelial cell lines, several receptors belonging to the cytokine receptor family have been shown to produce different biological responses according to their apical or basolateral localization. This is the case for EGF receptors (53), adenosine receptors (54, 55), and chemokine receptors (56). In enterocytes, the apical receptor for HGF, c-Met, activates growth and differentiation through an src-related kinase, gastrointestinal tyrosine kinase (57). These data indicate that receptors on the intestinal brush border can transmit biological signals to control enterocyte functions. Therefore, one could tentatively suggest that apical leptin enhances intestinal absorption of oligopeptides through interaction with brush border short leptin receptors.
However, only the Ob-Rb isoform, which contains the binding motifs required to activate the JAK/STAT signaling pathway, is thought to mediate the biological effects of leptin (58, 59). Morton et al. showed that human Caco-2 cells and mouse jejunum cells express the STAT-3 and STAT-5b proteins, which are major elements of leptin-driven signal transduction pathways (60). These authors showed that intravenous leptin rapidly stimulates nuclear STAT-5 DNA binding activity in mouse jejunum in vivo, which results in a reduction of the fat load–stimulated apoA-IV mRNA, an apolipoprotein involved in the transport of triglycerides into the circulation (60). Although we cannot exclude the involvement of this signal transduction mechanism in long-term regulation of PepT1, this pathway is unlikely to operate under our conditions because it requires activation of gene transcription, and therefore the effect cannot occur as rapidly as the peptide transport increase observed (within 30 minutes) in the present study. Collectively, these results point out a new role for gastric leptin by providing clear evidence of apical leptin stimulation of intestinal peptide transport.
Short-term regulation of peptide absorption involves either modulation of the intrinsic activity of transporter molecules or membrane insertion of additional transporter molecules recruited from a preexisting intracellular pool. In our study, the enhancement of peptide transport by apical leptin may involve increased translocation of the cytoplasmic pool of PepT1 to the apical membrane. The evidence for this is based on (a) increased apical to basolateral Gly-Sar transport and apical uptake; (b) increased Vmax of Gly-Sar transport by the apical membrane without change in Km; (c) an increase in the amount of PepT1 protein found in cell membranes and a decrease in intracellular PepT1 protein, without any change in PepT1 mRNA levels; and (d) suppression of leptin stimulation of peptide transport by alteration of intracellular trafficking of PepT1 with colchicine. Altogether, these results clearly exclude changes in the intrinsic activity of preexisting membrane PepT1 molecules, and indicate that the short-term effect of leptin on peptide transport involves an increase in membrane expression of PepT1. A similar mechanism was also reported for the insulin-induced increase in the uptake of dipeptides by Caco-2 cells (24), and for the action of the α2A adrenoceptor agonist clonidine, which induced a short-term increase of PepT1 activity in Caco-2-3B cells (22). The intracellular mechanism responsible for the leptin-induced redistribution of cytoplasmic PepT1 is currently unknown, and future studies are required to unravel this mechanism.
From a physiological point of view, our finding that gut leptin can facilitate protein absorption through PepT1 activation is consistent with data showing that dietary proteins may affect food intake, and with the aminostatic hypothesis of Mellinkoff et al. (61). The increase of protein absorption by leptin might constitute a previously unidentified mechanism through which leptin could reduce food intake. We suggest that during the assimilation of a meal, leptin secreted in the gut lumen may speed up the absorption of dietary proteins. This is consistent with the suggested role of leptin in reducing fat accumulation (60). Therefore, under physiological conditions, gastric leptin might balance the intestinal absorption of dietary proteins and fats, and deregulation of this function may contribute to obesity.
In summary, this study suggests a role for gastric leptin in the selective facilitation of peptide transport across the intestinal epithelium. Apical leptin (mimicking gastric leptin) rapidly increases intestinal absorption of oligopeptides through the H+-dependent, di- and tripeptide transporter PepT1. The mechanism of this short-term action probably involves increased recruitment of membrane PepT1 molecules from an intracellular preformed pool. Collectively, this report identifies a pathway through which leptin might regulate food intake and energy expenditure.
Acknowledgments
This work was supported by Institut National de la Santé et de la Recherche Médicale (INSERM) APEX99 grant 4X006E (to A. Bado) and by NIH grant DK-02831 (to D. Merlin). M. Buyse and S. Guilmeau are supported by le Ministère de l’Education et de la Recherche.
Footnotes
Françoise Berlioz’s present address is: Pfizer Group Research and Development, Fresnes, France.
Part of this work was presented during the American Gastroenterological Association’s Digestive Disease Week in San Diego, California, USA, on May 21–24, 2000.
References
- 1.Grimble GK. The significance of peptides in clinical nutrition. Annu Rev Nutr. 1994;14:419–447. doi: 10.1146/annurev.nu.14.070194.002223. [DOI] [PubMed] [Google Scholar]
- 2.Adibi SA. The oligopeptide transporter (Pept-1) in human intestine: biology and function. Gastroenterology. 1997;113:332–340. doi: 10.1016/s0016-5085(97)70112-4. [DOI] [PubMed] [Google Scholar]
- 3.Liang R, et al. Human intestinal H+/peptide cotransporter. Cloning, functional expression, and chromosomal localization. J Biol Chem. 1995;270:6456–6463. doi: 10.1074/jbc.270.12.6456. [DOI] [PubMed] [Google Scholar]
- 4.Boll M, et al. Expression cloning of a cDNA from rabbit small intestine related to proton-coupled transport of peptides, beta-lactam antibiotics and ACE-inhibitors. Pflugers Arch. 1994;429:146–149. doi: 10.1007/BF02584043. [DOI] [PubMed] [Google Scholar]
- 5.Fei YJ, et al. Expression cloning of a mammalian proton-coupled oligopeptide transporter. Nature. 1994;368:563–566. doi: 10.1038/368563a0. [DOI] [PubMed] [Google Scholar]
- 6.Chen H, Wong EA, Webb KE., Jr Tissue distribution of a peptide transporter mRNA in sheep, dairy cows, pigs, and chickens. J Anim Sci. 1999;77:1277–1283. doi: 10.2527/1999.7751277x. [DOI] [PubMed] [Google Scholar]
- 7.Thwaites DT, Brown CD, Hirst BH, Simmons NL. Transepithelial glycylsarcosine transport in intestinal Caco-2 cells mediated by expression of H+-coupled carriers at both apical and basal membranes. J Biol Chem. 1993;268:7640–7642. [PubMed] [Google Scholar]
- 8.Mackenzie B, et al. Mechanisms of the human intestinal H+-coupled oligopeptide transporter hPEPT1. J Biol Chem. 1996;271:5430–5437. doi: 10.1074/jbc.271.10.5430. [DOI] [PubMed] [Google Scholar]
- 9.Ogihara H, et al. Immuno-localization of H+/peptide cotransporter in rat digestive tract. Biochem Biophys Res Commun. 1996;220:848–852. doi: 10.1006/bbrc.1996.0493. [DOI] [PubMed] [Google Scholar]
- 10.Mackenzie B, Fei YJ, Ganapathy V, Leibach FH. The human intestinal H+/oligopeptide cotransporter hPEPT1 transports differently-charged dipeptides with identical electrogenic properties. . Biochim Biophys Acta. 1996; 1284:125–128. doi: 10.1016/s0005-2736(96)00170-8. [DOI] [PubMed] [Google Scholar]
- 11.Chen XZ, Steel A, Hediger MA. Functional roles of histidine and tyrosine residues in the H(+)-peptide transporter PepT1. Biochem Biophys Res Commun. 2000;272:726–730. doi: 10.1006/bbrc.2000.2851. [DOI] [PubMed] [Google Scholar]
- 12.Dantzig AH, Bergin L. Uptake of the cephalosporin, cephalexin, by a dipeptide transport carrier in the human intestinal cell line, Caco-2. . Biochim Biophys Acta. 1990; 1027:211–217. doi: 10.1016/0005-2736(90)90309-c. [DOI] [PubMed] [Google Scholar]
- 13.Walker D, Thwaites DT, Simmons NL, Gilbert HJ, Hirst BH. Substrate upregulation of the human small intestinal peptide transporter, hPepT1. J Physiol. 1998;507:697–706. doi: 10.1111/j.1469-7793.1998.697bs.x. [DOI] [PMC free article] [PubMed] [Google Scholar]
- 14.Merlin D, et al. Colonic epithelial hPepT1 expression occurs in inflammatory bowel disease: transport of bacterial peptides influences expression of MHC class 1 molecules. Gastroenterology. 2001;120:1666–1679. doi: 10.1053/gast.2001.24845. [DOI] [PubMed] [Google Scholar]
- 15.Erickson RH, Gum JR, Jr, Lindstrom MM, McKean D, Kim YS. Regional expression and dietary regulation of rat small intestinal peptide and amino acid transporter mRNAs. Biochem Biophys Res Commun. 1995;216:249–257. doi: 10.1006/bbrc.1995.2617. [DOI] [PubMed] [Google Scholar]
- 16.Ferraris RP, Diamond J, Kwan WW. Dietary regulation of intestinal transport of the dipeptide carnosine. Am J Physiol. 1988;255:G143–G150. doi: 10.1152/ajpgi.1988.255.2.G143. [DOI] [PubMed] [Google Scholar]
- 17.Shiraga T, et al. Cellular and molecular mechanisms of dietary regulation on rat intestinal H+/Peptide transporter PepT1. Gastroenterology. 1999;116:354–362. doi: 10.1016/s0016-5085(99)70132-0. [DOI] [PubMed] [Google Scholar]
- 18.Ihara T, Tsujikawa T, Fujiyama Y, Bamba T. Regulation of PepT1 peptide transporter expression in the rat small intestine under malnourished conditions. Digestion. 2000;61:59–67. doi: 10.1159/000007736. [DOI] [PubMed] [Google Scholar]
- 19.Ogihara H, Suzuki T, Nagamachi Y, Inui K, Takata K. Peptide transporter in the rat small intestine: ultrastructural localization and the effect of starvation and administration of amino acids. Histochem J. 1999;31:169–174. doi: 10.1023/a:1003515413550. [DOI] [PubMed] [Google Scholar]
- 20.Brandsch M, Miyamoto Y, Ganapathy V, Leibach FH. Expression and protein kinase C-dependent regulation of peptide/H+ co-transport system in the Caco-2 human colon carcinoma cell line. Biochem J. 1994;299:253–260. doi: 10.1042/bj2990253. [DOI] [PMC free article] [PubMed] [Google Scholar]
- 21.Muller U, et al. Inhibition of the H+/peptide cotransporter in the human intestinal cell line Caco-2 by cyclic AMP. Biochem Biophys Res Commun. 1996;218:461–465. doi: 10.1006/bbrc.1996.0082. [DOI] [PubMed] [Google Scholar]
- 22.Berlioz F, et al. alpha(2)-adrenergic receptors stimulate oligopeptide transport in a human intestinal cell line. J Pharmacol Exp Ther. 2000;294:466–472. [PubMed] [Google Scholar]
- 23.Berlioz F, et al. Neural modulation of cephalexin intestinal absorption through the di- and tripeptide brush border transporter of rat jejunum in vivo. J Pharmacol Exp Ther. 1999;288:1037–1044. [PubMed] [Google Scholar]
- 24.Thamotharan M, Bawani SZ, Zhou X, Adibi SA. Hormonal regulation of oligopeptide transporter pept-1 in a human intestinal cell line. Am J Physiol. 1999;276:C821–C826. doi: 10.1152/ajpcell.1999.276.4.C821. [DOI] [PubMed] [Google Scholar]
- 25.Ganapathy ME, Brandsch M, Prasad PD, Ganapathy V, Leibach FH. Differential recognition of beta-lactam antibiotics by intestinal and renal peptide transporters, PEPT 1 and PEPT 2. J Biol Chem. 1995;270:25672–25677. doi: 10.1074/jbc.270.43.25672. [DOI] [PubMed] [Google Scholar]
- 26.Tamai I, et al. The predominant contribution of oligopeptide transporter PepT1 to intestinal absorption of beta-lactam antibiotics in the rat small intestine. J Pharm Pharmacol. 1997;49:796–801. doi: 10.1111/j.2042-7158.1997.tb06115.x. [DOI] [PubMed] [Google Scholar]
- 27.Temple CS, et al. Peptide mimics as substrates for the intestinal peptide transporter. J Biol Chem. 1998;273:20–22. doi: 10.1074/jbc.273.1.20. [DOI] [PubMed] [Google Scholar]
- 28.Wenzel U, Thwaites DT, Daniel H. Stereoselective uptake of beta-lactam antibiotics by the intestinal peptide transporter. Br J Pharmacol. 1995;116:3021–3027. doi: 10.1111/j.1476-5381.1995.tb15958.x. [DOI] [PMC free article] [PubMed] [Google Scholar]
- 29.Zhang Y, et al. Positional cloning of the mouse obese gene and its human homologue. Nature. 1994;372:425–432. doi: 10.1038/372425a0. [DOI] [PubMed] [Google Scholar]
- 30.Tartaglia LA, et al. Identification and expression cloning of a leptin receptor, OB-R. Cell. 1995;83:1263–1271. doi: 10.1016/0092-8674(95)90151-5. [DOI] [PubMed] [Google Scholar]
- 31.Halaas JL, et al. Weight-reducing effects of the plasma protein encoded by the obese gene. Science. 1995;269:543–546. doi: 10.1126/science.7624777. [DOI] [PubMed] [Google Scholar]
- 32.Masuzaki H, et al. Nonadipose tissue production of leptin: leptin as a novel placenta-derived hormone in humans. Nat Med. 1997;3:1029–1033. doi: 10.1038/nm0997-1029. [DOI] [PubMed] [Google Scholar]
- 33.Bado A, et al. The stomach is a source of leptin. Nature. 1998;394:790–793. doi: 10.1038/29547. [DOI] [PubMed] [Google Scholar]
- 34.Sobhani I, et al. Leptin secretion and leptin receptor in the human stomach. Gut. 2000;47:178–183. doi: 10.1136/gut.47.2.178. [DOI] [PMC free article] [PubMed] [Google Scholar]
- 35.Voisin T, Rouyer-Fessard C, Laburthe M. Distribution of common peptide YY-neuropeptide Y receptor along rat intestinal villus-crypt axis. Am J Physiol. 1990;258:G753–G759. doi: 10.1152/ajpgi.1990.258.5.G753. [DOI] [PubMed] [Google Scholar]
- 36.Laburthe M, et al. Interaction of peptide YY with rat intestinal epithelial plasma membranes: binding of the radioiodinated peptide. Endocrinology. 1986;118:1910–1917. doi: 10.1210/endo-118-5-1910. [DOI] [PubMed] [Google Scholar]
- 37.Souli A, et al. Several receptors mediate the antisecretory effect of peptide YY, neuropeptide Y, and pancreatic polypeptide on VIP-induced fluid secretion in the rat jejunum in vivo. Peptides. 1997;18:551–557. doi: 10.1016/s0196-9781(97)00069-7. [DOI] [PubMed] [Google Scholar]
- 38.Thamotharan M, Bawani SZ, Zhou X, Adibi SA. Mechanism of dipeptide stimulation of its own transport in a human intestinal cell line. Proc Assoc Am Physicians. 1998;110:361–368. [PubMed] [Google Scholar]
- 39.Achler C, Filmer D, Merte C, Drenckhahn D. Role of microtubules in polarized delivery of apical membrane proteins to the brush border of the intestinal epithelium. J Cell Biol. 1989;109:179–189. doi: 10.1083/jcb.109.1.179. [DOI] [PMC free article] [PubMed] [Google Scholar]
- 40.Rindler MJ, Ivanov IE, Sabatini DD. Microtubule-acting drugs lead to the nonpolarized delivery of the influenza hemagglutinin to the cell surface of polarized Madin-Darby canine kidney cells. J Cell Biol. 1987;104:231–241. doi: 10.1083/jcb.104.2.231. [DOI] [PMC free article] [PubMed] [Google Scholar]
- 41.Adibi SA. Intestinal transport of dipeptides in man: relative importance of hydrolysis and intact absorption. J Clin Invest. 1971;50:2266–2275. doi: 10.1172/JCI106724. [DOI] [PMC free article] [PubMed] [Google Scholar]
- 42.Hellier MD, Holdsworth CD, McColl I, Perrett D. Dipeptide absorption in man. Gut. 1972;13:965–969. doi: 10.1136/gut.13.12.965. [DOI] [PMC free article] [PubMed] [Google Scholar]
- 43.Cook GC. Comparison of intestinal absorption rates of glycine and glycylglycine in man and the effect of glucose in the perfusing fluid. Clin Sci. 1972;43:443–453. doi: 10.1042/cs0430443. [DOI] [PubMed] [Google Scholar]
- 44.Bolger MB, et al. Structure, function, and molecular modeling approaches to the study of the intestinal dipeptide transporter PepT1. J Pharm Sci. 1998;87:1286–1291. doi: 10.1021/js980090u. [DOI] [PubMed] [Google Scholar]
- 45.Thamotharan M, Bawani SZ, Zhou X, Adibi SA. Functional and molecular expression of intestinal oligopeptide transporter (Pept-1) after a brief fast. Metabolism. 1999;48:681–684. doi: 10.1016/s0026-0495(99)90164-6. [DOI] [PubMed] [Google Scholar]
- 46.Hidalgo IJ, Raub TJ, Borchardt RT. Characterization of the human colon carcinoma cell line (Caco-2) as a model system for intestinal epithelial permeability. Gastroenterology. 1989;96:736–749. [PubMed] [Google Scholar]
- 47.Zweibaum, A., Laburthe, M., Grasset, E., and Louvard, D. 1991. Use of cell lines in studies of intestinal cell differentiation and function. In Handbook of physiology, the gastrointestinal system: intestinal absorption and secretion. M.Field and R.A. Frizzel, editors. Oxford University Press. New York, New York, USA. 223–255.
- 48.Harcouet L, Lebrec D, Roze C, Carbon C, Farinotti R. Increased intestinal absorption of cefixime by nifedipine in the rat intestinal perfusion model: evidence for a neural regulation. J Pharmacol Exp Ther. 1997;281:738–745. [PubMed] [Google Scholar]
- 49.MacDonald RS, Thornton WH, Jr, Bean TL. Insulin and IGF-1 receptors in a human intestinal adenocarcinoma cell line (Caco-2): regulation of Na+ glucose transport across the brush border. J Recept Res. 1993;13:1093–1113. doi: 10.3109/10799899309063266. [DOI] [PubMed] [Google Scholar]
- 50.Wang MY, Koyama K, Shimabukuro M, Newgard CB, Unger RH. OB-Rb gene transfer to leptin-resistant islets reverses diabetogenic phenotype. Proc Natl Acad Sci USA. 1998;95:714–718. doi: 10.1073/pnas.95.2.714. [DOI] [PMC free article] [PubMed] [Google Scholar]
- 51.Tartaglia LA, et al. Identification and expression cloning of a leptin receptor, OB-R. Cell. 1995;83:1263–1271. doi: 10.1016/0092-8674(95)90151-5. [DOI] [PubMed] [Google Scholar]
- 52.Lee GH, et al. Abnormal splicing of the leptin receptor in diabetic mice. Nature. 1996;379:632–635. doi: 10.1038/379632a0. [DOI] [PubMed] [Google Scholar]
- 53.Kuwada SK, et al. Differential signaling and regulation of apical vs. basolateral EGFR in polarized epithelial cells. Am J Physiol. 1998;275:C1419–C1428. doi: 10.1152/ajpcell.1998.275.6.C1419. [DOI] [PubMed] [Google Scholar]
- 54.Strohmeier GR, Reppert SM, Lencer WI, Madara JL. The A2b adenosine receptor mediates cAMP responses to adenosine receptor agonists in human intestinal epithelia. J Biol Chem. 1995;270:2387–2394. doi: 10.1074/jbc.270.5.2387. [DOI] [PubMed] [Google Scholar]
- 55.Barrett KE, Huott PA, Shah SS, Dharmsathaphorn K, Wasserman SI. Differing effects of apical and basolateral adenosine on colonic epithelial cell line T84. Am J Physiol. 1989;256:C197–C203. doi: 10.1152/ajpcell.1989.256.1.C197. [DOI] [PubMed] [Google Scholar]
- 56.Dwinell MB, Eckmann L, Leopard JD, Varki NM, Kagnoff MF. Chemokine receptor expression by human intestinal epithelial cells. Gastroenterology. 1999;117:359–367. doi: 10.1053/gast.1999.0029900359. [DOI] [PubMed] [Google Scholar]
- 57.Sunitha I, et al. A src-related kinase in the brush border membranes of gastrointestinal cells is regulated by c-met. Exp Cell Res. 1999;250:86–98. doi: 10.1006/excr.1999.4550. [DOI] [PubMed] [Google Scholar]
- 58.Vaisse C, et al. Leptin activation of Stat3 in the hypothalamus of wild-type and ob/ob mice but not db/db mice. Nat Genet. 1996;14:95–97. doi: 10.1038/ng0996-95. [DOI] [PubMed] [Google Scholar]
- 59.Bjorbaek C, Uotani S, da Silva B, Flier JS. Divergent signaling capacities of the long and short isoforms of the leptin receptor. J Biol Chem. 1997;272:32686–32695. doi: 10.1074/jbc.272.51.32686. [DOI] [PubMed] [Google Scholar]
- 60.Morton NM, Emilsson V, Liu YL, Cawthorne MA. Leptin action in intestinal cells. J Biol Chem. 1998;273:26194–26201. doi: 10.1074/jbc.273.40.26194. [DOI] [PubMed] [Google Scholar]
- 61.Mellinkoff SM, Frankland M, Boyle D, Greipel M. Relationship between serum amino acid concentration and fluctuations in appetite. 1956. Obes Res. 1997;5:381–384. doi: 10.1002/j.1550-8528.1997.tb00568.x. [DOI] [PubMed] [Google Scholar]


