Abstract
Background
Despite the high prevalence of obesity and diabetes in the Canadian Aboriginal population, it is unknown whether the current thresholds for body mass index and waist circumference derived from white populations are appropriate for Aboriginal people. We compared the risk of cardiovascular disease among Canadian Aboriginal and European populations using the current thresholds for body mass index and waist circumference.
Methods
Healthy Aboriginal (n = 195) and European (n = 201) participants (matched for sex and body mass index range) were assessed for demographic characteristics, lifestyle factors, total and central adiposity and risk factors for cardiovascular disease. Among Aboriginal and European participants, we compared the relation between body mass index and each of the following 3 factors: percent body fat, central adiposity and cardiovascular disease risk factors. We also compared the relation between waist circumference and the same 3 factors.
Results
The use of body mass index underestimated percent body fat by 1.3% among Aboriginal participants compared with European participants (p = 0.025). The use of waist circumference overestimated abdominal adipose tissue by 26.7 cm2 among Aboriginal participants compared with European participants (p = 0.007). However, there was no difference in how waist circumference estimated subcutaneous abdominal and visceral adipose tissue among the 2 groups. At the same body mass index and waist circumference, we observed no differences in the majority of cardiovascular disease risk factors among Aboriginal and European participants. The prevalence of dyslipidemia, hypertension, impaired fasting glucose and metabolic syndrome was similar among participants in the 2 groups after adjustment for body mass index, waist circumference, age and sex.
Interpretation
We found no difference in the relation between body mass index and risk of cardiovascular disease between men and women of Aboriginal and European descent. We also found no difference between waist circumference and cardiovascular disease risk among these groups. These data support the use of current anthropometric thresholds in the Canadian Aboriginal population.
The Canadian Aboriginal population has undergone a rapid social and environmental transition over the past several decades, which has led to a marked increase in the prevalence of obesity. In the general Canadian population, the prevalence of obesity (body mass index ≥ 30 kg/m2) is 23%;1 however, the prevalence in the Aboriginal population is double that amount.2–4 The increased prevalence of obesity among Aboriginal people is important because obesity is an independent risk factor for a number of chronic illnesses.5,6 Indeed, many of these illnesses are already more common in the Aboriginal population than in other Canadian populations.3,7
Obesity, which is defined as an excess of body fat, is assessed by use of body mass index and waist circumference as indirect measures of total and central adiposity.8 Current thresholds for body mass index and waist circumference are based on data predominantly from white people of European descent.9,10 However, these thresholds may not be suitable for all populations. Specific thresholds have been suggested for Asian people,11 because those of Asian descent generally have more risk factors and a greater amount of body fat and visceral adipose tissue than Caucasians of the same body mass index and waist circumference.12–17 Specific thresholds may also be required for Canadian Aboriginal people because their ancestors are believed to have come from Asia more than 10 000 years ago.
It is unknown whether the current thresholds for body mass index and waist circumference are relevant for Canadian Aboriginal people with respect to body fat distribution and cardiovascular disease risk factors. Thus, we investigated the relation between body mass index and total and central adiposity among people of Aboriginal and European descent. We also investigated the relation between waist circumference and total and central adiposity in these 2 groups. In addition, we examined the prevalence of risk factors among Aboriginal and European people using the current thresholds for body mass index and waist circumference.
Methods
Study participants
We included participants who were involved in the Multi-cultural Community Health Assessment Trial (M-CHAT).18 Healthy men and women (aged 30–65 years) of either Aboriginal (both those who lived on reserves and those who did not) or European (continental Europe, Ireland and the United Kingdom) descent living in the Vancouver area were screened for eligibility. Participants were recruited by a number of methods, including local media advertisements, community events and notices placed at community centres and Aboriginal organizations. This recruitment strategy was developed in consultation with a community advisory committee that included members of the local Aboriginal communities. The M-CHAT trial included people of European descent who had lived in Canada for more than 3 years and who had grandparents of European descent who were born outside of Canada. The trial included Aboriginal people who had at least 3 Aboriginal grandparents. People were excluded if they had undergone recent weight change (loss or gain of more than 2.2 kg in the 3-month period before recruitment), had substantial prosthetics or amputation, reported a previous diagnosis of cardiovascular disease or major comorbidity (e.g., HIV, immunocompromised conditions), or if they were taking medications for cardiovascular disease risk factors (e.g., lipid-lowering drugs, antihypertensives or hypoglycemic medications). The latter criterion was required to determine the relation between current anthropometric thresholds and risk factors without the influence of exogenous agents.
We recruited men and women of Aboriginal and European origin matched for the following body mass index ranges: 18.5–24.9, 25–29.9 and ≥ 30 kg/m2. Because we had difficulty recruiting Aboriginal men with a body mass index less than 25 kg/m2, we included Aboriginal men of any body mass index.
All participants gave informed consent, and the study was approved by the research ethics board at Simon Fraser University.
Outcome measures
For each participant, we assessed sociodemographic status, family history of cardiovascular disease and type 2 diabetes mellitus (parents or siblings who received a diagnosis at any age), height, weight and waist circumference, lifestyle factors, total and central adiposity and risk factors for cardiovascular disease. Smoking status was self- reported. In order to determine macronutrient consumption, a registered dietitian analyzed a 3-day food record for each participant, by use of the Food Processor SQL software (ESHA Research). Foods that were specific to the ethnic backgrounds of the participants were added to the Food Processor SQL database from local recipes taking into account preparation methods and local ingredients. We classified leisure-time physical activity as the average number of minutes of activity per week in the year prior to recruitment.19 Body mass index was calculated as weight in kilograms divided by height in metres squared. Waist circumference was measured at the maximal narrowing of the waist after a normal expiration. Hip circumference was measured over the participants undergarments at the point of maximal gluteal protuberance from the lateral view. The breadth of the humerus, which we used as a proxy for frame size, was measured at the elbow.
Fasting blood samples were collected and immediately tested for total cholesterol, high-density lipoprotein (HDL) cholesterol, triglycerides, apolipoprotein B, lipoprotein (a), glucose, insulin and C-reactive protein. All tests were performed at the same clinical laboratory using standard enzymatic procedures. We calculated low-density lipoprotein (LDL) cholesterol by using the Friedewald equation.20 Blood pressure was measured by use of an automated oscillometric office blood pressure monitor and was recorded as the average of 5 successive measurements after 10 minutes of seated rest. We defined dyslipidemia as either an LDL cholesterol level of 3.5 mmol/L or greater or a total cholesterol:HDL cholesterol ratio of 5.0 or more.21 Hypertension was defined as a blood pressure of 140/90 mm Hg or higher,22 and impaired fasting glucose was defined as a glucose level of 6.0 mmol/L or greater.23 We used the National Cholesterol Education Program definition of a metabolic syndrome.24
Body composition assessment
We used percentage of total body fat as an indicator of total adiposity. We assessed each participant's percent total body fat by use of a dual energy x-ray absorptiometry with a Norland XR-36 scanner (Norland Medical Systems). Central adiposity was determined by CT scanning to measure the area of total, subcutaneous and visceral adipose tissue at the L4/L5 intervertebral disc, which is a valid measure of intra-abdominal fat volume.25 A cross-sectional slice was obtained, and the attenuation range of –190 to –30 Hounsfield units was used to identify adipose tissue. We computed surface area from the CT scans using sliceOmatic 4.2 medical imaging software (TomoVision).26 Total abdominal adipose tissue was calculated as all pixels within the attenuation range, and visceral adipose tissue was defined as adipose tissue within the inside edge of the abdominal wall. We calculated subcutaneous abdominal adipose tissue as the difference between total abdominal adipose tissue and visceral adipose tissue.
Statistical analysis
We reported normally distributed continuous variables as mean and standard deviation (SD), and we reported categorical variables as counts and percentages. Variables that were not normally distributed were log-transformed before analyses and are presented as medians and 25th and 75th percentile values. We used t tests to identify differences between ethnic groups within each sex for continuous variables, and we used χ2 tests for categorical variables. We analyzed bivariate correlations using Pearson's correlation coefficients.
We calculated age-and sex-adjusted values for percent body fat and visceral adipose tissue at the current thresholds for body mass index and waist circumference respectively. Multiple linear regression was used to assess the relation between body mass index and percent body fat, and between waist circumference and central adiposity (total, subcutaneous and visceral adipose tissue). We adjusted the models for the following covariates: age, sex, household income, maximum education level, humerus breadth, smoking status and amount of weekly physical activity. Dietary fat and other macronutrients were not significant contributors in any of the regression models. In all models, we tested for interaction between ethnic background and each of the following variables: body mass index, waist circumference, smoking and sex. None of these interactions were significant (data not shown). We used multiple linear regression to investigate differences in the relation of body mass index and waist circumference with cardiovascular disease risk factors between ethnic groups after adjustment for age, sex and smoking status. The χ2 test was used to test for differences in the prevalence of dyslipidemia, hypertension, impaired fasting glucose and metabolic syndrome at the current thresholds for body mass index and waist circumference. We adjusted for age and sex by logistic regression. Blood test results were missing for 12 participants; these participants were not included in the risk-factor analyses. We used residual plots to assess model adequacy. The significance level was set at 0.05, and all tests were 2-sided.
Results
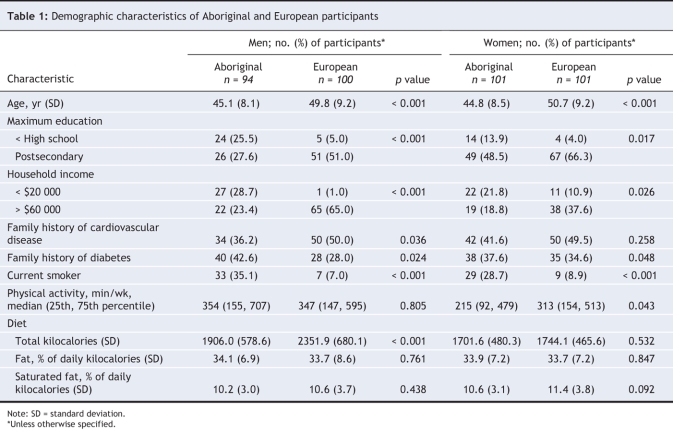
We recruited a total of 195 Aboriginal (81% of who lived off-reserve) and 201 European participants (Table 1). Of the European participants, 43% were born outside of Canada and 32% had English as a second language. Aboriginal participants were younger and had lower household incomes and education levels compared with European participants. In addition, Aboriginal participants had a greater prevalence of family history of diabetes and were more likely to smoke compared with European participants. European men reported a greater prevalence of family history of cardiovascular disease and a greater intake of dietary calories compared with Aboriginal men. European women were more likely than Aboriginal women to be postmenopausal (36% v. 22%, p = 0.031). European women were also more active than Aboriginal women.
Table 1
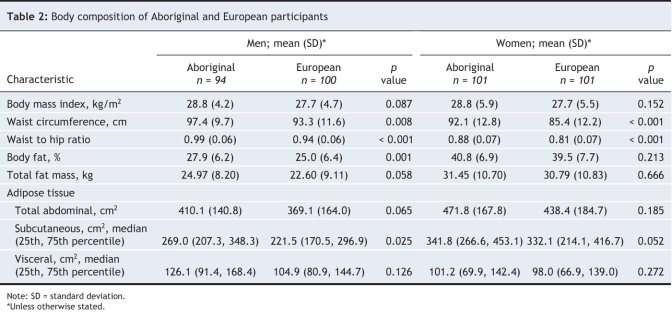
Aboriginal men and women had a larger waist circumference and waist-to-hip ratio compared to their European counterparts, but there was no difference in body mass index between the 2 groups (Table 2). Aboriginal men also had a higher percent body fat and subcutaneous abdominal adipose tissue than European men. Body mass index and waist circumference were highly correlated with measures of total and central adiposity for men and women of both ethnic groups (data not shown). Percent body fat was underestimated for Aboriginal men and women (Figure 1), and there was no difference in visceral adipose tissue between the 2 groups (Figure 2). After adjusting for covariates, Ab original participants had an absolute greater percent body fat of 1.3% (95% CI 0.2% to 2.4%, p = 0.025) at any given body mass index. For a given waist circumference, Aboriginal participants had 26.7 cm2 less total abdominal adipose tissue than Europeans (95% CI –46.1 to –7.3 cm2, p < 0.007), after adjustment for covariates. There were no differences (expressed in relative terms) in the amount of subcutaneous abdominal adipose tissue (–0.5%, 95% CI –6.5 to 7.9%, p = 0.900) or visceral adipose tissue (–4.2%, 95% CI –10.9 to 2.9%, p = 0.242) regardless of waist circumference.
Table 2
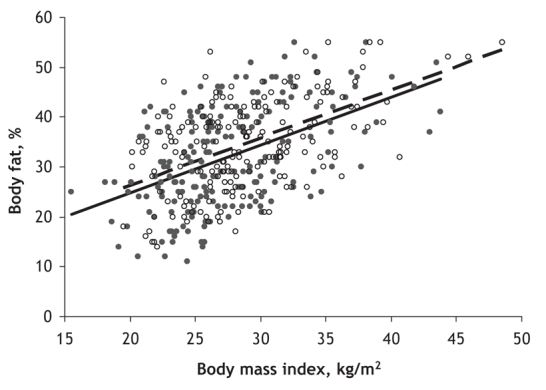
Figure 1: The relation between percent body fat and body mass index for Aboriginal (open circles, dashed line) and European (solid circles, solid line) participants.
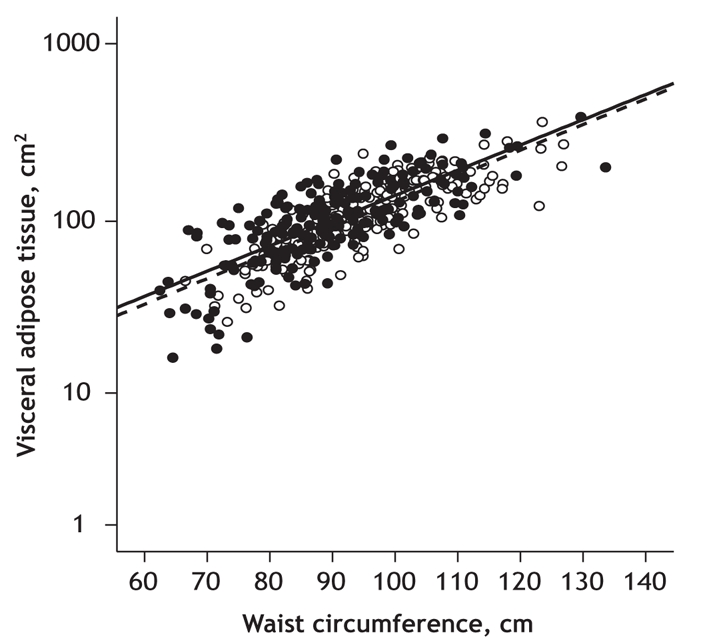
Figure 2: The relation between visceral adipose tissue and waist circumference for Aboriginal (open circles, dashed line) and European (solid circles, solid line) participants.
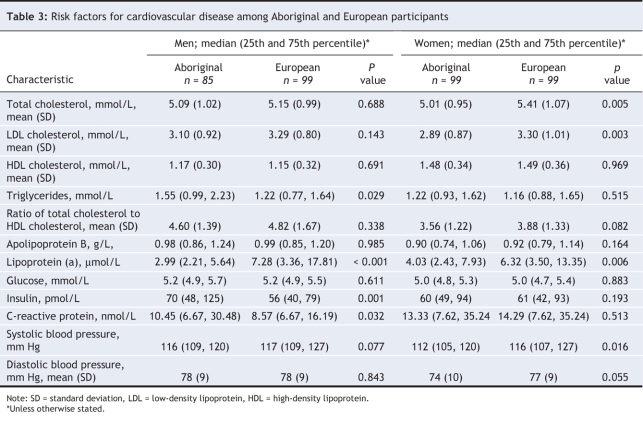
For cardiovascular disease risk factors, lipoprotein (a) was lower among Aboriginal men and women compared with European men and women (Table 3). Aboriginal women had lower total cholesterol, LDL cholesterol and systolic blood pressure compared with European women. Aboriginal men had higher triglycerides, insulin and C-reactive protein compared with European men. Body mass index and waist circumference were strongly correlated with the majority of risk factors among men and women from both groups, except for lipoprotein (a) (data not shown).
Table 3
For Aboriginal and European participants at the same body mass index or waist circumference, total cholesterol, triglycerides, apolipoprotein B, glucose, C-reactive protein and diastolic blood pressure were not different (p > 0.05 for all, age and sex adjusted). However, Aboriginal participants had a lower ratio of total cholesterol to HDL cholesterol and lower systolic blood pressure at any body mass index (–0.39 and –3 mm Hg respectively) and at any waist circumference (by 0.51 and 4 mm Hg respectively) (p < 0.05 for all, age and sex adjusted). Aboriginal participants had higher insulin levels for any body mass index by 12% and higher HDL cholesterol at any waist circumference by 0.08 mmol/L (p < 0.05 for all, age and sex adjusted).
To compare the prevalence of dyslipidemia, hypertension, impaired fasting glucose and metabolic syndrome, the Aboriginal and European cohorts were grouped based on the current thresholds for body mass index (< 25 kg/m2, ≥ 25 kg/m2 and ≥ 30 kg/m2) and waist circumference (men: < 94 cm, ≥ 94 cm and ≥ 102 cm, women: < 80 cm, ≥ 80 cm and ≥ 88 cm). There was no difference in the prevalence of dyslipidemia for any body mass index category for men and women. There was no difference in the prevalence of dyslipidemia for all waist circumference categories of men. European women had a greater prevalence of dyslipidemia at the upper 2 waist circumference categories (p = 0.028, p = 0.017). The prevalence of hypertension among the 2 groups was not different for any body mass index or waist circumference categories, except for body mass index of 30 kg/m2 or greater. At this body mass index, the prevalence of hypertension was greater among European participants compared with Aboriginal participants (p = 0.032). There was no difference in the prevalence of impaired fasting glucose at any body mass index or waist circumference category between the 2 groups. European women had a greater prevalence of metabolic syndrome at a waist circumference of 88 cm or greater (p = 0.006), otherwise there was no difference in metabolic syndrome prevalence between the groups for all body mass index categories (men and women) and waist circumference categories (men only). When we adjusted the data for age and sex, there was no difference in the prevalence of dyslipidemia, hypertension, impaired fasting glucose or metabolic syndrome between the Aboriginal and European participants at any body mass index or waist circumference.
Interpretation
Overall, our data suggest that the relation between anthropometric measures (body mass index and waist circumference) and adiposity and cardiovascular disease risk factors is not different among Aboriginal and European populations. Even though body mass index underestimated percent body fat in the Aboriginal group by 1.3%, this modest difference is not clinically relevant. There were no differences in subcutaneous and visceral adipose tissue areas and values for most cardiovascular disease risk factors between the Aboriginal and European participants at the same body mass index and waist circumference. However, Aboriginal participants had significantly less total abdominal adipose tissue at a given waist circumference than European participants. This is consistent with Aboriginal people having a lower, yet nonsignificant, amount of visceral adipose tissue compared with European people at a given waist circumference. Although there is no consensus on a clinical threshold of total abdominal adipose tissue or visceral adipose tissue, lower amounts are associated with a lower risk for cardiovascular disease.27 Indeed, at a given body mass index and waist circumference, Aboriginal participants had higher HDL cholesterol levels and lower ratios of total/HDL cholesterol and systolic blood pressure compared with European participants. Of all the risk factors we studied, only insulin was higher at a given body mass index among Aboriginal participants. This difference may reflect a lower insulin sensitivity and a greater susceptibility for diabetes in the Aboriginal population.7 There were no differences in the prevalence of dyslipidemia, hypertension, impaired fasting glucose and metabolic syndrome for any body mass index and waist circumference after adjustment for age and sex.
Given the distant Asian roots and the rapid increase in obesity in Aboriginal populations, these findings were unexpected and are in contrast with reports indicating that, compared with European people, Asian people have a greater percent body fat and visceral adipose tissue at a given body mass index and waist circumference respectively.12,15,17 Although no similar studies have been performed that include Aboriginal people, Gautier and colleauges found no difference in the relation between body mass index and visceral adipose tissue in a study that included 20 Pima Indians and 20 European people.28 Razak and colleagues later reported that Aboriginal men and women had modestly higher glucose and hemoglobin A1c but similar total cholesterol:HDL cholesterol ratios and blood pressure to Europeans at any body mass index.16 Inuit people living in Canada have been reported to have lower levels of cardiovascular disease risk factors at a given range of body mass index or waist circumference compared with a representative population in Manitoba.29 However, these studies did not analyze risk factor prevalence or perform comprehensive investigations of body fat distribution. In addition, these studies included people who were being treated for risk factors, which may have substantially altered the relation of risk factors and body mass index or waist circumference.
Our study has several limitations. The purpose of our study was to explore possible physiologic differences between Aboriginal and European populations with respect to current anthropometric thresholds; thus, we required Aboriginal participants to have had at least 3 grandparents of Aboriginal descent, and European participants to have had all 4 grandparents of European descent. Indeed, this strategy excluded a number of participants who identified themselves as Aboriginal but who did not have exclusive ancestry. Previous studies included these individuals and recruited participants either from a single Aboriginal band or residing on a single reserve.3,4,28,30 Owing to the geographic and cultural distinctness of Aboriginal populations across Canada, we recognize that this Aboriginal cohort may not be representative of all Aboriginal people across Canada. However, our Aboriginal cohort included people with diverse origins. We also included people who are rarely included in such studies, namely Aboriginal people who live in off-reserve, urban areas. This is important because the population of urban Aboriginal people is not only increasing but is outpacing the growth of other populations in some parts of Canada.31 We also purposely recruited a cohort of people who were free of overt diseases and who were not receiving treatment for risk factors because the value in assessing body mass index and waist circumference is to identify those at risk for cardiovascular disease. Although our study focused on cardiovascular disease risk, obesity is a risk factor for a number of noncardiac diseases (e.g., cancer, arthritis and sleep apnea) for which these thresholds may not apply. We cannot exclude a possible healthy volunteer bias; however, it is unlikely that this bias had an effect on the comparison of anthropometric measures and cardiovascular disease risk between the 2 groups. In addition, our cohort had comparable risk factors to those reported in other studies of Canadian people of Aboriginal and European descent.3
In our cohort of urban-dwelling Aboriginal people, we did not find evidence of a difference among Aboriginal and European participants in the ability of current thresholds for body mass index and waist circumference to identify those at increased cardiovascular disease. This information is especially important because of the urbanization and increasing prevalence of obesity and related chronic illnesses in Aboriginal populations. Because this is a cross-sectional study, we cannot comment on the appropriateness of these thresholds to predict future risk for cardiovascular disease; however, the sum of evidence suggests that body fat accumulation precedes the presence of cardiovascular disease risk factors and the development of cardiovascular disease. These results do not support the need for specific anthropometric thresholds for Aboriginal people. Current thresholds should continue to be used as part of regular medical examinations for Aboriginal people in Canada.
Acknowledgments
Scott Lear and Karin Humphries are Michael Smith Foundation for Health Research Scholars.
Footnotes
Une version française de ce résumé est disponible à l'adresse www.cmaj.ca/cgi/content/full/177/12/1499/DC1
This article has been peer reviewed.
Contributors: All of the authors were involved in the conception of the research, interpretation of the data and writing of the paper. All of the authors gave approval of the final version submitted for publication.
This research was funded by the Institute of Nutrition, Metabolism and Diabetes, Canadian Institutes of Health Research.
Competing interests: None declared.
Correspondence to: Dr. Scott A. Lear, Simon Fraser University, School of Kinesiology, 515 West Hastings St., Vancouver BC V6B 5K3; fax 604 806-8590; slear@providencehealth.bc.ca
REFERENCES
- 1.Tjepkema M, Shields M. Measured obesity: adult obesity in Canada. Ottawa: Statistics Canada; 2005.
- 2.Vanasse A, Demers M, Hemiari A, et al. Obesity in Canada: Where and how many? Int J Obes (Lond) 2006;30:677-83. [DOI] [PubMed]
- 3.Anand SS, Yusuf S, Jacobs R, et al. Risk factors, atherosclerosis and cardiovascular disease among Aboriginal people in Canada: the Study of Health Assessment and Risk Evaluation in Aboriginal Peoples (SHARE-AP). Lancet 2001;358:1147-53. [DOI] [PubMed]
- 4.Katzmarzyk PT, Malina RM. Obesity and relative subcutaneous fat distribution among Canadians of First Nation and European ancestry. Int J Obes Relat Metab Disord 1998;22:1127-31. [DOI] [PubMed]
- 5.Yusuf S, Hawken S, Ounpuu S, et al. Obesity and the risk of myocardial infarction in 27 000 participants from 52 countries: a case-control study. Lancet 2005;366:1640-9. [DOI] [PubMed]
- 6.Calle EE, Rodriguez C, Walker-Thurmond K, et al. Overweight, obesity, and mortality from cancer in a prospectively studied cohort of US adults. N Engl J Med 2003;348:1625-38. [DOI] [PubMed]
- 7.Young TK, Reading J, Elias B, et al. Type 2 diabetes mellitus in Canada's first nations: status of an epidemic in progress. CMAJ 2000;163:561-6. [PMC free article] [PubMed]
- 8.Douketis JD, Paradis G, Keller H, et al. Canadian guidelines for body weight classification in adults: application in clinical practice to screen for overweight and obesity and to assess disease risk. CMAJ 2005;172:995-8. [DOI] [PMC free article] [PubMed]
- 9.Keil U, Kuulasmaa K. WHO MONICA Project: risk factors. Int J Epidemiol 1989;18:S46-55. [PubMed]
- 10.Lean ME, Han TS, Seidell JC. Impairment of health and quality of life in people with large waist circumference. Lancet 1998;351:853-6. [DOI] [PubMed]
- 11. World Health Organization. The Asia-Pacific perspective: redefining obesity and its treatment. Geneva: The Organization; 2000.
- 12.Lear SA, Humphries KH, Kohli S, et al. The use of body mass index and waist circumference as surrogates of body fat differs by ethnicity. Obesity. In press. [DOI] [PubMed]
- 13.Lear SA, Toma M, Birmingham CL, et al. Modification of the relationship between simple anthropometric indices and risk factors by ethnic background. Metabolism 2003;52:1295-301. [DOI] [PubMed]
- 14.Lear SA, Chen MM, Frohlich JJ, et al. The relationship between waist circumference and metabolic risk factors: Cohorts of European and Chinese descent. Metabolism 2002;51:1427-32. [DOI] [PubMed]
- 15.Lear SA, Humphries KH, Kohli S, et al. Visceral adipose tissue accumulation differs according to ethnic background: results of the Multi-cultural Community Health Assessment Trial (M-CHAT). Am J Clin Nutr 2007;86:353-9. [DOI] [PubMed]
- 16.Razak F, Anand S, Vuksan V, et al. Ethnic differences in the relationships between obesity and glucose-metabolic abnormalities: a cross-sectional population-based study. Int J Obes (Lond) 2005;29:656-67. [DOI] [PubMed]
- 17.Deurenberg-Yap M, Schmidt G, van Staveren WA, et al. The paradox of low body mass index and high body fat percentage among Chinese, Malays and Indians in Singapore. Int J Obes Relat Metab Disord 2000;24:1011-7. [DOI] [PubMed]
- 18.Lear SA, Birmingham CL, Chockalingam A, et al. Study design of the Multicultural Community Health Assessment Trial (M-CHAT): a comparison of body fat distribution in four distinct populations. Ethn Dis 2006;16:96-100. [PubMed]
- 19.Pereira MA, Kriska AM, Joswiak ML, et al. Physical inactivity and glucose intolerance in the multiethnic island of Mauritius. Med Sci Sports Exerc 1995;27:1626-34. [PubMed]
- 20.Friedewald WT, Levy RI, Fredrickson DS. Estimation of the concentration of low-density lipoprotein cholesterol in plasma, without use of the preparative ultracentrifuge. Clin Chem 1972;18:499-502. [PubMed]
- 21.Genest J, Frohlich J, Fodor G, et al. Recommendations for the management of dyslipidemia and the prevention of cardiovascular disease: summary of the 2003 update. CMAJ 2003;169:921-4. [PMC free article] [PubMed]
- 22.Hemmelgarn BR, McAlister FA, Grover S, et al. The 2006 Canadian Hypertension Education Program recommendations for the management of hypertension: part I–Blood pressure measurement, diagnosis and assessment of risk. Can J Cardiol 2006;22:573-81. [DOI] [PMC free article] [PubMed]
- 23.Canadian Diabetes Association Clinical Practice Guidelines Expert Committee. Canadian Diabetes Association 2003 clinical practice guidelines for the prevention and management of diabetes in Canada. Can J Diabetes 2003;27:s1-152. [DOI] [PubMed]
- 24.Expert Panel on Detection, Evaluation and Treatment of High Blood Cholesterol in Adults. Executive summary of the third report of the National Cholesterol Education Program (NCEP) expert panel on detection, evaluation and treatment of high blood cholesterol in adults (Adult Treatment Panel III). JAMA 2001;285:2486-97. [DOI] [PubMed]
- 25.Shen W, Punyanitya M, Wang Z, et al. Visceral adipose tissue: relations between single-slice areas and total volume. Am J Clin Nutr 2004;80:271-8. [DOI] [PMC free article] [PubMed]
- 26.Irving BA, Weltman JY, Brock DW, et al. NIH ImageJ and Slice-O-Matic computed tomography imaging software to quantify soft tissue. Obesity 2007;15:370-6. [DOI] [PubMed]
- 27.Pouliot MC, Despres JP, Lemieux S, et al. Waist circumference and abdominal sagittal diameter: best simple anthropometric indexes of abdominal visceral adipose tissue accumulation and related cardiovascular risk in men and women. Am J Cardiol 1994;73:460-8. [DOI] [PubMed]
- 28.Gautier JF, Milner MR, Elam E, et al. Visceral adipose tissue is not increased in Pima Indians compared with equally obese Caucasians and is not related to insulin action or secretion. Diabetologia 1999;42:28-34. [DOI] [PubMed]
- 29.Young TK. Obesity, central fat patterning, and their metabolic correlates among the inuit of the central Canadian Arctic. Hum Biol 1996;68:245-63. [PubMed]
- 30.Daniel M, Marion SA, Sheps SB, et al. Variation by body mass index and age in waist-to-hip ratio associations with glycemic status in an aboriginal population at risk for type 2 diabetes in British Columbia, Canada. Am J Clin Nutr 1999;69:455-60. [DOI] [PubMed]
- 31.Michalowski M, Loh S. Projections of the Aboriginal populations, Canada, provinces and territories. Ottawa: Statistics Canada; 2005.


