

Abstract
The molecular origins of second-order nonlinear effects in type I collagen fibrils have been identified with sum-frequency generation vibrational spectroscopy. The dominant contributing molecular groups are: 1), the methylene groups associated with a Fermi resonance between the fundamental symmetric stretch and the bending overtone of methylene; and 2), the carbonyl and peptide groups associated with the amide I band. The noncentrosymmetrically aligned methylene groups are characterized by a distinctive tilt relative to the axis perpendicular to the main axis of the collagen fiber, a conformation producing a strong achiral contribution to the second-order nonlinear effect. In contrast, the stretching vibration of the carbonyl groups associated with the amide I band results in a strong chiral contribution to the optical second-order nonlinear effect. The length scale of these chiral effects ranges from the molecular to the supramolecular.
INTRODUCTION
The collagens are a superfamily of extracellular matrix proteins that play a crucial role throughout the lifespan of all metazoan lifeforms, from early growth and development through maintenance of homeostasis. All collagens are composed of three polypeptide chains, called α-chains, that fold together to form the characteristic triple helix. Each α-chain is coiled into a left-handed helix that winds around a common axis to form a right-handed triple helix (Fig. 1). The collagen molecule may be either a homotrimer (three identical α-chains) or a heterotrimer (a mixture of two or three genetically distinct chains). More than 27 collagen types and 42 distinct α-chains have been identified in vertebrates, as well as 15 additional proteins with collagenlike domains (1). All members of the collagen superfamily share certain characteristics, necessitated by the coiled-coil structure of the triple helix. Glycine, the smallest amino acid, must occupy every third position to allow packing of the coiled-coil structure. Hydroxyproline frequently occupies the third position in the Gly-X-Y triplet, providing stability to the helix, while proline is often in the X position (2–6). Each twist is approximately three-amino-acids in length. These tight twists do not result in steric hindrance due to the location of glycine, the smallest amino acid, at the center of the superhelix, a conformation that allows the bulky side chains of amino acids at the X and Y positions to point outward. The three α-chains are connected by hydrogen bonds between the NH of the glycine and the CO of the proline in the X position of a neighboring α-chain. The pyrrolidine rings of proline and hydroxyproline impose additional steric restrictions, causing each α-chain to fold into a left-handed helix while simultaneously twisting together along a common axis to form a right-handed superhelix. At the supramolecular level, collagen molecules are organized into complex assemblies of fibrils or networks related to their tissue functions; structural features of these assemblies, in conjunction with other posttranslational modifications, serve as the basis for grouping the different collagen types into nine “families” (1). The fibril-forming collagens represent the most abundant group, consisting of collagen types I, II, III, V, XI, XXIV, and XXVII. In this article, we focus on type I collagen, the predominant member of this group.
FIGURE 1.

The triple helical structure for a collagen molecule. The amino-acid sequence of a single α-chain is Gly-X-Y, where the smallest amino-acid glycine (Gly) and X and Y are frequently proline (Pro) and hydroxyproline (Hyp), respectively. The sequence shown is (Gly-Pro-Hyp)3. The small Gly amino acid is always in the center of the superhelix and the bulky pyrrolidine rings of Pro and Hyp point outward. The noncentrosymmetric orientation of the methylene groups in the rings produces a achiral nonlinear effect. The three α-chains (denoted with blue, green, and magenta) are connected by hydrogen bonds between the NH of the glycine and the CO of the proline in the X position of a neighboring α-chain, indicated by dashed lines in the figure, and create a helical ladder in the middle of the triple helix that gives rise to a supramolecular nonlinear chiral effect. Figure reproduced by permission of the publisher (Taylor & Francis Ltd., http://www.informaworld.com) of Ramachandran et al. (3).
Type I collagen is characterized by a complex hierarchical organization, in which discrete structural features are discernible at scales of organization extending over many orders of magnitude (7). The process of fibril formation begins as soon as procollagen, the precursor of collagen, undergoes enzymatic cleavage of its nonhelical propeptide extensions at its C- and N- termini, shortly after it is secreted by the cell. It is energetically favorable for the collagen molecules to line up next to each other, with each molecule offset by approximately one-quarter its length from neighboring molecules. This offset of 67 nm is known as the D-period (8). Microfibrils, consisting of pentameric assemblies of aligned collagen molecules, represent the first supramolecular structures. The fibers have a mean diameter between 0.5 and 3 micrometers and can be up to several hundred micrometers long. These structures are stabilized over time by enzymatically mediated intermolecular covalent crosslinks. In many tissues, microfibrils interact to form architecturally complex structures. Although fibrillar collagen has been extensively studied for decades, the molecular mechanisms underlying many structural and functional properties have been remarkably difficult to elucidate, perhaps due in part to the complexity of its organization. The electro-optical properties of collagen, such as piezoelectricity and second harmonic generation, have proven to be particularly elusive with respect to identifying proximal molecular mechanisms.
Piezo-electricity and second harmonic generation are present only in materials characterized by the absence of a center of symmetry on a microscopic scale that extends over macroscopic distances. Noncentrosymmetry in nonlinear optical organic media can be satisfied in at least three ways. First, noncentrosymmetric alignment of dipoles produces a large second-order hyperpolarizability, an effect we refer to as the “achiral” contribution. Second, the chirality of helical macromolecules, which are by definition noncentrosymmetric, can produce a significant nonlinear chiral contribution (9). A characteristic of the chiral contribution is that a fundamental input beam polarized parallel to the plane of incidence, produces a second harmonic radiation polarized orthogonal to the input polarization. Third, the intrinsic asymmetry present at any interface can produce surface effects; however, this effect is typically negligible in macromolecular organic structures. The molecular origins of chirality in second-order nonlinear effects have been recently reviewed (10).
Freund and co-workers have performed an extensive investigation of the polarity of collagen with SHG (11–15). The cylindrical symmetrical arrangement of collagen molecules about the long axis present in collagen fibril implies an effective C∞ symmetry when an average is taken over the dimensions of the wavelength of light. Freund confirmed that the C∞ symmetry produces an achiral effect that generates the largest second harmonic radiation polarized along the symmetry axis for a fundamental beam polarized parallel to the same axis. They concluded that the polarity in type I collagen is associated with two structures: a network of very fine polar filaments permeating the tendon and a small number of polar surface regions that may represent dense accumulations of the filaments. All of the filamentous structures have the same directionality. While they could not determine the molecular origins of the polarity, they argued that structural considerations suggested that it was unlikely to arise from the collagen triple helix itself. First, covalent bonds that could potentially contribute to polarity, such as C=O, N-H, and C-H bonds are almost all perpendicular to the main axis. Second, the dipolar effects produced by C-N bonds would cancel each other out. The contribution of bound water was excluded because SHG produced in wet and dry samples did not differ remarkably. They concluded that the “polar structures of connective tissue are likely to be composed of other substances.”
The contribution of supramolecular helicity to nonlinear chiral effects has been an area of recent interest, following the report that the helical arrangement in helicene is the source of a supramolecular nonlinear chirality (9). Campagnola and co-workers speculated that the SHG in collagen could be enhanced by chiral contributions (16). While each α-chain is expected to produce a chiral second-harmonic contribution, the cooperative effect of the triple-helical supramolecular structure of collagen should produce an even larger chiral nonlinear effect. No conclusive experimental evidence was presented in support of this claim at that time. Recently, Plotnikiv et al. (17) supported this claim by concluding that SHG signal arises from the pitch angle of a single collagen glycine-proline helix. While this conclusion was justified by theoretical fittings of SHG polarization anisotropy signal of fibrillar collagen, there is no identification of the molecular groups contributing to the chiral and achiral second-order optical nonlinearity. Pena and co-workers showed that the chiral enhancement in the optical nonlinearity of collagen is small (less than a factor of 2) by performing SHG experiments on thin layers of collagen molecules isotropically oriented on a substrate but were not organized into fibrils (18). It was concluded that the large SHG signals observed in connective tissue is due to the high density and microscopic crystalline order in collagen fibrils. Williams and co-workers concluded that the SHG is produced by the outer shell of a collagen fibril and within a <50 nm region, instead of from the bulk of the fibril by measuring ratios of forward and backward scattering of SHG from fibrils (19).
Sum-frequency generation vibrational (SFG-V) spectroscopy represents an attractive approach for identifying the molecular groups responsible for second-order nonlinear optical effects (20–22). Initially, applications of SFG-V focused on relatively small molecules oriented at interfaces; the method is increasingly being applied to more complicated macromolecules such as proteins (23–27). Helical proteins are of particular interest, since they are inherently noncentrosymmetric and possess electric-dipole-allowed second-order nonlinearity (28,29). For example, our group has identified the achiral molecular origins of second-order nonlinear effects in poly-α-benzyl-L-glutamate (PBLG), a synthetic α-helical protein, self-assembled film (25).
In this article, we use sum-frequency generation vibrational (SFG-V) spectroscopy to identify the molecular structures that give rise to both the chiral and achiral optical second-order nonlinear effects in native Type I collagen fibrils. In sum-frequency generation a sample is irradiated with two beams of coherent light at different angles of incidence, one at a frequency in the visible range, one at a frequency in the infrared range. Within the sample two photons (one from each beam) combine to form a single photon at a third frequency, which is dependent on the second-order optical nonlinearity tensor elements (ωSF = ωvis + ωIR). In SFG-V spectroscopy, ωIR is tuned while keeping ωvis fixed, and near some molecular vibration resonances the output signal is increased through resonant enhancement, producing the SFG-V spectra. A vibrational transition will only be observable in a SF spectrum if it is both Raman- and IR-active, which also implies that centrosymmetric molecular transitions will not be detected (20). Near a molecular vibration transition (ων), provided the input frequencies are not close to an electronic resonance of the medium, each molecular hyperpolarizability tensor element βi′j′k′, expressed in the molecule-fixed coordinate system (i′, j′, k′ = a, b, c), is proportional to a factor that depends on the Raman transition dipole moment and the IR transition dipole moment associated with that vibration transition (21). In the limit of weak coupling between the microscopic nonlinear molecular units, the macroscopic second-order susceptibility tensor elements are 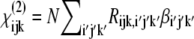 in the laboratory coordinate system (i, j, k = x, y, z), where N is the number density of molecules which contribute to the SFG signal, Rijk,i′j′k′ are elements of the Euler rotation matrix, βi′j′k′ is the hyperpolarizability tensor in the molecular coordinates, and the subscripts ijk are associated with the sum-frequency, visible, and IR electric fields, respectively. The output intensity is ISF ∝ |χeff|IvisIIR and
  where
where  is the unit polarization vector and
  the Fresnel factor at ω (30). By controlling the input polarizations and detecting a specific output polarization, specific tensor elements can be accessed, from which the orientation of molecular groups can be deduced.
The coordinate system shown in Fig. 2 is used for our SFG-V transmission measurements. The main axis of the collagen fiber is oriented along the x axis and the z axis. The z axis is perpendicular to the sample in the plane of incidence. A uniform orientation of the collagen fiber parallel to the x axis is important to avoid misinterpreting any anisotropic effects as chiral contributions (31). The notations P and S refer to beam polarizations parallel and perpendicular to the plane of incidence, respectively. With the main axis of the collagen molecules along the x axis, the 27 χijk tensor elements can be divided into elements that contribute to either achiral or chiral effects. The susceptibility tensor elements that contribute to chiral effects are those pertaining to orthogonal components, e.g., χijk (i ≠ j ≠ k) (10,18,22,28,32). The remaining elements contribute to the more common second-order nonlinear effects, the achiral effects. Experimentally one can access the chiral and/or achiral tensor elements by setting different input (visible and IR) beam polarizations and analyzing the SFG intensity. Table 1 shows the tensor elements accessed by the different input/output polarization combinations according to the coordinate system shown in Fig. 2. The PPP (with  and
and  all P-polarized), SSP, PSP, and SPP configurations couple to IR-vibrations molecules within the plane of incidence that have components normal and/or parallel to the collagen fibril axes. The SSS, PPS, SPS, and PSS configurations couple to the IR-vibrations of molecules perpendicular to the plane of incidence. Only achiral elements are accessed by the input/output beam polarization combinations configurations PPP, SSP, SPS, SSS, and PSS. Both chiral and achiral elements are accessed by the SPP, PSP, and PPS configurations. In these configurations the achiral contributions are zero under certain conditions. One example is the isotropic orientation of chiral molecules in a liquid (32). Another example occurs in azimuthally isotropic media with the symmetry axis along either the x or z axis, in which case χyxx = χyzz = χxyx = χxxy = χzzy = 0 (28,33). To avoid that anisotropic effects are misinterpreted as chiral contributions, we will use second harmonic imaging to ensure that the sample has a uniform distribution of fibers along a preferential axis, and will align this axis to the x axis in our SFG-V measurements. With this uniformity and orientation established in our experimental configuration, it can be assumed that only chiral tensor elements contribute sum-frequency generated by the SPP, PSP, and PPS configurations.
FIGURE 2.

SFG in the transmission mode. In the figure, ω1, ω2, and ωSF are the visible, infrared and sum-frequency beams, respectively. The collagen fibrils are oriented along the x axis.
TABLE 1.
Macroscopic second-order susceptibility tensor elements of collagen for the different input/output polarization combinations; the main axis of the collagen fiber is oriented along the x axis
| I/O polarization configurations (SF, VIS, IR) | Achiral elements | Chiral elements |
|---|---|---|
| PPP | χxxx, χxxz, χxzx, χxzzχzxx, χzxz, χzzx, χzzz | |
| SSP | χyyx, χyyz | |
| SPS | χyxy, χyzy | |
| SSS | χyyy | |
| PSS | χxyy, χzyy | |
| SPP (chiral) | χyxx, χyzz | χyzx, χyxz |
| PSP (chiral) | χxyx, χzyz | χxyz, χzyx |
| PPS (chiral) | χxxy, χzzy | χxzy, χzxy |
The polarization properties of SHG intensity from fibrillar and filament protein structures is well modeled using a C∞ cylindrical rod symmetry (15,17,34). This symmetry has four nonzero elements χxxx, χxyy = χxzz, χyxy = χyyx = χzxz = χzzx, and χyzx = −χzyx = −χzxy = χyxz. Typically in SHG measurements a single beam with a wavelength far off electronic resonances is used. Considering the particular case when the beam is propagating along the z direction, with a linear polarization in the xy plane, the only tensor elements probed by the laser beam are χxxx and χxyy = χyxy. A small ratio between these two independent susceptibility tensors, χxxx/χxyy ≪ 1, implies that the SHG intensity signal polarized along the fibril axis is less when the polarization of the fundamental electric field is parallel to the fibril than perpendicular to it. Having a signal polarized perpendicular to the plane of incidence is an indication that a chiral contribution is taking place and in such a case it is bigger than the achiral contribution. This technique has been used to determine the relative chiral and achiral contributions of collagen fibrils, myosin filaments and astroglial filaments (17,34). In contrast to such SHG measurements, with SFG-V spectroscopy we were able to explicitly identify the chiral and achiral contributions of the molecular groups to the second-order optical nonlinearity of collagen.
EXPERIMENTAL METHODS
Native type I collagen fibrils, a few hundred of microns in width and ∼1-cm-long, were prepared in vitro from native rat tail tendons (Sprague-Dawley). Individual tendon fascicles were removed from rat tail tendon bundles under a dissecting microscope. SFG spectroscopy measurements of collagen samples were made in transmission mode under conditions of ambient temperature and humidity. The IR and visible light beams were overlapped spatially and temporally as shown in Fig. 3. The visible green 0.532-μm beam was produced by a frequency-doubled Nd:YAG laser with 22-ps pulses at 10 Hz repetition rate (model No. PL2143C; EKSPLA, Vilnius-53, Lithuania) whereas the infrared tunable beam (2.5–8 μm) was produced by an OPG/OPA/DFG unit (EKSPLA PG501VIR/DFG). For this wavelength range the system was delivering 60–15 μJ pulse energy while its line width was kept smaller than 6 cm−1. The energy fluence in the collagen sample was kept constant by setting the energy of the focused IR and visible beams from 50 μJ and 3 μJ, respectively. The IR wavelength was stepped under computer control in 5 nm increments. Using a combination of a polarizer, a λ/2 plate, and a focusing lens, the visible beam was attenuated, set to P/S-polarization and focused onto the collagen sample. The IR P/S-polarization was set using a ZnSe IR-coated Fresnel rhomb (II-VI Corporation, Saxonburg, PA) and a ZnSe 25 cm focal length lens focused the beam to the sample. The angle between the incident infrared and visible laser beams was kept constant at 90°. The direction of the transmitted SFG beam was determined by the momentum conservation condition. Due to the roughness of the sample, the transmitted SFG and the pump visible beam where strongly scattered. The use of a telescope system allowed the SFG beam to be collected without the necessity of tracking its direction. An analyzer was placed before the photomultiplier tube (PMT) to characterize the polarization of the SFG signal. An interference filter (Notch-Plus; Kaiser Optical Systems, Ann Arbor, MI) was used to reject the scattered 0.532 μm beam, and sharp-cut-edge color filters (model No. J30635; Edmund Scientific, Tonawanda, NY) were used to filter spurious signals from the OPA while transmitting the sum-frequency signal. The signal produced in the PMT was transformed via a 50 Ω resistance and then preamplified using a 300 MHz quad preamplifier (model No. SR445; Stanford Research Systems, Sunnyvale, CA). The preamplified data was averaged using a gated integrator (model No. SR250; Stanford Research Systems) where baseline subtraction was performed to reduce the background noise floor. The averaged data was digitized using an A/D (IO Tech, Cleveland, OH) and sent to a PC.
FIGURE 3.

Experimental configuration for transmitted SFG spectroscopy. ω1, ω2, and ωSF are the visible, IR, and SFG beams, respectively. The angle between the IR and visible is kept at 90° with respect to each other. The angle ϕ between the transmitted visible and the SFG beams is determined by momentum conservation. (In the figure, CS, L, f, F, PL, F, and PMT means Collagen Sample, Lens, focal length, Linear Polarizer, Filters, and Photomultiplier Tube, respectively. Dashed lines represent the scattered ω1 collected by the lens whereas dotted line is the normal of the xy plane.
SHG polarization modulation imaging (35) was used to confirm that the microfibrils were distributed evenly over the region of exposure and that molecular orientation was parallel to the main axis of the collagen fibril. A Ti:Sapphire oscillator (SpectraPhysics, Tsunami, Mountain View, CA) was used to generate linearly polarized ∼200 fs pulses at a wavelength of 840 nm, with a maximum energy of 5 nJ, and at a repetition rate of 79 MHz. The laser beam was spatially filtered and collimated. The polarization direction of the linearly polarized input beam was rotated at a 1.5 kHz rate with an electro-optic modulator (EOM, model No. 360-80; Conoptics, Danbury, CT) and quarter-wave plate (Babinet-Soleil compensator, Karl Lambrecht Corporation, Chicago, IL). The EOM has its axes oriented at 45° to the polarization of the input beam and the quarter-wave plate has its axis oriented at 45° to that of the EOM. The quarter-wave plate converts the elliptically polarized light that exits the EOM into linearly polarized light rotated by some angle with respect to the laser polarization direction. The degree of rotation is directly proportional to the applied voltage: from 0° for 0 V to 180° for the full-wave voltage of the EOM. A function generator (DS345; Stanford Research Systems) provided a saw-tooth waveform at 4 kHz with an amplitude that drives a high-voltage power supply (model No. 302A; Conoptics, Danbury, CT) to the full-wave voltage of the EOM. The beam was focused onto the sample by a long working distance microscope objective (100×, NA = 0.7, 6.35 mm working distance; Mitutoyo, Aurora, IL) to a measured beam waist ∼1.5 mm. The sample is mounted on motorized x-y-z translation stages (model No. ESP300 controller, 850F motorized micrometers; Newport, Irvine, CA, connected to a model No. PCI-GPIB card; National Instruments, Austin, TX). The transmitted second harmonic signal was collected using a microscope condenser (model No. 1.4 Achromat; Olympus, Center Valley, PA). The second harmonic signal was filtered with color glass bandpass filter (model No. BG-40, Newport) with a peak transmission of ∼95% (at ∼415 nm) and the second harmonic signal was detected with a photomultiplier tube (model No. R212UH; Hamamatsu, Bridgewater, NJ) mounted in a light-tight enclosure to minimize stray light. The polarization modulated beam produced a SHG signal with frequency components at the first and second harmonic of the modulation frequency (35). Lock-in amplifiers (model No. SR830; Stanford Research Systems) were set to detect the amplitude and phase of the SHG signal at both the first and second harmonic of the modulation frequency. The reference frequency was the 4 kHz harmonic of the signal modulating the driving the EOM. Assuming that a collection of collagen molecules in a fibril has C∞ symmetry, the intensity of the first modulation harmonic is proportional to the maximum second harmonic intensity produced in the plane of the sample, and the phase of the second harmonic of the modulated intensity is proportional to the projection of the average orientation for collagen molecules onto the plane of the sample. The x and y outputs from the lock-in amplifier were digitized by an A/D converter (model No. PCI-6025E; National Instruments) from which the second harmonic intensity produced by collagen and average orientation of the collagen molecules were determined. A second harmonic image of the orientation of collagen assemblies of a typical sample used in our experiments is shown in Fig. 4. The sample shows good uniformity in fibril orientation over an area of 300 × 300 micron which is larger than the 50-μm diameter spot of the focused IR beam used in the SFG-V measurements.
FIGURE 4.

The spatial distribution of collagen fibrils obtained by polarization modulated second harmonic imaging in a typical sample used in the sum-frequency spectroscopy measurements. Collagen assemblies are selected with a uniform distribution of fibrils along a dominant axis to minimize anisotropic contributions to chiral second-order nonlinear effects. The standard deviation of the distribution of angles is 13.0° and the average is 17.5°.
Unpolarized Fourier transform IR vibrational spectra (model No. 670 FT-IR; Nicolet Nexus, Waltham, MA) were taken in transmission mode. Raman spectral measurements (model No. RFS 100/S Raman spectrophotometer; Bruker, Madison, WI) using a diode-pumped Nd:YAG laser as pump, coupled to a microscope (RamanScopeII; Bruker), were taken in reflection mode from a sample mounted onto a optically thick gold-coated microscope slide.
RESULTS AND DISCUSSION
Vibrational IR and Raman spectra of fibrillar collagen
We performed our investigation in a type I collagen fibrillar array because both the macromolecular structure as well as the supramolecular organization of collagen molecules contribute to the macroscopic optical nonlinearity of fibrous collagen. This requirement significantly complicates the interpretation of the SFG-V spectra. Even for relatively simple molecular structures the spectral assignments for SFG-V is less straightforward than for IR absorption and Raman spectra (20). Furthermore, extracting information about the orientation of molecules or parts of molecules from the SFG-V spectra is challenging (36,37). In addition, the interpretation of IR absorption and Raman spectra of protein is complicated by overlap in the contributions produced by the many different vibrational modes that can occur in these large, complex molecules. The investigation of structure at the supramolecular level of organization introduces an additional level of complexity in the interpretation of the SFG-V spectra. For such reasons we complement of our SFG-V spectra with IR absorption and Raman spectra taken on the same sample, since a vibration peak is only sum-frequency-active if it is both IR- and Raman-active.
The unpolarized IR and unpolarized Raman spectra for the collagen sample are shown in Fig. 5. The observed IR and Raman spectral features are consistent with other measurements of collagen in the spectral region from 1200 cm−1 to 3400 cm−1. General spectral assignments are made by comparing the polarized SFG-V spectra with unpolarized Raman and IR spectra, and focusing on commonalities. The spectroscopic characteristics of collagen appear to be dominated by the tripeptide sequence glycine, proline, and hydroxypoline (Gly-Pro-Hyp) (38), based on similarities between the IR spectra of polyproline and polyglycine and the spectra of collagen (38–41). Due to the proximity of the frequency positions of methyl (CH3) and methylene (CH2), a common mistake is to assign the peaks of these spectral regions to the vibrational stretching and bending modes of both groups in connective tissue (40,42–44). The overall content of methyl in collagen is very low when compared to methylene; for every 1000 residues in collagen there are ∼1236 methylene and 230 methyl groups (45,46). For this reason, collagen spectral features in the 1300–1500 cm−1 and 2800–3000 cm−1 regions are primarily due to the methylene groups of the proline side chains where no methyl groups are present. Collagen spectra comprise seven general regions:
The amide A region caused by the first excited state stretching vibrations of peptide NH-groups involved in interchain hydrogen-bonding (38,39,42).
The amide B that originates from an interaction between the amide A band and the overtone of the amide II vibration (47) (such an interaction is known as a Fermi resonance).
The methylene CH2 region.
The amide I region that arises mainly from the C=O stretching vibration with a small contribution from N-H in-plane bending (42,47).
The amide II region caused by an out-of-phase combination of C-N stretching and N-H bending modes (42,47).
The CH2 wagging and bending region.
The amide III region caused by a combination of N-H bending and C-N stretching vibration mixed with the CH2 wagging vibration from the glycine backbone and proline side chains (38).
FIGURE 5.

Unpolarized Raman and FT-IR spectrum of a native RTT collagen sample.
Based on polarization-sensitive SFG-V measurements, we assign the IR band centered at 2945 cm−1 to a Fermi resonance between the symmetric stretch vibration of methylene at 2869 cm−1 and the overtone of the methylene bending mode at 1457 cm−1. The peak found at 1403 cm−1 is a characteristic band of polyglycine peptides due to the CH2 wagging mode (41). The peak at 1338 cm−1 is the absorption from CH2 wagging vibration of the imino-acid side chains (38), the peak at 1239 cm−1 is the amide III (38). The other IR molecular vibrations assignments are: amide A at 3326 cm−1; amide B at 3078 cm−1 (47); amide I at 1659 cm−1; and amide II at 1549 cm−1. In the Raman spectra the dominant peaks are assigned to the Fermi resonance at 2940 cm−1, the symmetric CH2 resonance at 2890 cm−1, amide I resonance at 1670 cm−1, the CH2 bending mode at 1450 cm−1, and the amide III resonance at 1272 cm−1. The spectral bands of amide A and amide B peaks are observable but are poorly resolved. Note that the amide II is absent in this Raman spectra.
SFG-vibrational spectra of fibrillar collagen
Fig. 6 shows for the first time, to our knowledge, the SFG-V spectra of collagen type I fibers. The IR and Raman spectra of collagen indicate that the amide I, III, A and B bands, as well as the CH2 bending and wagging modes, are both IR- and Raman-active and all appear in Fig. 5. The amide A and B bands are present but very weak (for example, see also Fig. 7). Freund and co-workers predicted that because of extensive cancellation of dipoles of the C-N bonds they do not contribute to optical nonlinearity (14). This is now experimentally confirmed in the measured IR, Raman, and SFG-V spectra. The amide II band is only present in IR-spectra; as expected, it does not appear in the SFG-V spectra.
FIGURE 6.

SFG-V PPS, PPP, SPP, and SS spectra of collagen type I taken in transmission mode.
FIGURE 7.

Comparison of the achiral SFG-V spectra PPP, SSP, and SSS in the 2800–3400 cm−1 spectral region.
The achiral  elements contribute to the spectra measured with the PPP- and SSS-configuration. The chiral
  elements contribute to the spectra measured with the PPS- and SPP-configuration. The dominant peaks in the achiral and the chiral spectra are distinctly different. The achiral
  elements produce a dominant peak in CH2 region at 2949 cm−1 of the PPP spectra and we assign it to the CH2 groups located in the pyrrolidine rings of proline and hydroxyproline amino-acid residues stabilized toward the outside of the collagen molecule by strong steric interactions. In contrast, the chiral
  elements produce a dominant peak in the amide I region at 1627 cm−1 of the PPS spectra and we assign it to a helical ladder formed by hydrogen-bonding between the peptide NH groups of glycine residue in one α-chain and the CO groups in the proline residue of the neighboring α-chain in the middle of the triple helical collagen molecule. The CO groups are the main contributors to the chiral signal. The intensity ratio of the dominant CH2 band in the achiral PPP SFG-V spectrum with respect to the dominant CO band of the chiral SFG-V spectrum, IPPP/IPPS = 0.8, confirms that the optical nonlinearity of collagen is caused by both a dipolar and chirality contributions of an approximately equal order of magnitude.
The achiral and chiral SFG-V spectrums directly confirm that the nonlinear optical nonlinearity of collagen is caused by both a dipolar and chirality contributions of an approximately equal order of magnitude. In the achiral nonlinear spectra the remaining prominent bands are attributable to the amide I, amide III, and others that involve methylene groups, i.e., the bending mode, the wagging mode at 1385 cm−1, and finally the amide III band. In the chiral nonlinear spectra the remaining prominent bands involve the Fermi resonance δ(CH2) that involves methylene groups, i.e., the bending mode, the wagging mode at 1385 cm−1, and finally the amide III band.
Methylene group: the dominant achiral contribution
The experimental results shown in Fig. 6 clearly indicate that the methylene functional group in the pyrrolidine rings of proline and hydroxyproline amino-acid residues plays a dominant role in the achiral contributions to the second-order nonlinearity of collagen. More detailed spectral results in the 2800–3400 cm−1 regime are shown in Fig. 7. Peak-fitting in the methylene CH2 region consistently produced three peaks. The Raman spectra show the presence of a very strong peak at 2936 cm−1 and two weaker peaks at 2897 cm−1 and 2965 cm−1. The IR spectra reveal two peaks of equal strength at 2874 cm−1 and 2970 cm−1, and a slightly stronger peak at 2931 cm−1. PPP spectra has a very strong peak at 2949 cm−1, a strong peak at 2994 cm−1, and a very weak peak at 2888 cm−1. We performed a detailed polarization analysis of the SFG signal at the 2949 cm−1 peak assuming symmetries of either symmetric or asymmetric stretching CH2 modes (see below for details), and only the symmetric symmetry produced results that are consistent with the experimental results. Therefore, we assign this band to a Fermi resonance between the symmetric stretch vibration of methylene at 2888 cm−1 and the overtone of the methylene bending mode at 1478 cm−1. The broad characteristic of this band could be due to a mixing of the Fermi resonance and the corresponding asymmetric stretch mode at 2994 cm−1. The Fermi band always dominates the achiral SSP, PPP, and SSS spectra in this frequency region; a phenomenon observed also in the remain achiral spectra (SPS and PSS, not shown). The mixing of the Fermi resonance and the corresponding asymmetric stretching mode of CH2 is evident for the band shoulder near 3000 cm−1 of the PPP and SSS spectra. In the SSP this shoulder is less pronounced since the tensor elements χyyz from the symmetric and asymmetric vibrational stretching modes have opposite signs and a destructive interference occurs between the two contributions (48).
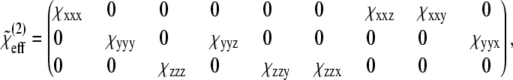
In collagen proteins, the methylene groups of proline and hydroxyproline (with three and two CH2 molecules in their side chains, respectively) point out from the rodlike collagen triple helix. The CH stretching spectral region of methyl and methylene groups, between 2800 and 3000 cm−1, has been extensively studied and documented in SFG-V spectroscopy of surface adsorbates (48–52). A detailed assignment of methylene vibration spectral contributions from SFG-V spectra is complicated even when present in relatively simple organic molecules with methylene groups identified as a major contributing factor (48). Following the approach by Lu and co-workers (48), the average orientation of the methylene groups at interfaces was estimated by correlating the expected effective susceptibility tensor in the laboratory system with the corresponding SFG intensities measured at different input/output beam polarization configurations. The methylene orientation model with respect to the helical, or fiber, axis is shown in Fig. 8. In the figure (x, y, z) and (a, b, c) denote the laboratory-fixed and the molecular-fixed coordinate systems, respectively. The symmetric stretch vibration of CH2 consists of in-phase oscillations of the hydrogen atoms along the axis of symmetry and the asymmetric vibration consists of out-of-phase oscillations of the hydrogen atom along the bond axis in the ac plane. The laboratory and the sample coordinate systems are considered the same with x axis along the fiber direction. In the molecular-fixed coordinates, the c axis is along the symmetry axis of CH2 (bisecting the two CH bonds away from the H-atom side), the a axis is in the H-C-H plane perpendicular to c, and the b axis is orthogonal to a and c out of the CH2 plane. The three angles (ψ, θ, φ) are the transformation Euler angles, where φ denotes the twist angle along the molecule symmetry (c axis), θ the polar angle between the z axis of the laboratory coordinate system and the c axis of the molecular coordinate system, and ψ the azimuth angle between the projection of the c axis of the molecule and the x axis of the laboratory system. The molecular symmetry of a specific functional group determines the nonzero elements of the molecular polarizability tensor  In this work we use the symmetry of the symmetric stretch of the methylene group because the overtone and the fundamental frequencies of the symmetric CH2 stretching modes produce the Fermi resonance. The methylene group has symmetry with three nonvanishing tensor elements, βaac, βbbc, and βccc, for the symmetric stretching mode (49,50). Based on the Euler rotation angles (ψ, θ, φ), assuming a random orientation distribution of the CH2 molecules within the molecular ab plane and applying the relationship βaac + βbbc = 2βccc between the nonvanishing tensor elements (48,49), the effective macromolecular susceptibility is
 |
(1) |
where tensor elements are reduced to only three independent components by
 |
(2) |
The three independent tensor elements depend only on the hyperpolarizability tensor element βccc, with c along the molecular axis of symmetry, and the respective polar θ and azimuthal ψ average angles. The SFG intensities ratio of the two input/output polarization combinations SSP and SSS is proportional to the three components, χxxx, χyyy, and χzzz, in the form ISSP/ISSS = dr2, where d is a constant of proportionality and r is given by
 |
(3) |
The orientation of methylene groups was simulated using Eqs. 1 and 2 considering a Gaussian distribution for angles θ and ψ along the collagen fibrils. The input angles of the IR and visible beams with the z axis were −45° and 45°, respectively. Fig. 9, a and b, show the experimental and simulated polarization state of the SFG signal, respectively, for the four possible input beam polarization αPP, αPS, αSP, and αSS. The polar-angle α is the position of the analyzer measured with respect to the plane of incidence (i.e., the xz plane of Fig. 2). The experimental results are qualitatively in good agreement with the simulation. If there was no tilt with respect to the z axis (i.e., θ = 0°, then χxxx = χyyx = χzzx = 0, χyyy = χxxy = χzzy = 0, and χzzz = χxxz = χyyz ≠ 0), the configurations SSS and PPS would not excite any SFG signal (see Table 1). The nonzero intensities obtained in our SSS and PPS spectra indicate that on average the methylene groups are tilted with respect to the z axis. To estimate the orientation of the symmetry axis of the methylene groups, the experimental condition ISSP ≥ IPPP ≥ ISSS ≥ ISSP, obtained for the average maximum intensities of the polar plots (α = 0 and π for P, π/2 and 3π/2 for S) shown in Fig. 9 b, is the determining criteria. Fig. 10 b shows the SFG of the IPPP, IPPS, ISSP, and ISSS intensities, simulated from Eq. 1 to Eq. 3, as a function of the polar angle, θ, with a fixed azimuth angle, ψ, where a Gaussian distribution was assumed for both the polar and the azimuth angles. The best fit to our experimental results was obtained for θ = 14.5° and ψ = 25°, with the respective distribution widths of σθ = 20° and σψ = 85°. Different values for θ and ψ yield results that are not experimentally observed, e.g., ISSP = IPPP = ISSS or inverted ratio for IPPP and IPPS, etc. The fitted angles indicate that the CH2 molecules that contribute to the nonlinear response have an axis of symmetry nearly normal to the fibril and in the plane of incidence. The small, but distinctive, 14.5° tilt from the normal to the main axis is enough to obtain strongly polarized SFG signals parallel and perpendicular to the fiber axis present in Fig. 9 a in the PPP and SSS configurations. Using Eq. 3, a value of r = 2.1 is obtained demonstrating that there is a stronger molecular nonlinear response for fields oscillating along the plane of incidence. The SHG investigation by Williams and co-workers concluded that the nonlinearity originates from the outer shell region, estimated at 50 nm, of a collagen fibril (19). In the context of their conclusion and our finding that the orientation of the methylene groups plays a dominant role in the achiral second-order nonlinearity in collagen fibers, given that the spot size used in the SFG-V measurements average over several microfibrils that are aligned parallel to each other, it is concluded that only the methylene groups oriented toward the outside of individual microfibrils contribute collectively to produce a large second-order optical nonlinearity.
FIGURE 8.

Orientation model of methylene groups in collagen.
FIGURE 9.

Polarization analysis of the Fermi resonance peak: (a) experimental data and (b) simulated data. In the figure: α PP (-○-), α SP (-□-), α PS (-•-), and α SS (-▵-). The polar angle denotes the angle a of the analyzer measured with respect to the plane of incidence.
FIGURE 10.

Simulated SFG intensities as a function of the polar angle θ and fixed azimuth angle ψ = 25°. A Gaussian distribution is assumed for both the polar and azimuth angles.
Carbonyl group: the dominant chiral contribution
Given the prominence of the amide I band in the chiral spectra, and its presence in the achiral spectra, the C=O and N-H play an important role in the molecular origins of optical nonlinearity in collagen.
Unlike the helical arrangement of C=O and N-H groups in a protein α-helix that are stabilized by intrachain hydrogen bonds, in the collagen triple helix they are stabilized by interchain bonding between adjacent α-chains. Even so, the α-helix and the triple-helical collagen has the helical arrangement of the C=O and N-H groups in common, and have the same hyperpolarizability tensor symmetry for amide I. In the coordinate system shown in Fig. 2 where the fiber axis is along the x axis, the orientational average hyperpolarizability nonzero tensor elements of the helically arranged amide groups in collagen fiber are expected to be χxxx, χxzz = χxyy, χzzx = χyyx, χzxz = χyxy, χzyx = −χyzx, χzxy = −χyxz, and χxzy = −χxyz (27). The first four entries cause an achiral contribution, and the last three are associated with the chiral effect. The measured SFG spectra of collagen in the amide I region are in general consistent with this symmetry. Although the amide I peak dominates both the PPS and SPP nonlinear SFG-V spectra, it is predominant in the PPS configuration where the SFG signal is polarized parallel to the fibrils directions (Fig. 9). The C∞ symmetry of the macromolecular effective susceptibility tensor of collagen fibrils suggests that the chiral tensor elements of the amide I are such that χxzy ≪ χzxy, and χyzx = −χzyx ≈ −χzxy = χyxz. In that way there is only one tensor element, −χzxy, contributing to the PPS spectrum while the magnitude of the SPP spectrum is canceled by a destructive interference between χyxz and −χzxy. Therefore amide I peak is large in the PPS spectra and small in the SPP spectra as is shown experimentally. The amide A is almost nonexistent in the SFG-V spectra, and since it is associated with the NH− groups involved in interchain hydrogen-bondings, it is concluded that the observed nonlinearity is dominated by the CO-groups; however, the contribution of the NH− groups are not negligible, as evidenced by the notable presence of the amide III band in all spectra. It is noted that the assumed symmetry model for the amide I does not explain the amide I peak present in the SSS spectra. This peak is attributed to the organization of the collagen molecules that is not perfectly uniform when averaged over several collagen fibers. Type I collagen fibrils reveals noticeable achiral contributions to the amide I band, as clearly evidenced by the PPP and SSS spectra shown in Fig. 6. Nevertheless, the achiral contributions in this region are significantly smaller than chiral contributions.
Semiempirical computations and second harmonic measurements performed by Mitchell et al. (53) indicated that chiral contribution to second harmonic generation of α-helices, such as PBLG, is small and mainly due to a structural effect associated with the tilt of the plane of each amide chromophore relative to the long axis of the helix. SFG-V spectroscopy on PLBG monolayers confirmed this conclusion (25). In the PPP spectra of collagen the C=O band in collagen is negligible, whereas in PBLG it is a dominant contribution. In contrast to PBLG, in which a large achiral component arises from the noncentrosymmetric alignment of the NH− and CO− groups along the main axis of each α-helix, a fibrillar collagen array is characterized by helical organization at the macroscopic scale as well as the microscopic scale. The nonlinear chiral effects in collagen structures (fiber, fibril, microfibrils, etc.) are expected to be more pronounced since the tilt of the plane of each amide chromophore is much more pronounced in the collagen triple helix than a single α-helix. The chiral effects are attributable to macroscopic structural features, since the wavelength of the optical radiation is much larger than the individual collagen molecule. This observation is consistent with recent crystallographic investigations into structural organization of type I collagen fibrillar arrays (54) where it was shown that neighboring collagen molecules are packed together to form a supertwisted, discontinuous, right-handed microfibril that interdigitates with neighboring microfibrils to form a crystallographic superlattice.
CONCLUSIONS
The molecular origins of the second-order optical nonlinearity of collagen fibrils have been identified with SFG-V spectroscopy. While Freund et al. correctly observed that in collagen the NH and CO− groups are very nearly normal to the main axis of the triple helix and that the C-H bonds are mostly perpendicular to the main axis (14), they incorrectly speculated that these groups do not contribute to the polarity of collagen fibrils. The small yet distinctive tilt of methylene groups in the pyrrolidine rings of proline and hydroxyproline amino-acid residues that are stabilized normal to the main axis of collagen molecule produce a large achiral contribution and the helical arrangement of CO− groups around the main axis of a collagen molecule causes a significant chiral contribution to the second-order optical nonlinearity present in collagen fibrils I.
Acknowledgments
The research was funded by the National Science Foundation under award No. DMR0213618 to the Center on Polymer Interfaces and Macromolecular Assemblies. I. Rocha-Mendoza was also supported by the UC Mexus-Conacyt Research Fellowships Nos. 030197 and 140019.
Israel Rocha-Mendoza's present address is Cardiff University, School of Biosciences, Cardiff, Wales, UK.
Editor: Enrico Gratton.
References
- 1.Myllyharju, J., and K. I. Kivirikko. 2004. Collagens, modifying enzymes and their mutations in humans, flies and worms. Trends Genet. 20:33–43. [DOI] [PubMed] [Google Scholar]
- 2.Engel, J., and H. P. Bächinger. 2005. Structure, stability and folding of the collagen triple helix. In Collagen. Springer Berlin/Heidelberg.
- 3.Ramachandran, G., M. Bansal, and R. Bhatnagar. 1973. A hypothesis on the role of hydroxyproline in stabilizing collagen structure. Biochim. Biophys. Acta. 322:166–171. [DOI] [PubMed] [Google Scholar]
- 4.Holmgren, S. K., K. M. Taylor, L. E. Bretscher, and R. T. Raines. 1998. Code for collagen's stability deciphered. Nature. 392:666–667. [DOI] [PubMed] [Google Scholar]
- 5.Raines, R. T. 2006. 2005 Emil Thomas Kaiser Award. Protein Sci. 15:1219–1225. [DOI] [PMC free article] [PubMed] [Google Scholar]
- 6.Silver, F. H., J. W. Freeman, and G. P. Seehra. 2003. Collagen self-assembly and the development of tendon mechanical properties. J. Biomech. 36:1529–1553. [DOI] [PubMed] [Google Scholar]
- 7.Baer, E., J. J. Cassidy, and A. Hiltner. 1988. Hierarchical structure of collagen and its relationship to the physical properties of tendon. In Collagen, Vol. II: Biochemistry and Biomechanics. M. E. Nimni, editor. CRC Press, Boca Raton, FL.
- 8.Brodsky, B., E. F. Eikenberry, K. C. Belbruno, and K. Sterling. 1982. Variations in collagen fibril structure in tendons. Biopolymers. 21:935–951. [DOI] [PubMed] [Google Scholar]
- 9.Verbiest, T., S. V. Elshocht, M. Kauranen, L. Hellemans, J. Snauwaert, C. Nuckolls, T. J. Katz, and A. Persoons. 1998. Strong enhancement of nonlinear optical properties through supramolecular chirality. Science. 282:913–915. [DOI] [PubMed] [Google Scholar]
- 10.Simpson, G. J. 2004. Molecular origins of the remarkable chiral sensitivity of second-order nonlinear optics. ChemPhysChem. 5:1301–1310. [DOI] [PubMed] [Google Scholar]
- 11.Roth, S., and I. Freund. 1979. 2nd harmonic-generation in collagen. J. Chem. Phys. 70:1637–1643. [Google Scholar]
- 12.Roth, S., and I. Freund. 1981. Optical 2nd-harmonic scattering in rat-tail tendon. Biopolymers. 20:1271–1290. [DOI] [PubMed] [Google Scholar]
- 13.Roth, S., and I. Freund. 1982. 2nd harmonic-generation and orientational order in connective-tissue—a mosaic model for fibril orientational ordering in rat-tail tendon. J. Appl. Cryst. 15:72–78. [Google Scholar]
- 14.Freund, I., M. Deutsch, and A. Sprecher. 1986. Connective-tissue polarity—optical 2nd-harmonic microscopy, crossed-beam summation, and small-angle scattering in rat-tail tendon. Biophys. J. 50:693–712. [DOI] [PMC free article] [PubMed] [Google Scholar]
- 15.Freund, I., and M. Deutsch. 1986. Macroscopic polarity of connective-tissue is due to discrete polar structures. Biopolymers. 25:601–606. [DOI] [PubMed] [Google Scholar]
- 16.Campagnola, P. J., A. C. Millard, M. Terasaki, P. E. Hoppe, C. J. Malone, and W. A. Mohler. 2002. Three-dimensional high-resolution second-harmonic generation imaging of endogenous structural proteins in biological tissues. Biophys. J. 82:493–508. [DOI] [PMC free article] [PubMed] [Google Scholar]
- 17.Plotnikov, S. V., A. C. Millard, P. J. Campagnola, and W. A. Mohler. 2006. Characterization of the myosin-based source for second-harmonic generation from muscle sarcomeres. Biophys. J. 90:693–703. [DOI] [PMC free article] [PubMed] [Google Scholar]
- 18.Pena, A. M., T. Boulesteix, T. Dartigalongue, and M. C. Schanne-Klein. 2005. Chiroptical effects in the second harmonic signal of collagens i and iv. J. Am. Chem. Soc. 127:10314–10322. [DOI] [PubMed] [Google Scholar]
- 19.Williams, R. M., W. R. Zipfel, and W. W. Webb. 2005. Interpreting second-harmonic generation images of collagen i fibrils. Biophys. J. 88:1377–1386. [DOI] [PMC free article] [PubMed] [Google Scholar]
- 20.Bain, C. D. 1995. Sum-frequency vibrational spectroscopy of the solid-liquid interface. J. Chem. Soc. Faraday Trans. 91:1281–1296. [Google Scholar]
- 21.Shen, Y. R. 1998. Chapter 10. In Nonlinear Spectroscopy for Molecular Structure Determination. R. W. Field, E. Hirota, J. P. Maier, and S. Tsuchiya, editors. Blackwell Science, Oxford, UK.
- 22.Shen, Y. R. 2001. Exploring new opportunities with sum-frequency nonlinear optical spectroscopy. Pure Appl. Chem. 73:1589–1598. [Google Scholar]
- 23.Wang, J., S. M. Buck, M. A. Even, and Z. Chen. 2002. Molecular responses of proteins at different interfacial environments detected by sum frequency generation vibrational spectroscopy. J. Am. Chem. Soc. 124:13302–13305. [DOI] [PubMed] [Google Scholar]
- 24.Wang, J., M. Buck, and Z. Chen. 2003. The effect of surface coverage on conformation changes of bovine serum albumin molecules at the air-solution interface detected by sum frequency generation vibrational spectroscopy. Analyst. 128:773–778. [DOI] [PubMed] [Google Scholar]
- 25.Knoesen, A., S. Pakalnis, M. Wang, W. D. Wise, N. Lee, and C. W. Frank. 2004. Sum-frequency spectroscopy and imaging of aligned helical polypeptides. IEEE J. Sel. Top. Quant. Electr. 10:1154–1163. [Google Scholar]
- 26.Paszti, Z., J. Wang, M. L. Clarke, and Z. Chen. 2004. Sum frequency generation vibrational spectroscopy studies of protein adsorption on oxide-covered TI surfaces. J. Phys. Chem. B. 108:7779–7787. [Google Scholar]
- 27.Perry, J. M., A. J. Moad, N. J. Begue, R. D. Wampler, and G. J. Simpson. 2005. Electronic and vibrational second-order nonlinear optical properties of protein secondary structural motifs. J. Phys. Chem. B. 109:20009–20026. [DOI] [PubMed] [Google Scholar]
- 28.Wang, J., X. Y. Chen, M. L. Clark, and Z. Chen. 2005. Detection of chiral sum frequency generation vibrational spectra of proteins and peptides at interfaces in situ. Proc. Natl. Acad. Sci. USA. 102:4978–4983. [DOI] [PMC free article] [PubMed] [Google Scholar]
- 29.Ji, N., and Y. R. Shen. 2004. Optically active sum frequency generation from molecules with a chiral center: amino acids as model systems. J. Am. Chem. Soc. 126:15008–15009. [DOI] [PubMed] [Google Scholar]
- 30.Zhuang, X., P. B. Miranda, D. Kim, and Y. R. Shen. 1999. Mapping molecular orientation and conformation at interfaces by surface nonlinear optics. Phys. Rev. B. 59:12632–12640. [Google Scholar]
- 31.Sioncke, S., S. V. Elshocht, T. Verbiest, A. Persoon, M. Kauranen, K. E. S. Phillips, and T. J. Katz. 2000. Optical activity effects in second harmonic generation from anisotropic chiral thin films. J. Chem. Phys. 113:7578–7581. [Google Scholar]
- 32.Belkin, M. A., T. A. Kulakov, K. H. Ernst, L. Yan, and Y. R. Shen. 2000. Sum-frequency vibrational spectroscopy on chiral liquids: A novel technique to probe molecular chirality. Phys. Rev. Lett. 85:4474–4477. [DOI] [PubMed] [Google Scholar]
- 33.Fischer, P., and F. Hache. 2005. Nonlinear optical spectroscopy of chiral molecules. Chirality. 17:421–437. [DOI] [PubMed] [Google Scholar]
- 34.Fu, Y., H. Wang, R. Shi, and J. Cheng. 2007. Second harmonic and sum frequency generation imaging of fibrous astroglial filaments in ex vivo spinal tissues. Biophys. J. 92:3251–3259. [DOI] [PMC free article] [PubMed] [Google Scholar]
- 35.Stoller, P., K. M. Reiser, P. M. Celliers, and A. M. Rubenchik. 2002. Polarization-modulated second harmonic generation in collagen. Biophys. J. 82:3330–3342. [DOI] [PMC free article] [PubMed] [Google Scholar]
- 36.Wang, J., M. L. Clarke, and Z. Chen. 2004. Polarization mapping: a method to improve sum frequency generation spectral analysis. Anal. Chem. 76:2159–2167. [DOI] [PubMed] [Google Scholar]
- 37.Moad, A. J., and G. J. Simpson. 2004. A unified treatment of selection rules and symmetry relations for sum-frequency and second harmonic spectroscopies. J. Phys. Chem. B. 108:3548–3562. [Google Scholar]
- 38.Jackson, M., L. P. Choo, P. H. Watson, W. C. Halliday, and H. H. Mantsch. 1995. Beware of connective-tissue proteins—assignment and implications of collagen absorptions in infrared-spectra of human tissues. Biochim. Biophys. Acta Mol. Basis Dis. 1270:1–6. [DOI] [PubMed] [Google Scholar]
- 39.Jayasuriya, A. C., J. I. Scheinbeim, V. Lubkin, G. Bennett, and P. Kramer. 2003. Piezoelectric and mechanical properties in bovine cornea. J. Biomed. Mater. Res. A. 66A:260–265. [DOI] [PubMed] [Google Scholar]
- 40.Fringeli, U. P. 1981. Membrane Spectroscopy. E. Grelle, editor. Springer-Verlag, Heidelberg.
- 41.Dwivedi, A. M., and S. Krimm. 1982. Vibrational analysis of peptides, polypeptides, and proteins.10. poly(glycine-I) and its isotopic derivatives. Macromolecules. 15:177–185. [Google Scholar]
- 42.Lazarev, Y. A., A. V. Lazareva, A. Shibnev, and N. G. Esipova. 1978. Infrared-spectra and structure of synthetic polytripeptides. Biopolymers. 17:1197–1214. [Google Scholar]
- 43.Edwards, H. G. M., and F. R. Perez. 2004. Application of Fourier transform Raman spectroscopy to the characterization of parchment and vellum. II. Effect of biodeterioration and chemical deterioration on spectral interpretation. J. Raman Spectrosc. 35:754–760. [Google Scholar]
- 44.Leikin, S., V. A. Parsegian, W. H. Yang, and G. E. Walrafen. 1997. Raman spectral evidence for hydration forces between collagen triple helices. Proc. Natl. Acad. Sci. USA. 94:11312–11317. [DOI] [PMC free article] [PubMed] [Google Scholar]
- 45.Nimni, M. E., and R. D. Harkness. 1988. Molecular structure and function of collagen. In Collagen, Vol. 1: Biochemistry. M. E. Nimni, editor. CRC Press, Boca Raton, FL.
- 46.Ikoma, T., H. Kobayashi, J. Tanaka, D. Walsh, and S. Mann. 2003. Physical properties of type I collagen extracted from fish scales of Pagrus major and Oreochromis niloticas. Int. J. Biol. Macromol. 32:199–204. [DOI] [PubMed] [Google Scholar]
- 47.Susi, H., J. S. Ard, and R. J. Carroll. 1971. Infrared spectrum and water binding of collagen as a function of relative humidity. Biopolymers. 10:1597–1604. [DOI] [PubMed] [Google Scholar]
- 48.Lu, R., W. Gan, B. H. Wu, H. Chen, and H. F. Wang. 2004. Vibrational polarization spectroscopy of CH stretching modes of the methylene group at the vapor/liquid interfaces with sum frequency generation. J. Phys. Chem. B. 108:7297–7306. [Google Scholar]
- 49.Hirose, C., N. Akamatsu, and K. Domen. 1992. Formulas for the analysis of surface sum-frequency generation spectrum by CH stretching modes of methyl and methylene groups. J. Chem. Phys. 96:997–1004. [Google Scholar]
- 50.Hirose, C., H. Yamamoto, N. Akamatsu, and K. Domen. 1993. Orientation analysis by simulation of vibrational sum-frequency generation spectrum—CH stretching bands of the methyl-group. J. Phys. Chem. 97:10064–10069. [Google Scholar]
- 51.Wei, X., X. W. Zhuang, S. C. Hong, T. Goto, and Y. R. Shen. 1999. Sum-frequency vibrational spectroscopic study of a rubbed polymer surface. Phys. Rev. Lett. 82:4256–4259. [Google Scholar]
- 52.Follonier, S., W. J. W. Miller, N. L. Abbott, and A. Knoesen. 2003. Characterization of the molecular orientation of self-assembled monolayers of alkanethiols on obliquely deposited gold films by using infrared-visible sum-frequency spectroscopy. Langmuir. 19:10501–10509. [Google Scholar]
- 53.Mitchell, S. A., R. A. McAloney, D. Moffatt, N. Mora-Diez, and M. Z. Zgierski. 2005. Second-harmonic generation optical activity of a polypeptide α-helix at the air/water interface. J. Chem. Phys. 20:114707–114715. [DOI] [PubMed] [Google Scholar]
- 54.Orgel, J., T. C. Irving, A. Miller, and T. J. Wess. 2006. Microfibrillar structure of type I collagen in situ. Proc. Natl. Acad. Sci. USA. 103:9001–9005. [DOI] [PMC free article] [PubMed] [Google Scholar]