Abstract
We have developed methods for obtaining and characterizing three-dimensional maps of the reciprocal-space distribution of diffuse x-ray scattering from protein crystals, and have used the methods to study the nature of disorder in crystals of Staphylococcal nuclease. Experimentally obtained maps are 99.5% complete in the reciprocal-space resolution range of 10 Å–2.5 Å, show symmetry consistent with the P41 space group of the unit cell, and are highly reproducible. Quantitative comparisons of the data with three-dimensional simulations imply liquid-like motions of the protein [Caspar, D. L. D., Clarage, J., Salunke, D. M. & Clarage, M. (1988) Nature (London) 332, 659–662], with a correlation length of 10 Å and a root-mean-square displacement of 0.36 Å.
Keywords: protein dynamics, liquid-like motions
Biological macromolecules perform many important functions, including enzymatic catalysis, receptor recognition, and signal transduction. Physical measurements from a variety of sources suggest that a common feature in most biological processes is molecular flexibility and motion. In the solid state, this flexibility introduces crystalline disorder in the form of a collection of conformationally distinct states of the unit cell.
In x-ray crystallography, disorder, even in a good crystal that diffracts to high resolution, can cause x-rays to be scattered into angles that do not satisfy the Bragg condition (1–7). This “diffuse scattering” has been used to study the nature of disorder in protein crystals and has been shown to be a useful experimental technique for characterizing the fluctuations of crystalline proteins (8–16). A common feature of reported studies, however, is a limited sampling of reciprocal space from using, at most, a few x-ray exposures for analysis, and leaving most of the accessible data unrecorded. Although simulations have been successful in reproducing diffuse features observed in individual diffraction images, a full three-dimensional data set provides more independent measurements and could be used to test models that are more complex than those that already have been proposed.
We sought to obtain images of diffuse x-ray diffraction from Staphylococcal nuclease crystals at many different orientations with respect to the incident beam, and, for the first time, to reduce the data to measurements of diffuse intensity Id on a lattice identical to that on which the Bragg diffraction is represented [Kolatkar (17) has shown that this technique is feasible]. This representation of diffuse data, which we call a “diffuse map,” allows familiar techniques to be used to characterize the degree of internal symmetry in the data, to measure the difference between two diffuse data sets, and to refine models of protein motion.
MATERIALS AND METHODS
Data Collection.
Staphylococcal nuclease was chosen because of its high-symmetry unit-cell space group, the availability of high-resolution structures both with and without substrate analog bound (18–21), and our observation that the crystals withstood synchrotron radiation long enough to collect single-crystal, three-dimensional data sets at room temperature. The 149-residue extracellular protein is excreted by the bacterium Staphylococcus aureus, and cleaves nucleic acids in the growth medium by hydrolyzing P—O bonds. It has become a model system for studying protein folding, and its enzymatic properties have been described (22).
X-ray diffraction data were collected using two crystals of Staphylococcal nuclease grown over 23% 2-methyl-2,4-pentanediol (MPD), 10.5 μM potassium phosphate with 1.1 M equivalent thymidine-3′,5′-diphosphate (pdTp) and 2 M equivalent Ca++. Crystals had a tetragonal unit cell with space group P41. The first crystal measured 2.0 mm × 0.4 mm × 0.4 mm, with unit-cell parameters a = b = 48.5 Å, c = 63.4 Å, α = β = γ = 90°, and a mosaicity of 0.31°, as determined by the program denzo (Z. Otwinowski, University of Texas Southwestern Medical Center, Dallas, and W. Minor, Purdue University, West Lafayette, IN). The second crystal measured 2.2 mm × 0.4 mm × 0.4 mm, with unit-cell parameters a = b = 48.3 Å, c = 63.4 Å, α = β = γ = 90°, and a mosaicity of 0.26°. Crystals were mounted in glass capillaries, with the amount of buffer around the crystal kept to a minimum.
Data were collected at both the F1 and A1 stations at the Cornell High-Energy Synchrotron Source. A charge-coupled- device-based area x-ray detector [a successor to that described in Tate et al. (23)], with an 80-mm-diagonal square active area, and a fast readout time of 2 sec for a 1,024 × 1,024 image, was used to digitally record x-ray exposures. The beam was tuned to 0.91 Å, had a measured polarization of 0.8–0.93 perpendicular to the beam in the plane of the synchrotron ring, and was collimated to a 100 μm diameter.
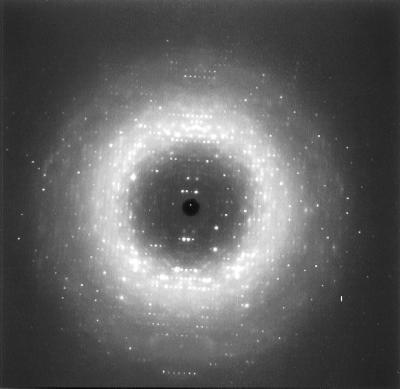
A sequence of still exposures (see Fig. 1) was used to obtain three-dimensional measurements of diffuse intensity (see Figs. 2 and 3). Stills were taken every one degree in spindle rotation, with interleaved one-degree oscillation exposures used to obtain a crystal orientation and Bragg peak measurements.
Figure 1.
Raw image of a room-temperature, 5-second still exposure (roughly 1.5 Å resolution at the edge). Note the structure in the diffuse scattering observable in the image. The distribution of diffuse features is consistent with the unit–cell space group P41. We wished to measure these features in the absence of the Bragg peaks.
Figure 2.
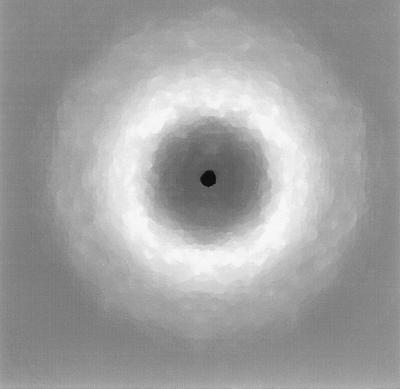
Diffraction image shown in Fig. 1 after polarization correction, solid angle normalization, and mode filtering to remove Bragg peaks.
Figure 3.
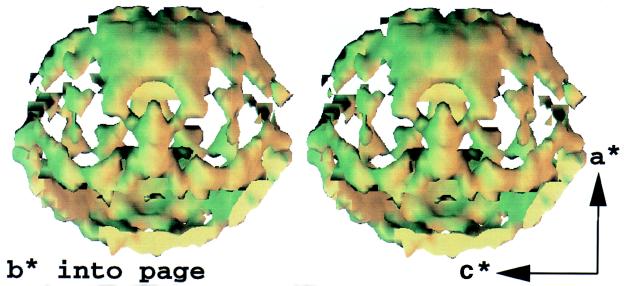
A stereo-pair interpolated isosurface in the three-dimensional map of diffuse x-ray scattering from Staphylococcal nuclease (arbitrary colors). Features in the surface illustrate variations of diffuse intensity in the neighborhood of 3.8 Å resolution, the location of the maximum in the “solvent ring.” Reciprocal axes a*, b*, and c* are shown (Offset) to orient the map. Room-temperature still exposures were recorded every degree to span 96° of crystal rotation, so that the map is missing two 84° opposing wedges. Symmetry averaging completes the map.
Image Processing.
Past studies of diffuse scattering have revealed features on length scales larger than the distance between Bragg peaks in reciprocal space (8–11, 13–16). These features are particularly interesting, because they correspond to motions correlated on length scales smaller than the unit cell. To simplify the measurements, therefore, a method was sought to eliminate Bragg peaks from diffraction images, isolating the diffuse features that potentially could be signatures of internal motions of the protein.
To remove Bragg peaks for accurate measurements of background intensity, a mode filter image processing technique was used. This filter has been successfully used by astronomers to “de-star” images when making measurements of background intensity in the night sky (24). The procedure involves evaluating the most common pixel value, called the “mode” of the distribution, in a small patch about each pixel in the source image, and placing value of the mode in the position of the source pixel in the target image. Selecting the most common pixel value yields the most probable value of the background, which is exactly the desired measurement.
A square patch that measured 15 pixels on a side (21 on the diagonal) was used to mode filter Staphylococcal nuclease diffraction images (see Fig. 2). This size was small enough to preserve diffuse features that were roughly the size of the Bragg-peak separation (at minimum, 10 pixels). The size was also larger than the peak profile, which ensured a low level of Bragg-peak contamination; average peak profiles from denzo had a width of one pixel, and information in Tate et al. (23) was used to show that tails in the detector response were below 0.1% at a distance of six pixels from the peak. In addition, studies using simulated diffraction patterns showed that the amount of Bragg-peak contamination in the mode-filtered images would be smaller than the photon noise of the background intensity in Staphylococcal nuclease diffraction images, making the technique suitable for these measurements.
After mode filtering, a transformation of the form I′ = 2Ipixel(1 + cos2 ψ − ɛ cos 2ρ sin2 ψ)−1 was applied to stills to correct for the polarization of the x-ray beam, where ɛ parameterizes the polarization of the beam, ψ is the angle between the incident and scattered x-ray beam, and ρ is the angle between the plane of the synchrotron ring and the vector in an image from the beam fiducial mark to the pixel. A transformation of the form I" = I′/cos3 ψ, where ψ is the angle between the incident and scattered x-ray beams, was applied to correct for the fact that, even though each pixel on the face of the detector has the same area, each subtends a different solid angle as seen from the specimen.
RESULTS
Using methods described in Wall (25), we directly used processed images to obtain three-dimensional maps Id(s) of diffuse intensity in the form of a three-dimensional lattice indexed by Miller indices (h, k, l); as a precaution against contamination, measurements in the immediate neighborhood of a Bragg peak were rejected. These diffuse maps are essentially lattices that describe the diffuse intensity in the neighborhood of the Bragg reflections. After symmetry averaging, a 99.5% complete sampling of diffuse intensity in the 10 Å–2.5 Å resolution range was achieved at a sampling frequency of one measurement per reciprocal unit cell.
Visualization.
Initial visualization of maps made use of the program explorer (Numerical Algorithms Group, Inc., Downers Grove, IL) to calculate surfaces of level diffuse intensity in the map. Views of the surfaces were generated at arbitrary orientations and selected interactively using a graphical interface. Such views revealed experimentally reproducible features whose distribution was consistent with the P41 space group of the unit cell (see Fig. 3).
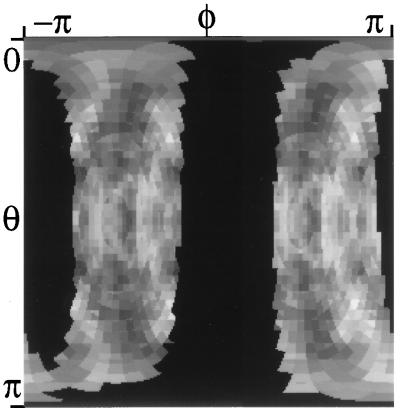
A different visualization method was developed to better compare diffuse maps. First, reciprocal space was sectioned into concentric spherical shells about the origin, each with a thickness of 0.033 Å−1, the length of the reciprocal-unit-cell diagonal. The diffuse intensity in each of these shells was then mapped to a Cartesian shell image in a manner similar to generating a Mercator projection of the earth’s surface (see Fig. 4). Such a representation has the advantage that the location of a diffuse feature can be determined by directly measuring its position on a shell image with a ruler, because the x- and y-coordinates are linearly derived from the azimuthal angle φ (longitude) and the polar angle θ (latitude).
Figure 4.
A shell image of diffuse features in an experimental map ΔId(s). To generate this image, diffuse intensity in a 0.033 Å−1 spherical shell about 3.8 Å is mapped to a Cartesian image in a manner similar to generating Mercator projections of the earth’s surface. The polar angle θ is measured from the c*-axis, and varies from 0 at the top to π at the bottom of the image. The azimuthal angle φ is measured from the a*-axis in a right-handed sense, and varies from −π (Left) to π (Right). Pixel values are displayed on a linear grey scale, with −300 corresponding to black, and 300 corresponding to white (missing data is colored black). A full three-dimensional sequence can be generated by subdividing reciprocal space into spherical shells and generating such an image for each of the shells.
Characterization.
Diffuse maps were characterized using the familiar crystallographic R-factor, defined as
 |
1 |
where X and Y are two maps being compared, and {s} spans the region of reciprocal space over which the comparison is to take place, and correlation coefficient C, defined as
 |
2 |
where X and Y are two maps being compared, and {s} spans the region of reciprocal space over which the comparison is to take place.
To eliminate the effects of scattering from disordered solvent, air, and other spherically symmetric sources, the spherically averaged component of intensity was subtracted from each intensity value in the diffuse map. Reciprocal space was sectioned into spherical shells, each with a thickness of 0.033 Å−1, and the average intensity was calculated in each of these resolution shells, producing a map Idsph(s) of the spherically averaged diffuse intensity. A residual map, ΔId(s) = Id(s) − Idsph(s), was calculated; this map was used to characterize the quality of the data and to evaluate the simulations.
To measure the degree of internal symmetry within a shell defined by an inner radius si and an outer radius so, a map ΔIdsym(s) was calculated by symmetry averaging ΔId(s) according to the predictions of the P41 space group of the unit cell:
 |
3 |
where n indexes the symmetry operators of the space group, and ΔId(n)(s) is the symmetry-related map for operator n. An Rsym and Csym were then found by calculating the R-factor and correlation coefficient between the original map and its symmetry-averaged counterpart in the range si < |s| < so. In the resolution range 10 Å–2.5 Å, Rsym = 23%, and Csym = 0.93. The highest degree of internal symmetry was observed in a 0.033 Å−1 wide resolution shell about 3.8 Å, where Rsym = 15%, and Csym = 0.97.
In a similar measurement, the difference between two maps obtained from different crystals was characterized. First, the spherically averaged component was subtracted from each of the maps, and then they were symmetry averaged. Finally, a scale factor was adjusted between the two to minimize the R-factor: a 22% R-factor was calculated in the resolution range 10 Å–2.5 Å. The correlation coefficient in the same resolution range was 0.93. The smallest difference between the maps was observed in a 0.033 Å−1 wide resolution shell about 3.8 Å, where the R-factor was only 14%, and the correlation coefficient was 0.97.
Analysis.
To interpret diffuse scattering measurements in terms of disorder in the crystal, simulated diffuse maps were generated to test their agreement with the experimental maps. By surveying a range of models of disorder, it was concluded that much could be learned initially by simply comparing the experimental maps with symmetry-averaged maps of the calculated squared structure factor Icalc(j)(s) = |f(j)(s)|2 of various structural subdomains j in the unit cell. The subdomains considered were the entire four-protein unit cell, a single protein molecule, the residue 42–53 high-B-factor flexible loop, the residue 7–15 high-B-factor tail, the residue 53–70 α-helical domain, the residue 92–113 β-barrel domain, and a predominantly β-sheet domain spanning residues 7–35 of the protein, ending at the active site.
Structure factor calculations were performed using the 2SNS atomic coordinates in the Brookhaven Protein Data Bank (latest revision in 1988 by M. J. Legg, F. A. Cotton, and E. E. Hazen, Jr.). Coordinates are given only for the first 141 residues, which are the only ones visible in electron-density maps. The position and orientation of the molecule in the unit cell were determined by using x-plor (26) to perform a rigid-body refinement of the structural model against Bragg peak measurements obtained from oscillation exposures. x-plor was used to calculate squared structure factors Icalc(j)(s) for each subdomain j, which were used in models of diffuse scattering to calculate the simulated map Isim(s); no temperature factors were used to calculate the squared structure factors Icalc(j)(s), making them distinct from the intensities usually calculated from the crystal structure. As described above, squared structure-factor maps were symmetry averaged to reflect the P41 space group of the unit cell, the spherical average was subtracted, and the resulting map ΔIcalcsym(s) was used to calculate the simulated map ΔIsimsym(s), which was compared to the data. Experimentally obtained diffuse maps Id(s) were also symmetry averaged and had the spherical average subtracted to generate a working map ΔIdsym(s).
A correlation coefficient was used to measure the difference between ΔIcalcsym(s) and ΔIdsym(s). Squared structure factors Icalc(s) were calculated for all of the subdomains listed above. Out of all of the calculated structure factors, however, only the map calculated from the entire unit cell showed agreement with the data, yielding a correlation coefficient of 0.42 in the 10 Å–2.5 Å resolution range, with a maximum of 0.55 in a 0.033 Å−1 wide resolution shell about 4.3 Å; for comparison, using the residue 7–35 domain of the protein, the correlation coefficient is only 0.10 in the 10 Å–2.5 Å resolution range.
Liquid-Like Motions.
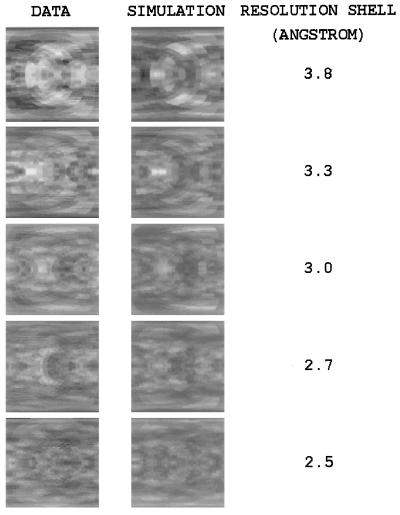
After the contributing structure was identified, various models of disorder were proposed to describe the observed diffuse scattering. The best quantitative fit of a simulated map with the data was found using the liquid-like motions model described in Clarage et al. (13) (see Fig. 5). This model describes a physical picture in which proteins soften to internal fluctuations, making the motions resemble those seen in a jiggling block of gelatin. In the case where the elastic properties of the crystal are isotropic and homogeneous, to first order, the liquid-like motions model predicts diffuse scattering of the form
 |
4 |
where σ2 is the variance of atomic displacements, I0(s) is the point-like intensity distribution for the unperturbed crystal, ∗ indicates a convolution, and the smoothing function Γγ(s) is the Fourier representation of the atomic displacement correlations. In the case of a macromolecular crystal with a soft unit cell, Wall (25) has shown that the crystalline normal modes model can predict the same functional behavior as the liquid-like motions model if one allows for frequency-dependent elasticities in the crystal. The liquid-like motions model can be generalized to the case of anisotropic elasticities, and the crystalline normal modes model can be generalized to the case of both inhomogeneous and anisotropic elasticities, though modeling becomes difficult under the most general circumstances.
Figure 5.
Data and the best-fit liquid-like motions model (γ = 10 Å, σ = 0.36 Å) are compared side by side in 0.033 Å−1 shells between 3.8 Å and 2.5 Å. Display parameters are the same as those in Fig. 4, except that the azimuthal angle φ varies from −π (Left) to only −π/2 (Right) (other portions are related by symmetry).
In Clarage et al. (13), correlations are assumed to decay exponentially with correlation length γ, yielding
 |
5 |
To find the best fit for the parameters σ and γ, simulated maps ΔIsimsym(s) were produced by calculating
 |
6 |
where Icalc(s) is the squared unit-cell structure factor calculated using residues 1–141 of the protein. A correlation coefficient C(ΔIsimsym, ΔIdsym) between the simulated and experimental diffuse maps was calculated in the 10 Å–2.5 Å resolution range for values of γ spanning (2 Å, 16 Å) in increments of 1 Å, and for values of σ spanning (0.02 Å, 0.50 Å) in increments of 0.02 Å. The highest correlation was for γ = 10 Å and σ = 0.36 Å, where C = 0.595 in the 10 Å–2.5 Å region of reciprocal space. The R-factor in the 10 Å–2.5 Å range was 41%.
Holding γ constant, C dropped by at least 0.01 when σ was increased to 0.50 Å or decreased to 0.26 Å. Holding σ constant, C dropped by at least 0.01 when γ was increased to 14 Å or decreased to 7 Å. The highest correlation was in a 0.033 Å−1 wide resolution shell about 3.8 Å, where C = 0.66, and the lowest R-factor was in a 0.033 Å−1 wide resolution shell about 6 Å, where R = 35%.
By modifying the factor e−(2πs)2σ2(2πs)2σ2, which modulates the diffuse intensity, further evidence was found that the diffuse intensity is not merely an artifact of the measurement process. Replacing this factor with e−(2πs)2σ2 simulates smoothed Bragg intensities—the most likely result of a bad measurement. When this model is substituted for the liquid-like motions model, however, the resolution dependence of the simulation no longer resembles that of the data, and the correlation coefficient drops from 0.595 to below 0.5.
Other Models.
The success of the liquid-like motions model in simulating the three-dimensional data provides strong evidence that this type of disorder exists in crystals of Staphylococcal nuclease. Other models were considered, however, including independent rigid-body motions [discussed in Wall (25)], which have successfully described atomic B-factors from lysozyme (27) and a handful of other proteins (28). One argument against rigid-body motions is that, to get good agreement with the data, it is necessary to eliminate the high-frequency components of the structure factor Icalcsym(s) by convolution with a smoothing function Γγ(s), where the best fit for the correlation length γ is smaller than the unit cell dimensions. This would not be the case for rigid-body motions. Independent rigid-body motions of Staphylococcal nuclease molecules would also give rise to features related to the squared structure factors of individual proteins, instead of the entire coherent assembly of proteins in the unit cell, providing further evidence against this model.
Another model considered was substitution disorder, where protein is occasionally replaced by solvent in the unit cell. Substitution disorder, however, like rigid-body motions, does not produce the observed low-pass filtered map of the squared unit-cell structure factor of the disordered structural domain. In addition, diffuse features caused by substitution disorder would only be related to the entire unit-cell structure factor if all proteins in the unit cell were simultaneously replaced by solvent. Atomic-force microscopy images of crystals of conavalin (29) reveal rare defects of this type, but they also indicate that the number of defects most likely would be too small to account for the observed magnitude of diffuse scattering. Finally, substitution disorder does not demand that diffuse features vanish as one approaches the origin, but this behavior is observed in diffuse scattering from Staphylococcal nuclease, providing further evidence against this model.
DISCUSSION
Three-dimensional maps of diffuse x-ray scattering from Staphylococcal nuclease show the rich patterns that lie beneath the Bragg peaks in macromolecular crystallography experiments. Our studies show that these maps can be obtained by methods similar to those used to obtain Bragg reflection measurements, and confirm that they are of high enough quality to reveal characteristics of the motions of the constituent proteins.
Diffuse data from Staphylococcal nuclease show that the liquid-like motions model is a reasonable approximation of the disorder in the crystal. In fact, it is remarkable that only two free parameters can be used to obtain a reasonable fit. That the final R-factor of 41% is higher than the 23% Rsym of the diffuse data, however, means that there is room for improvement.
Although isotropic, liquid-like motions are reasonable for Staphylococcal nuclease, other proteins are known to have internal dynamics of a different character. The disordered anti-codon loop domain, for instance, dominates the background intensity in images of x-ray diffraction from crystals of P6422 yeast-initiator tRNA (16), and strongly anisotropic streaking indicates lattice-coupled motions of the acceptor and anti-codon stems. Similar streaking has also been observed in images of x-ray diffraction from crystals of C2221 bovine brain calmodulin (M.E.W., J. B. Clarage, and G. N. Phillips, Jr., unpublished data) and P212121 hen egg-white lysozyme (9). Studies of lattice-coupled motions require the careful fitting of Bragg-peak profiles; so, in general, a combination of many different modeling and data-processing schemes will be necessary to understand protein dynamics through studies of diffuse scattering.
Clarage et al. (30) have shown that current molecular dynamics simulations do not produce accurate, reproducible diffuse-scattering calculations. Computational advances, however, may allow future studies of this type, and it would be interesting to see the results of the application of molecular dynamics methods to the analysis of three-dimensional diffuse scattering data.
Fauré et al. (15) have used protein normal-modes models to describe diffuse x-ray scattering from lysozyme crystals. In studies of BPTI, Ichiye and Karplus (31) have shown that protein normal-modes models can be used to explain a liquid-like motions correlation length. It would be very interesting to see whether the results of an independent normal-modes analysis of three-dimensional diffuse scattering were consistent with the observed 10 Å correlation length in Staphylococcal nuclease.
The parameter σ obtained from the diffuse scattering refinement should agree with the prediction from the overall temperature factor, B = 8π2σ2, of the structural model. Loll and Lattman’s (19) model of Staphylococcal nuclease complexed with pdTp, however, has a mean temperature factor of 26.2 Å2, corresponding to σ = 0.576 Å, compared with the 0.36 Å value for σ found in this study. The correlation coefficient calculated using γ = 10 Å and σ = 0.58 Å is 0.54, which is significantly lower than the best value of 0.60 obtained with σ = 0.36 Å. This discrepancy most likely indicates that something is going on in the crystal that is not described by the isotropic liquid-like motions model. If the model is right, however, the discrepancy suggests either: (i) a deficiency in the structural model, (ii) a systematic underestimate of diffuse intensity at high resolution, or (iii) a systematic underestimate of Bragg intensities at high resolution. The latter two would not affect Rsym, which is commonly used to characterize the quality of diffraction data, and so would be difficult to detect using common analysis methods.
Acknowledgments
We thank R. Walter, S. Barna, E. Eikenberry, D. Hajduk, Y. Han, F. Österberg, S. Erramilli, J. Shepherd, M. Tate, D. Thiel, P. Urayama, and the Cornell High-Energy Synchrotron Source (CHESS) staff for beamline support; T. Gamble, A. Kossiakoff, A. Gittis, E. Lattman, P. Loll, and D. Shortle for materials; J. Clarage for useful comments and criticism; J. Berendzen for suggesting the mode filter technique; and G. N. Phillips, Jr., and the Keck Center for Computational Biology. This work was supported in part by a MacCHESS resource National Institutes of Health grant, and the Keck Laboratory for Molecular Structure at Cornell University. M.W. acknowledges support from the National Institutes of Health, the Department of Energy, the Robert A. Welch foundation, and the National Science Foundation.
References
- 1.Debye P. Verh Dtsch Phys Ges. 1913;15:678. , 738, 857. [Google Scholar]
- 2.Faxén H. Z Phys. 1923;17:266–278. [Google Scholar]
- 3.Waller I. Ph.D. thesis. Uppsala, Sweden: Uppsala University; 1925. [Google Scholar]
- 4.Laval J. Bull Soc Franc Min. 1939;62:137–253. [Google Scholar]
- 5.Born M, Sarginson K. Proc R Soc London Ser A. 1941;179:69–93. [Google Scholar]
- 6.Lonsdale K, Smith H. Proc R Soc London Ser A. 1941;179:8–50. [Google Scholar]
- 7.Lonsdale K. Proc Phys Soc. 1942;54:314–353. [Google Scholar]
- 8.Phillips G N, Jr, Fillers J P, Cohen C. Biophys J. 1980;32:485–502. doi: 10.1016/S0006-3495(80)84985-X. [DOI] [PMC free article] [PubMed] [Google Scholar]
- 9.Doucet J, Benoit J P. Nature (London) 1987;325:643–646. doi: 10.1038/325643a0. [DOI] [PubMed] [Google Scholar]
- 10.Caspar D L D, Clarage J, Salunke D M, Clarage M. Nature (London) 1988;332:659–662. doi: 10.1038/332659a0. [DOI] [PubMed] [Google Scholar]
- 11.Glover I D, Harris G W, Helliwell J R, Moss D S. Acta Cryst. 1991;B47:960–968. [Google Scholar]
- 12.Caspar D L D, Badger J. Curr Opin Struct Biol. 1991;1:877–882. [Google Scholar]
- 13.Clarage J B, Clarage M S, Phillips W C, Sweet R M, Caspar D L D. Proteins. 1992;12:145–157. doi: 10.1002/prot.340120208. [DOI] [PubMed] [Google Scholar]
- 14.Chacko S, Phillips G N., Jr Biophys J. 1992;61:1256–1266. doi: 10.1016/S0006-3495(92)81934-3. [DOI] [PMC free article] [PubMed] [Google Scholar]
- 15.Fauré P, Micu A, Perahia D, Doucet J, Smith J C, Benoit J P. Struct Biol. 1994;1:124–128. doi: 10.1038/nsb0294-124. [DOI] [PubMed] [Google Scholar]
- 16.Kolatkar A R, Clarage J B, Phillips G N., Jr Acta Cryst. 1994;D50:210–218. doi: 10.1107/S0907444993011692. [DOI] [PubMed] [Google Scholar]
- 17.Kolatkar A R. Ph.D. thesis. Houston: Rice University; 1994. [Google Scholar]
- 18.Cotton F A, Hazen E E, Jr, Legg M J. Proc Natl Acad Sci USA. 1979;76:2551–2555. doi: 10.1073/pnas.76.6.2551. [DOI] [PMC free article] [PubMed] [Google Scholar]
- 19.Loll P A, Lattman E E. Proteins. 1989;5:183–201. doi: 10.1002/prot.340050302. [DOI] [PubMed] [Google Scholar]
- 20.Arnone A, Bier C J, Cotton F A, Day V W, Hazen E E, Jr, Richardson D C, Richardson J S. J Biol Chem. 1971;245:2302–2316. [PubMed] [Google Scholar]
- 21.Hynes T R, Fox R O. Proteins. 1991;10:92–105. doi: 10.1002/prot.340100203. [DOI] [PubMed] [Google Scholar]
- 22.Tucker P W, Hazen E E, Jr, Cotton F A. Mol Cell Biochem. 1978;22:67–77. doi: 10.1007/BF00496235. [DOI] [PubMed] [Google Scholar]
- 23.Tate M W, Eikenberry E F, Barna S L, Wall M E, Lowrance J L, Gruner S M. J Appl Cryst. 1995;28:196–205. [Google Scholar]
- 24.Stetson P B. User’s Manual for daophot ii: The Next Generation. Herzberg Institute of Astrophysics, Victoria, BC: Dominion Astrophysical Observatory; 1995. [Google Scholar]
- 25.Wall M E. Ph.D. thesis. Princeton, NJ: Princeton University; 1995. [Google Scholar]
- 26.Brünger A. x-plor, A System for X-Ray Crystallography. New Haven and London: Yale Univ. Press; 1987. , Version 3.1 edition. [Google Scholar]
- 27.Sternberg M J E, Grace D E P, Phillips D C. J Mol Biol. 1979;130:231–253. doi: 10.1016/0022-2836(79)90539-4. [DOI] [PubMed] [Google Scholar]
- 28.Kuriyan J, Weis W I. Proc Natl Acad Sci USA. 1991;88:2773–2777. doi: 10.1073/pnas.88.7.2773. [DOI] [PMC free article] [PubMed] [Google Scholar]
- 29.Land T A, Malkin A J, Kuznetsov Y G, McPherson A, De Yoreo J J. Phys Rev Lett. 1995;75:2774–2777. doi: 10.1103/PhysRevLett.75.2774. [DOI] [PubMed] [Google Scholar]
- 30.Clarage J B, Romo T, Andrews B K, Pettitt B M, Phillips G N., Jr Proc Natl Acad Sci USA. 1995;92:3288–3292. doi: 10.1073/pnas.92.8.3288. [DOI] [PMC free article] [PubMed] [Google Scholar]
- 31.Ichiye T, Karplus M. Proteins. 1991;11:205–217. doi: 10.1002/prot.340110305. [DOI] [PubMed] [Google Scholar]


