

Abstract
Microarray profiling of gene expression is a powerful tool for discovery, but the ability to manage and compare the resulting data can be problematic. Biological, experimental, and technical variations between studies of the same phenotype/phenomena create substantial differences in results. The application of conventional meta-analysis to raw microarray data is complicated by differences in the type of microarray used, gene nomenclatures, species, and analytical methods. An alternative approach to combining multiple microarray studies is to compare the published gene lists which result from the investigators’ analyses of the raw data, as implemented in Lists of Lists Annotated (LOLA: www.lola.gwu.edu) and L2L (depts.washington.edu/l2l/). The present review considers both the potential value and the limitations of databasing and enabling the comparison of results from different microarray studies. Further, a major impediment to cross-study comparisons is the absence of a standard for reporting microarray study results. We propose a reporting standard: standard microarray results template (SMART), which will facilitate the integration of microarray studies.
Keywords: meta-analysis, microarray, transcript profiling, expression profiling, bioinformatics, gene expression, gene annotation, aging
1. Introduction
Microarrays have become routine methods for profiling gene expression in almost every discipline of biomedical research. Genomic scale profiling of gene expression is a potentially valuable means of evaluating changes in, for example, stem cell differentiation (Ivanova et al., 2002; Ramalho-Santos et al., 2002; Fortunel et al., 2003), alcohol consumption (Mulligan et al., 2006), cardiovascular disease (McCaffrey et al., 2000; Gagarin et al., 2005), cancer (Bullinger et al., 2004; Valk et al., 2004), inflammation (Calvano et al., 2005), and aging (Lu et al., 2004). As the cost of microarray technologies decrease, it is possible that array-based methods of genomic-scale transcript profiling may become as commonplace as PCR-based methods are currently.
A hallmark of the scientific process is the reproducibility of published outcomes, and yet comparing the results of microarray studies has proven difficult. There are two general approaches to integrating microarray studies: comprehensive re-analysis of the primary data by merging data from multiple studies; or, comparative analysis of the published results (i.e. gene lists). Re-analysis of merged primary data sets has certain merits and complications that have recently been reviewed (Larsson et al., 2006). Of major concern to meta-analysis of raw data is that only about one-third of published studies have deposited meaningful raw data in public databases (Larsson and Sandberg, 2006). The present review focuses exclusively on comparing microarray results, an approach which may become increasingly useful as the sheer volume of microarray data expands, and which has the potential to make this mass of data accessible and comparable for the broad scientific community.
Ultimately, the quality of any meta-analysis depends on the quality of the underlying data. The accuracy and reproducibility of commonly-used microarray platforms has been hotly debated, with initial results ranging from relatively discouraging (Tan et al., 2003; Severgnini et al., 2006), to cautiously optimistic (Irizarry et al., 2005; Larkin et al., 2005). Recently, an exhaustive analysis of popular microarray platforms by a multi-center consortium, MAQC, delivered reassuringly impressive outcomes (Canales et al., 2006; Shi et al., 2006).) Nonetheless, all of these studies emphasize the necessity of careful control of biological samples and close adherence to standard protocols.
Beyond the limitations of the raw data, the process of comparing long lists of genes from microarray studies using different gene nomenclatures is often so tedious as to prevent effective comparisons. Not only are results reported using incompatible gene nomenclatures (i.e. Genbank, Locuslink, or Affymetrix gene identifiers), but often the lists of differentially expressed genes (DEGs) are published in graphic or tabular formats that are inaccessible by search engines. The analyzed results are rarely made available in any central database, such as GEO, even when the underlying raw data is deposited. Despite these obstacles, several groups have successfully gleaned important insights from the focused comparison of disparate microarray results. Careful meta-analysis of aging and cellular senescence microarray studies led to the intriguing observation that the expression pattern of cellular senescence was similar to that of aging in mice, but not in humans (Wennmalm et al., 2005), and a database of microarray studies in aging has been established (Pan et al., 2007). A cross-species analysis of expression changes in aging models identified a common transcriptional profile shared across phyla from yeast to humans (McCarroll et al., 2004). Likewise, data from a variety of laboratories was integrated to identify a common host transcriptional response to pathogens (Jenner and Young, 2005). A careful comparison of potential diagnostic genes for acute myeloid leukemia (AML) (Bullinger et al., 2004; Valk et al., 2004) reveals a much smaller set of robust candidate genes for further analysis (Cahan et al., 2005). There is substantial potential for novel discoveries that would emanate from comparing microarray studies, but doing so requires a concerted effort to identify and remove obstacles to the routine mass-comparison of microarray data.
In order to address these issues, two databases have emerged to house and integrate the results of microarray experiments: LOLA (Cahan et al., 2005) and L2L (Newman and Weiner, 2005). LOLA and L2L allow investigators to compare their data to published microarray data from different platforms, different nomenclatures, or even different species. The databasing of microarray gene lists allows for systematic comparison of the results of similar studies in order to identify consistent expression patterns, as well as helping experimenters to interpret new data by mining for these biologically significant patterns (Newman et al., 2006). While relatively comprehensive in certain areas, the hundreds of data sets included in LOLA and L2L are only a fraction of those potentially available. They are severely constrained in scope by the need to laboriously adapt inconsistently published data, and by the absence of a standard format for exchanging data between databases.
Although a rigorous standard for reporting raw microarray data, MIAME (Brazma et al., 2001), is in wide use by both journals and data repositories, no similar standard exists for reporting the results of microarray studies. To fill this need, we propose a standard microarray results template (SMART). SMART carries forward MIAME-compliant information, such as the platform, the number of specimens, amplification, genome definition, and experimental design. It then adds additional fields to describe the analytical methodologies and differentially expressed gene results. The purpose of SMART is to facilitate the exchange and comparison of microarray results. Importantly, however, SMART is readily amenable to the results of other genome-wide analyses, such as SAGE, microRNA, linkage and association, proteomic, and computational studies.
2. Comparing the results of microarray studies
The initial experience with comparing the results of similar microarray studies has suggested cautious optimism. There is typically substantial discordance in gene lists generated by apparently similar studies (Cahan et al., 2005). However, judiciously applied statistics will often show highly significant overlaps, even across species, as demonstrated by our meta-analyses of aging studies (Cahan et al., 2005; Newman and Weiner, 2005). Moreover, examining a large number of studies simultaneously can reveal significant overlaps within a topic such as the interferon response (Figure 1), even if it is difficult to identify a specific set of common genes. Three major sources of this superficial discordance are: 1) variation due to random noise, 2) biological and experimental differences, and 3) differences in technical methods. Many of these can be mitigated or overcome by the use of standard reporting methods, together with careful application of large-scale meta-analysis techniques.
Figure 1. Similarities between IFN-related gene lists in the L2L microarray database.
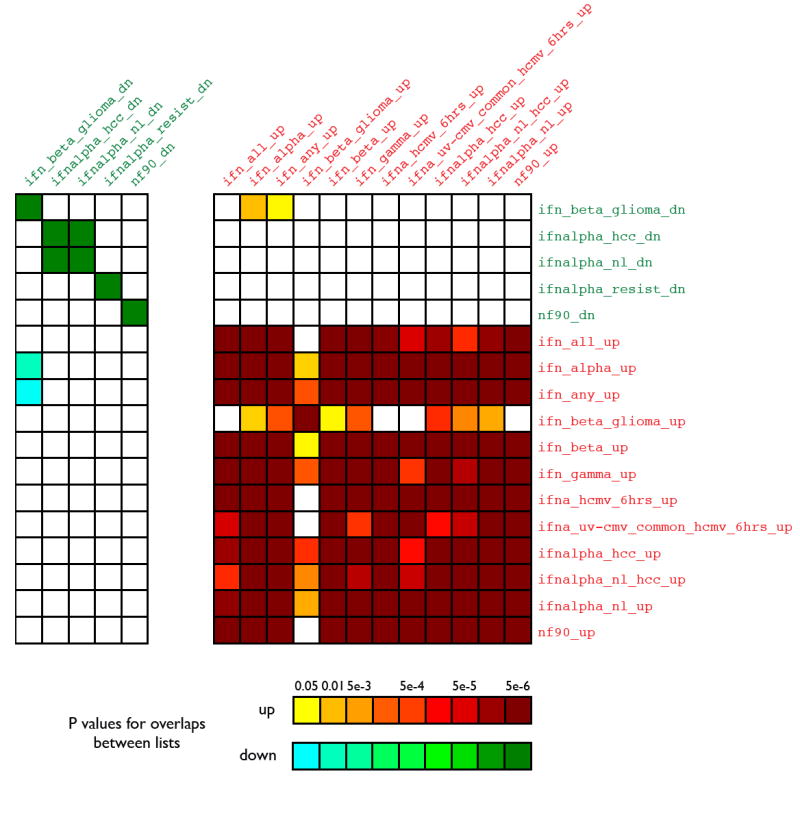
The L2L and LOLA databases include a number of gene lists derived from published studies that investigated the effects of interferons (IFN) on gene expression, using disparate source materials and methods. Each IFN-related list was compared to all others using the L2L program, in order to determine the degree and statistical significance of any overlap between these ostensibly related gene lists. The figure is symmetric across the diagonal axis. Red denotes lists with up-regulation by interferon. Green denotes lists with down-regulation by interferon. Names of gene lists are as they appear in the database. Analysis of the same lists in LOLA produced highly similar outcomes (r = 0.994).
2.1 Variation due to random noise
Potentially the biggest limitation to microarray studies is the reduction in power due to testing tens of thousands of hypotheses based on relatively small sample sizes. If one is willing to accept a false positive rate (α) of 0.05 in a microarray study evaluating 54,000 transcripts, then 2700 genes will be observed to change simply due to random fluctuations in expression levels. However, the potential benefit of meta-analysis is that by combining across different studies, the false positive genes will not replicate, while the ‘true’ genes should be observed in multiple studies.
2.2 Variation derived from biological and experimental variation
Undoubtedly, some variation in genes identified by different studies results from true biological variations in the samples which are analyzed. Even very similar studies employ different cell lines, tissues, or specimens, such as whole blood or purified mononuclear cells. Even ostensibly identical cell lines could be substantially influenced by experimental variations, such as culture in different media or serum, and at different densities, which might significantly affect the response to treatment. This results in changes in gene expression that are ‘true’ within their set of experimental conditions, but which do not reflect the variable under study and will not replicate in other studies using slightly different conditions. As with random noise, meta-analysis permits these changes to be ignored, and the focus to lie on the remaining ‘robust’ changes.
2.3 Variation derived from technical differences
The third major source of variation can be labeled as variation derived from technical methodology, summarized in Table 1.
Table 1.
Sources of variation in microarray analysis.
| Background Correction | Summarization Method | Normalization Method | Comparison Strategy | Nomenclature |
|---|---|---|---|---|
| Mismatch subtraction (Affx) | RMA | Median per chip | ANOVA | Entrez Gene |
| Spot perimeter subtraction | GC-RMA | quartile | FDR | Genbank |
| None (RMA) | Plier | ‘Housekeeping’ | SAM | LocusLink |
| MAS5 | per gene | fold-change | Unigene | |
| dChip | Cy3/Cy5 ratio | clustering | SwissProt | |
| t-test | Affymetrix ID |
2.3.1 Platforms
Several platforms for microarray analysis of gene expression are currently in use, and until recently, each was measuring unique subsets of the full genome. The different microarray platforms employed varied hybridization strategies: synthesized oligonucleotide microarrays, such as Affymetrix; spotted oligo arrays, such as Agilent; bead-based formats, such as Illumina; and custom spotted cDNA microarrays (Bammler et al., 2005). Only recently have some of these formats reached full-genome coverage, meaning that prior studies using different platforms would have necessarily produced different outcomes due to the different transcripts that were measured. Recent comprehensive examinations of intra- and inter-platform reliability and concordance suggest that technically the microarray has come of age, and typically shows about 80% concordance between any two major platforms when comparable methods were employed (Shi et al., 2006). Likewise, after direct comparison of Affymetrix and TIGR spotted arrays, Larkin concluded that “despite the common perception that gene expression (is) not reproducible across platforms, (their) analysis of cardiac gene expression yielded consistent results for greater than 90% of genes in common between the Affymetrix GeneChip and TIGR cDNA arrays” (Larkin et al., 2005).
2.3.2 Data transformations
Even within one experiment on a single platform, the method of analysis of the raw microarray data leads to major differences in the differentially expressed genes (DEGs). After raw fluorescence values are measured, the data is subjected to different levels of transformation that can be divided into: background or mismatch subtraction, probeset summarization (i.e. RMA, Plier, MAS5) which combines multiple measures of the same transcript, normalization of levels between arrays (per chip normalization), and normalization of transcript levels (per gene normalization). The impact of summarization and normalization strategies has been extensively evaluated in the MAQC project (Shippy et al., 2006), but an estimate of the impact is that two different summarizations of the same data may produce DEG lists that are only 30% concordant (Gagarin et al., 2005) – though among tens of thousands of total genes, such overlap is likely to be very highly significant.
2.3.3 Data analysis
After summarization/normalization, the data is analyzed by a variety of methods to identify DEGs. Early methods of detecting changes, such as fold-change between groups, have given way to statistically driven methods such as Significant Analysis of Microarrays (SAM) and Analysis of Variance (ANOVA). Minor changes in α, the p-value cutoff for statistical significance, have a major impact on the size of the list of differentially expressed genes detected (Figure 2), and much of the potential concordance between lists may lie just beneath α. Thus, the data processing steps have a major impact on the resulting changes that are detected, and are likely to be a major cause of apparent disparities between microarray studies. The impact of data analysis strategies was carefully considered in the MAQC analysis, and it suggests that identifying DEGs with fold-changes or ratios, in combination with p-values, increases the concordance between different platforms and laboratories (Shi et al., 2006).
Figure 2. The effect of analytical strategies on the number of differentially expressed genes.


LEFT: A set of microarray data (Affymetrix human U133A array, 22,283 genes total) from drug-treated vascular cells was analyzed by t-test at different p-value thresholds (α=.001, 0.005, 0.05, or 0.10, n=9 pairs) and the number of differentially expressed genes (DEGs) recorded (no correction for multiple testing). RIGHT: The same data was analyzed for DEGs by using a t-test (α=0.01) or a 2-fold change with different numbers of replicate pairs (1-9).
2.3.4 Gene nomenclature
Independent of the biological, technical, and analytical reasons that create variations between microarray studies, any two studies can be effectively impossible to compare because the results may be reported in different gene nomenclatures. Current microarray studies report results using Genbank, Locuslink, Entrez Gene (replacing Locuslink), EMBL, Unigene, RefSeq, and Affymetrix gene identifiers. Without software translation, such as provided by NIH-DAVID, GoMiner, Resourcerer, L2L or LOLA, it is extremely difficult to compare any two microarray studies for similarities in their gene lists. This ‘linguistic’ disparity has been a major impediment to accurate and high-volume comparison of microarray studies. Standard reporting of gene lists in the most low-level format possible, i.e. probe identifiers for a platform described in a data repository, would substantially ameliorate this problem.
2.3.5 Probe disparities
Even if exact translations between different nomenclatures can be achieved, there are material differences in how different platforms measure specific transcripts. Because of platform differences in the exact probe(s) used to interrogate a specific transcript, there will always be some degree of imprecision in translation between different platforms. Until all the relevant splice forms of transcripts are known, and sensitivity/specificity of the probes to different splice variants is quantified, there will be irresolvable disparities in the outcomes from any two platforms. While not debilitating, these disparities could have important impact on any attempt to conduct effective meta-analysis of microarray data by increasing the false negative rate. For instance, although some array platforms interrogate as many as 54,000 transcripts, the MAQC project could only successfully cross-reference 12,091 transcripts between all of the major platforms (Shi et al., 2006).
2.3.6 Species differences
Being able to compare the results of microarray studies between different species would be tremendously valuable in order to determine, for instance, whether a genetic change in a knockout mouse had a similar impact on gene expression as a human disease that it is meant to model. One method of comparison of microarray data between species is to utilize HomoloGene, as employed by LOLA and L2L. HomoloGene is a database which utilizes an automated system of detecting homologs among the annotated genes of several completely sequenced eukaryotic genomes (Wheeler et al., 2005), and thus is quite useful for translating microarray results between species.
2.3.7 Annotation and re-annotation
While peer-review and publication are absolutely essential aspects of disseminating microarray results, they create static ‘gene lists’ which are fixed in time with respect to the state of knowledge at the time of publication. To date, there are names, and putative functional information on only 30-50% of routinely measured transcripts—meaning that more than half of genes on ‘gene lists’ are currently uninterpretable, and often only accessible in Supplementary Data on the publisher’s or author’s website. By systematically databasing the results in a low-level probe ID format, it is possible to reinterpret microarray results in light of new gene annotations, thereby creating dynamic tools for further discovery.
2.3.8 Levels of concordance
The aforementioned problems associated with disparities in platform, nomenclature, and species emphasize the difficulties in determining ‘exact match’ identity in the results from 2 different studies. However, it is possible to take advantage of the fact that genes can be arranged into a hierarchical structure with varying degrees of relatedness. For instance, while one study might observe a change in TGF-ß1, and another in TGF-ß2, thus failing an identical match, a higher order concordance could observe a concordant change in ‘TGF-ß’ or ‘growth factor’. Previously established gene ontologies, such as KEGG (Ogata et al., 1999), provide exactly the type of hierarchical trees that can allow analytical software to identify concordant changes in predefined categories such as ‘interferon response’, ‘multidrug resistance’, or ‘pro-apoptotic’, thereby exposing potentially useful relationships. Interestingly, gene lists from different studies are amenable to hierarchical clustering methods which would allow the relatedness of multiple studies to be easily visualized.
3. Existing guidelines and databases for microarray studies
As a result of the large amount of data that has been generated from microarray experiments, there has been increasing awareness of the need for guidelines in reporting. To date, microarray data has been organized by the publication of guidelines for reporting the data, especially the Minimum Information About a Microarray Experiment (MIAME) guidelines (Brazma et al., 2003), and functionally by databases which act as repositories for microarray data, such as Gene Expression Omnibus (GEO) (Edgar et al., 2002) and ArrayExpress (Parkinson et al., 2006), or for SAGE data (i.e. CGAP Genie - cgap.nci.nih.gov). These major public repositories are critical in facilitating the storage and exchange of raw expression data. However, these standards and databases are focused on reporting raw microarray data and experimental features, and do not capture the key variables between the raw data and the reported results, such as DEGs; hence, a common format, Standard MicroArray Results Template (SMART), is being proposed as one implementation of MIAME, to facilitate the comparison of results.
3.1 MIAME
The Minimum Information About a Microarray Experiment (MIAME) standard functions as a guideline for researchers to report an adequate description of how microarray data was obtained. There are six essential elements to MIAME compliance (Brazma et al., 2001):
Experimental design: the set of hybridization experiments as a whole
Array design: type of array used and description of each element (spot, feature) on the array
Samples: samples used, extract preparation and labeling
Hybridizations: procedures and parameters
Measurements: images, quantification and specifications
Normalization controls: types, values and specifications
In addition, a controlled vocabulary – the MGED Ontology - has also been set forth by MIAME to allow precise and comparable descriptions of each element (Whetzel et al., 2006). By providing the information required by the MIAME standard, microarray data can be more easily interpreted by researchers (Brazma et al., 2001). However, MIAME was designed to specify details about the raw data. It provides for only an unstructured field for presenting microarray results, i.e. gene lists, with, as yet, no controlled format or language. Further, there is not yet a standardized set of requirements for describing the many variables that affect gene list composition (as outlined above), comparable to the MIAME requirement for raw data.
4. The SMART extension to MIAME
The Standard MicroArray Reporting Template (SMART) will greatly facilitate the research community by making microarray data 1) accessible, 2) comparable, and 3) dynamically updatable. The SMART format is based on MIAME concepts, but includes extensions that allow a gene list to be adequately recorded and described. The MGED (www.mged.org) developed a semantically consistent markup language for communicating MIAME data, called MAGE-ML (Ball and Brazma, 2006), which is based on the eXtensible Markup Language (XML). Simplistically, MAGE-ML, and more recently MAGE-TAB and tab2MAGE (Rayner et al., 2006), defines a set of consistent field identifiers that are relevant for microarray studies, thereby allowing different databases to exchange information with minimal reformatting. SMART carries forward any relevant MIAME data fields, such as experimental and array design, as described above. In addition, SMART defines several new fields to rigorously describe the analytical methods used to generate a gene list (as described in Table 1), the relationship between the gene list and the raw data from which it was derived, and the contents of the gene list itself (gene identifier, scale and direction of change values). Optional fields can denote follow-up confirmations that were conducted utilizing alternative laboratory procedures, such as Northern blot analysis, qRT-PCR or real-time PCR. An example of a SMART format, implemented in a variation of tab2MAGE (tab2mage.sourceforge.net/docs/spreadsheet.html), can be found in Supplementary Data and on both the L2L and LOLA websites.
The biological community has come very far in a very short time in adopting standards for reporting and archiving raw microarray data. Fortunately, SMART-compliance will not require an equivalent effort, but can be readily inserted into existing infrastructure and procedures. Most journals require that raw array data be uploaded into public repositories prior to publication, so it is logical to similarly require that any tables of genes presented in a manuscript, or supplemental data, be similarly deposited in SMART format. Any repository that accepts accessory files can readily accommodate a text-based SMART gene list in tab2MAGE/MAGE-TAB format. GEO, for example, permits the upload of accessory gene tables with arbitrary headers. Over the long-term, SMART could be easily incorporated into any software tool that accepts or outputs text-formatted data.
5. Conclusions
Microarray data is rapidly emerging from the shadows of being a “cautionary tale” (Sherlock, 2005), into a valuable technology with increasing reliability, reproducibility, and accuracy. To date, the quality of microarray data has often been limited by cost, sample size, inadequate analysis methods, and heterogeneous nomenclatures. As the quality of array platforms improve, prices fall, and experimental design and analytical methods standardize, microarrays will have a transforming effect on the way biomedical research is conducted. A key step in the maturity of the field will be fair, open, and accurate exchange and comparison of the results of the increasing number of microarray-based studies. The rapid adoption and implementation of reporting standards is critical to that transition, and to unlock valuable biological knowledge from this fast-growing universe of data.
Supplementary Material
Acknowledgments
TM gratefully acknowledges the support of an NIA MERIT Award (R37-AG12712) as well as funding from the St. Laurent Institute and The Catherine Birch McCormick Genomics Center. PC is funded by National Human Genome Research Institute (T32 HG000045). JCN is supported by the NIGMS Medical Scientist Training Program, and is grateful to Dr. Alan Weiner, Department of Biochemistry, University of Washington, for his invaluable support and encouragement.
Abbreviations
- AML
acute myeloid leukemia
- ApoD
apolipoprotein D
- DEGs
differentially expressed genes
- ESC
embryonic stem cells
- IFN
interferon
- LOLA
List of Lists Annotated
- MIAME
minimum information about a microarray experiment
- NPC
neural progenitor cells
- RPC
retinal progenitor cells
- SAGE
serial analysis of gene expression
- SMART
Standard MicroArray Reporting Template
Footnotes
Publisher's Disclaimer: This is a PDF file of an unedited manuscript that has been accepted for publication. As a service to our customers we are providing this early version of the manuscript. The manuscript will undergo copyediting, typesetting, and review of the resulting proof before it is published in its final citable form. Please note that during the production process errors may be discovered which could affect the content, and all legal disclaimers that apply to the journal pertain.
References
- Ball CA, Brazma A. MGED standards: work in progress. Omics. 2006;10(2):138–44. doi: 10.1089/omi.2006.10.138. [DOI] [PubMed] [Google Scholar]
- Bammler T, et al. Standardizing global gene expression analysis between laboratories and across platforms. Nat Methods. 2005;2(5):351–6. doi: 10.1038/nmeth754. [DOI] [PubMed] [Google Scholar]
- Brazma A, et al. Minimum information about a microarray experiment (MIAME)-toward standards for microarray data. Nat Genet. 2001;29(4):365–71. doi: 10.1038/ng1201-365. [DOI] [PubMed] [Google Scholar]
- Brazma A, Parkinson H, Sarkans U, Shojatalab M, Vilo J, Abeygunawardena N, Holloway E, Kapushesky M, Kemmeren P, Lara G, Oezcimen A, Rocca-Serra P, Sansone S. ArrayExpress—a public repository for microarray gene expression data at the EBI. Nucleic Acids Res. 2003;31:68–71. doi: 10.1093/nar/gkg091. [DOI] [PMC free article] [PubMed] [Google Scholar]
- Bullinger L, Dohner K, Bair E, Frohling S, Schlenk RF, Tibshirani R, Dohner H, Pllack JR. Use of gene-expression profiling to identify prognostic subclasses in adult acute myeloid leukemia. N Engl J Med. 2004;350(16):1605–16. doi: 10.1056/NEJMoa031046. [DOI] [PubMed] [Google Scholar]
- Cahan P, Ahmad A, Burke H, Fu S, Lai Y, Florea L, Dharker N, Kobrinski T, Kale P, McCaffre T. List of Lists-Annotated (LOLA): A database for annotation comparison of published microarray gene lists. Gene. 2005;360:78–82. doi: 10.1016/j.gene.2005.07.008. [DOI] [PubMed] [Google Scholar]
- Calvano SE, et al. A network-based analysis of systemic inflammation in humans. Nature. 2005;437(7061):1032–7. doi: 10.1038/nature03985. [DOI] [PubMed] [Google Scholar]
- Canales RD, et al. Evaluation of DNA microarray results with quantitative gene expression platforms. Nat Biotechnol. 2006;24(9):1115–22. doi: 10.1038/nbt1236. [DOI] [PubMed] [Google Scholar]
- Edgar R, Domrachev M, Lash AE. Gene Expression Omnibus: NCBI gene expression and hybridization array data repository. Nucleic Acids Res. 2002;30:207–210. doi: 10.1093/nar/30.1.207. [DOI] [PMC free article] [PubMed] [Google Scholar]
- Fortunel NO, Otu HH, Ng HH, Chen J. Comment on “ ‘Stemness’: Transcriptional Profiling of Embryonic and Adult Stem Cells” and “A Stem Cell Molecular Signature” (I) Science. 2003;302:393b. doi: 10.1126/science.1086384. [DOI] [PubMed] [Google Scholar]
- Gagarin D, Yang Z, Butler J, Wimmer M, Du B, Cahan P, McCaffrey T. Genomic profiling of acquired resistance to apoptosis in cells derived from human atherosclerotic lesions: Potential role of STATs, cyclin D1, BAD, Bcl-Xl, and caspase 1. J Mol Cell Cardiol. 2005;39:453–465. doi: 10.1016/j.yjmcc.2005.01.015. [DOI] [PubMed] [Google Scholar]
- Irizarry RA, et al. Multiple-laboratory comparison of microarray platforms. Nat Methods. 2005;2(5):345–50. doi: 10.1038/nmeth756. [DOI] [PubMed] [Google Scholar]
- Ivanova NB, Dimos JT, Schaniel C, Hackney JA, Moore KA, Lemischka IR. A stem cell molecular signature. Science. 2002;298(5593):601–4. doi: 10.1126/science.1073823. [DOI] [PubMed] [Google Scholar]
- Jenner RG, Young RA. Insights into host responses against pathogens from transcriptional profiling. Nat Rev Microbiol. 2005;3(4):281–94. doi: 10.1038/nrmicro1126. [DOI] [PubMed] [Google Scholar]
- Larkin JE, Frank BC, Gavras H, Sultana R, Quackenbush J. Independence and reproducibility across microarray platforms. Nat Methods. 2005;2(5):337–44. doi: 10.1038/nmeth757. [DOI] [PubMed] [Google Scholar]
- Larsson O, Sandberg R. Lack of correct data format and comparability limits future integrative microarray research. Nat Biotechnol. 2006;24(11):1322–3. doi: 10.1038/nbt1106-1322. [DOI] [PubMed] [Google Scholar]
- Larsson O, Wennmalm K, Sandberg R. Comparative microarray analysis. Omics. 2006;10(3):381–97. doi: 10.1089/omi.2006.10.381. [DOI] [PubMed] [Google Scholar]
- Lu T, Pan Y, Kao SY, Li C, Kohane I, Chan J, Yankner BA. Gene regulation and DNA damage in the ageing human brain. Nature. 2004;429(6994):883–91. doi: 10.1038/nature02661. [DOI] [PubMed] [Google Scholar]
- McCaffrey T, Fu C, Du B, Eksinar S, Kent K, Bush H, Kreiger K, Rosengart T, Cybulsky M, Silverman E, Collins T. High-level expression of Egr-1, and Egr-1 inducible genes, in mouse and human atherosclerosis. J Clin Invest. 2000;105(5):653–662. doi: 10.1172/JCI8592. [DOI] [PMC free article] [PubMed] [Google Scholar]
- McCarroll SA, Murphy CT, Zou S, Pletcher SD, Chin CS, Jan YN, Kenyon C, Bargmann CI, Li H. Comparing genomic expression patterns across species identifies shared transcriptional profile in aging. Nat Genet. 2004;36(2):197–204. doi: 10.1038/ng1291. [DOI] [PubMed] [Google Scholar]
- Mulligan MK, et al. Toward understanding the genetics of alcohol drinking through transcriptome meta-analysis. Proc Natl Acad Sci U S A. 2006;103(16):6368–73. doi: 10.1073/pnas.0510188103. [DOI] [PMC free article] [PubMed] [Google Scholar]
- Newman JC, Bailey AD, Weiner AM. Cockayne syndrome group B protein (CSB) plays a general role in chromatin maintenance and remodeling. Proc Natl Acad Sci U S A. 2006;103(25):9613–8. doi: 10.1073/pnas.0510909103. [DOI] [PMC free article] [PubMed] [Google Scholar]
- Newman JC, Weiner AM. L2L: a simple tool for discovering the hidden significance in microarray expression data. Genome Biol. 2005;6(9):R81. doi: 10.1186/gb-2005-6-9-r81. [DOI] [PMC free article] [PubMed] [Google Scholar]
- Ogata H, Goto S, Sato K, Fujibuchi W, Bono H, Kanehisa M. KEGG: Kyoto Encyclopedia of Genes and Genomes. Nucleic Acids Res. 1999;27(1):29–34. doi: 10.1093/nar/27.1.29. [DOI] [PMC free article] [PubMed] [Google Scholar]
- Pan F, Chiu CH, Pulapura S, Mehan MR, Nunez-Iglesias J, Zhang K, Kamath K, Waterman MS, Finch CE, Zhou XJ. Gene Aging Nexus: a web database and data mining platform for microarray data on aging. Nucleic Acids Res. 2007;35:D756–9. doi: 10.1093/nar/gkl798. [DOI] [PMC free article] [PubMed] [Google Scholar]
- Parkinson H, et al. ArrayExpress--a public database of microarray experiments and gene expression profiles. Nucleic Acids Res. 2006;35:D747–50. doi: 10.1093/nar/gkl995. [DOI] [PMC free article] [PubMed] [Google Scholar]
- Ramalho-Santos M, Yoon S, Matsuzaki Y, Mulligan RC, Melton DA. “Stemness”: transcriptional profiling of embryonic and adult stem cells. Science. 2002;298(5593):597–600. doi: 10.1126/science.1072530. [DOI] [PubMed] [Google Scholar]
- Rayner TF, et al. A simple spreadsheet-based, MIAME-supportive format for microarray data: MAGE-TAB. BMC Bioinformatics. 2006;7:489. doi: 10.1186/1471-2105-7-489. [DOI] [PMC free article] [PubMed] [Google Scholar]
- Severgnini M, Bicciato S, Mangano E, Scarlatti F, Mezzelani A, Mattioli M, Ghidoni R, Peano C, Bonnal R, Viti F, Milanesi L, De Bellis G, Battaglia C. Strategies for comparing gene expression profiles from different microarray platforms: application to a case-control experiment. Anal Biochem. 2006;353(1):43–56. doi: 10.1016/j.ab.2006.03.023. [DOI] [PubMed] [Google Scholar]
- Sherlock G. Of fish and chips. Nat Methods. 2005;2(5):329–30. doi: 10.1038/nmeth0505-329. [DOI] [PubMed] [Google Scholar]
- Shi L, et al. The MicroArray Quality Control (MAQC) project shows inter- and intraplatform reproducibility of gene expression measurements. Nat Biotechnol. 2006;24(9):1151–61. doi: 10.1038/nbt1239. [DOI] [PMC free article] [PubMed] [Google Scholar]
- Shippy R, et al. Using RNA sample titrations to assess microarray platform performance and normalization techniques. Nat Biotechnol. 2006;24(9):1123–31. doi: 10.1038/nbt1241. [DOI] [PMC free article] [PubMed] [Google Scholar]
- Tan PK, Downey TJ, Spitznagel EL, Jr, Xu P, Fu D, Dimitrov DS, Lempicki RA, Raaka BM, Cam MC. Evaluation of gene expression measurements from commercial microarray platforms. Nucleic Acids Res. 2003;31(19):5676–84. doi: 10.1093/nar/gkg763. [DOI] [PMC free article] [PubMed] [Google Scholar]
- Valk PJ, Verhaak RG, Beijen MA, Erpelinck CA, Barjesteh van Waalwijk van Doorn-Khosrovani S, Boer JM, Beverloo HB, Moorhouse MJ, van der Spek PJ, Lowenberg B, Delwel R. Prognostically useful gene-expression profiles in acute myeloid leukemia. N Engl J Med. 2004;350(16):1617–28. doi: 10.1056/NEJMoa040465. [DOI] [PubMed] [Google Scholar]
- Wennmalm K, Wahlestedt C, Larsson O. The expression signature of in vitro senescence resembles mouse but not human aging. Genome Biol. 2005;6:R109. doi: 10.1186/gb-2005-6-13-r109. [DOI] [PMC free article] [PubMed] [Google Scholar]
- Wheeler DL, et al. Database resources of the National Center for Biotechnology Information. Nucleic Acids Res. 2005;33:D39–45. doi: 10.1093/nar/gki062. [DOI] [PMC free article] [PubMed] [Google Scholar]
- Whetzel PL, Parkinson H, Causton HC, Fan L, Fostel J, Fragoso G, Game L, Heiskanen M, Morrison N, Rocca-Serra P, Sansone SA, Taylor C, White J, Stoeckert CJ., Jr The MGED Ontology: a resource for semantics-based description of microarray experiments. Bioinformatics. 2006;22(7):866–73. doi: 10.1093/bioinformatics/btl005. [DOI] [PubMed] [Google Scholar]
Associated Data
This section collects any data citations, data availability statements, or supplementary materials included in this article.