Abstract
The kinetics of DNA hairpin-loop fluctuations has been investigated by using a combination of fluorescence energy transfer and fluorescence correlation spectroscopy. We measure the chemical rates and the activation energies associated with the opening and the closing of the hairpin for different sizes and sequences of the loop and for various salt concentrations. The rate of unzipping of the hairpin stem is essentially independent of the characteristics of the loop, whereas the rate of closing varies greatly with the loop length and sequence. The closing rate scales with the loop length, with an exponent 2.6 ± 0.3. The closing rate is increased at higher salt concentrations. For hairpin closing, a loop of adenosine repeats leads to smaller rates and higher activation energies than a loop with thymine repeats.
Keywords: molecular beacons/fluorescence correlation spectroscopy/folding kinetics/polymer conformation/fluorescence energy transfer
DNA hairpin structures may participate in many biological functions, such as the regulation of gene expression (1), DNA recombination (2), and facilitation of mutagenic events (3). Hairpin-loops were proposed as antisense drugs with high resistance to degradation by exonucleases (4).
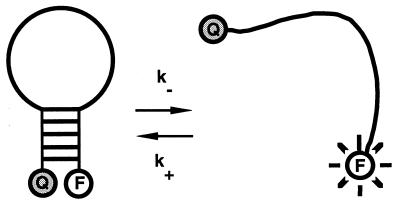
Hairpin structures are not static: they fluctuate between different conformations. In a simplified description, all of the conformations can be divided into two main states: the open state and the closed one (Fig. 1). The closed state is characterized by a low enthalpy due to base pairing in the stem region of the hairpin. The open state has a high entropy due to the large number of configurations achievable by a single-stranded DNA chain. The closed-to-open transition requires an energy fluctuation sufficiently large to unzip all of the base pairs, whereas the opposite (closing) transition involves the collision of the two arms of a hairpin, followed by the nucleation and the propagation of a base-paired stretch. One expects the rate of closing to depend strongly on the properties of the hairpin loop, such as length and rigidity, whereas one expects the rate of opening to be relatively unaffected by these properties.
Figure 1.
Sketch of the DNA molecular beacon. The five bases at the two ends of the beacon are complementary to each other. The size of the loop and its content are varied in our experiments. The beacon flips between open and closed states with the characteristic rates k− and k+. The fluorophore (F) and the quencher (Q) are covalently linked to the two arms of the beacon. In the open state the beacon fluoresces, in the closed state the fluorescence is quenched.
Most of the previous studies of hairpins deal with the structure of the folded state or with the thermodynamics of the folding–unfolding transitions (5–7). Knowledge about the kinetics of the hairpin transitions is limited to a few isolated measurements of the characteristic rates (8, 9). The dependence of closing and opening rates on such crucial parameters as the loop size, the loop sequence, and the salt concentration have not been reported, and the activation energies of the transitions are not known.
We present here measurements of the characteristic rates of closing and of opening for different lengths and sequences of the loop, done in a wide range of temperatures and salt concentrations. We find that the characteristics of the loop influence the closing rate much more strongly than the opening rate. The rate of closing decreases when the loop size increases. This dependence can be approximated by a scaling relationship with an exponent of 2.6 ± 0.3. The change of poly(T) sequence in the loop to poly(A) leads to a stunning 5-fold increase in the activation energy of closing, whereas the activation energy of opening is virtually unchanged. These results illuminate some of the properties characterizing single-stranded DNA as a random polymer coil: its persistence length and the probability of end-to-end collision.
We use an approach to study the kinetics of DNA transitions that combines recent advances in the development of fluorescent DNA probes (molecular beacons) (10) and fluorescence correlation spectroscopy (FCS) (11, 12). Molecular beacons are oligonucleotides capable of forming a hairpin loop with a fluorophore and a quencher attached to the two ends of the stem (Fig. 1). The conformational state of a beacon is directly reported by its fluorescence: in the closed state the hairpin brings together fluorophore and quencher, the molecule is not fluorescent; in the open state fluorophore and quencher are far apart, and the beacon is fluorescent. In equilibrium conditions, beacons fluctuate between the two states with the characteristic rates of opening k− and closing k+. We monitor these fluctuations by accumulating the autocorrelation function of the fluorescent light (FCS technique) (13). As compared with the conventional way of studying DNA transformation (temperature-jump combined with UV-absorption measurement) (8, 9, 14), this approach‡ is characterized by a high signal/background ratio (typically 50 for a beacon in a closed/open configuration), low sample concentrations (≈10 nM, to avoid duplex formation), and noninvasiveness: only equilibrium fluctuations are studied.
MATERIALS AND METHODS
Synthesis of the Molecular Beacons.
Our molecular beacons were derived from synthetic oligonucleotides. The starting material is the oligonucleotide modified at the 3′ end with a 4-{[4-(dimethylamino)phenyl]azo}benzoic acid (dabcyl) moiety, and a primary amino at the 5′ end (Midland Certified Reagent, Midland, TX). The fluorophore (6-carboxyrhodamine 6G; Molecular Probes) was coupled by reaction of its succinimidyl ester onto the primary amino group, and the product was purified by gel separation on a NAP5 Sephadex column (Pharmacia) and by reverse-phase chromatography (HPLC). 6-Carboxyrhodamine 6G was chosen because of its low triplet state formation rate (16). Dabcyl proved to be a good quencher to this fluorophore.
The sequences of the DNA hairpin-loop under study were 5′-CCCAA-(N)n-TTGGG-3′ with the varying loop (N)n being alternatively (T)12, (T)16, (T)21, (T)30, or (A)21.
Fluorescence Bulk Measurements.
The quality of the product was tested by measuring a melting curve of the molecular beacon on a steady-state fluorometer. The fluorescence of a 20 nM solution of molecular beacon in buffer was collected at temperatures varying from 10°C to 80°C. Typically, the buffer contained 0.1 M NaCl, 50 μM EDTA, and 5 mM cacodylic acid, pH 7.0. For the measurements of the kinetics at different salt concentrations, the amount of NaCl in the buffer was varied accordingly.
The fraction p of open beacons can be assessed directly by monitoring the fluorescence I as a function of the temperature T: p(T) = [I(T) − Ic]/(Io − Ic), where Io is the fluorescence of the open beacons and Ic is the fluorescence of the closed beacons. We evaluated Io as the fluorescence at 80°C, and Ic was obtained through the fit of the low-temperature portion of the melting curve with I(T) = Ic + aexp(−b/T). The signal/background defined as the ratio Io/Ic is typically 50. The equilibrium constant K(T) = p(T)/[1 − p(T)] gives the ratio of the chemical rates of opening and closing of the secondary structure:
 |
1 |
FCS Setup.
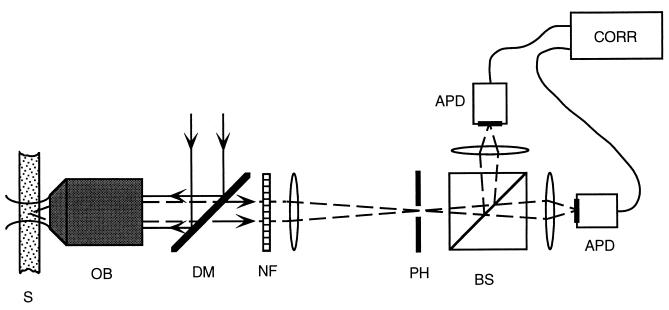
FCS measurements were conducted on a setup built in our laboratory (Fig. 2), similar to that developed by Rigler et al. (17). The confocal type of illumination and light collection is used to minimize the number of fluorescent objects, and therefore maximize the fluorescence fluctuations. The excitation light (the 514.5-nm line of an argon laser) is focused onto the sample with the objective lens (Olympus 60×, numerical aperture 1.2, water immersion), and the emitted light is collected through the same objective. The excitation light is rejected while passing through the high-pass dichroic mirror (Omega Optical, Brattleboro, VT) and a notch filter (Kaiser Optical Systems, Ann Arbor, MI). The emitted light is then focused onto a 25-μm-diameter pinhole. To reduce the artifacts introduced by the after-pulsing of the detectors, the beam is divided in two by a beamsplitter cube and focused onto two Avalanche photocounting modules (EG & G Optoelectronics, Vaudreuil, QC). The signals from these two detectors are fed into a correlator (ALV, Langen/Hessen, Germany), and the cross-correlation of the emitted light is collected. The excitation power is kept low at 25 μW (25 kW/cm2) to avoid photobleaching and triplet formation; we collect typically 30,000 counts per second per fluorophore. The typical concentration of beacons in the sample is 10 nM—i.e., there are on average five molecules in the sampling volume of about 1 fl. Our usual accumulation time is of the order of 10 min.
Figure 2.
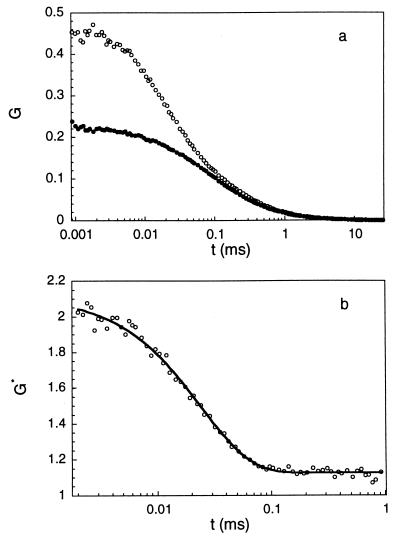
Schematic drawing of the experimental setup (see text). S, sample; OB, objective lens; DM, dichroic mirror; NF, notch filter; PH, pinhole; BS, beamsplitter; APD, Avalanche photocounting detector; CORR, correlator. Fig. 3. Example of the experimental procedure. (a) Autocorrelation curves for beacon (open circles) and control (closed circles) at T = 45°C, 0.2 M NaCl. Both beacon and control have loops of 21 T residues. (b) Ratio of the two curves shown in a. The line is a three-parameter exponential fit to the data (see text) giving τreaction = 24.2 ± 0.6 μs.
RESULTS
Outline of the Experimental Procedure.
The autocorrelation function reflects any process leading to the fluctuations of the emitted fluorescence. For the molecular beacons, the main sources of the fluctuations in fluorescence are the diffusion of molecules in and out of the sampling volume and the opening and the closing of the secondary structure. To extract the kinetic rates of the opening and the closing, three independent measurements needed to be performed:
(i) Measurements of the autocorrelation function of the molecular beacons Gbeacon, which has both the diffusion and the chemical kinetics contributions.
(ii) Measurements of the autocorrelation function Gcontrol from a specially designed control sample, for which the correlation function consists of the diffusion contribution only. The ratio Gbeacon(t)/Gcontrol(t) (see text below) isolates the chemical kinetics part and gives the sum of the kinetic rates k− + k+.
(iii) Measurements of the bulk fluorescence give the equilibrium constant K = k−/k+ (see Materials and Methods). Thus, k− and k+ can be determined separately.
Data Treatment.
The theoretically predicted Gbeacon(t) is a product of a diffusion term and a chemical reaction term (11, 18):
 |
2 |
where N is the average number of molecular beacons in the sampling volume, τdiff is a diffusion time across the illuminated region, p is the fraction of open beacons, and τreaction is the chemical reaction timescale:
 |
3 |
For our experimental situation, τdiff (≈150 μs) falls in the range of τreaction (between 5 μs and 1 ms), which makes a direct fit of experimental data with Eq. 2 unreliable. To extract τreaction, we designed control samples similar to the beacons with a fluorophore but no quencher. For the control, the autocorrelation function consists of the diffusion contribution only:
 |
The ratio G*(t) = Gbeacon(t)/Gcontrol(t) isolates the chemical reaction kinetics (Fig. 3). Practically, we fit this ratio by a three-parameter exponential G*(t) = A + B exp(−t/τreaction). The coefficients A and B differ from the coefficients in Eq. 2, which does not take into account the residual fluorescence of the beacons in the closed state. All of our measured G*(t) can be fitted very well with a single exponential over a wide interval of lag times, typically from 1 μs to 1 ms (Fig. 3b). This result confirms the model of an all-or-none transition (ref. 19 and references therein) between the open and the closed states.§
Figure 3.
Example of the experimental procedure. (a) Autocorrelation curves for beacon (○) and control (•) at T = 45°C, 0.2 M NaCl. Both beacon and control have loops of 21 T residue. (b) Ratio of the two curves shown in a. The line is a three-parameter exponential fit to the data (see text) giving τreaction = 24.2 ± 0.6 μs.
To extract k+ and k− from τreaction we supplement the FCS experiments with a fluorescence bulk measurement, which gives K(t) (see Materials and Methods). From Eqs. 1 and 3 we get:
 |
4 |
The experiments were carried out in the range of temperatures T from 10 to 50°C. We present data as Arrhenius plots for the chemical rates as a function of 1/T. We measure the activation energy Ea by fitting the experimental points with an exponential k(T) = k∞ exp(−Ea/RT).
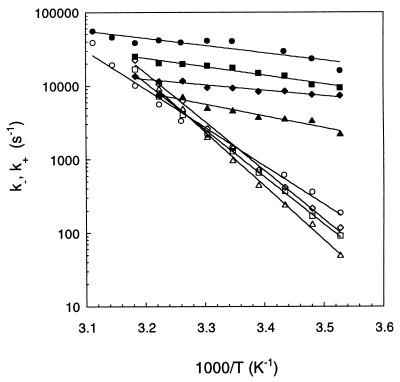
Typically—e.g., for a beacon of 21 T residues in the loop—τreaction passes from 134 μs at 10°C to 28 μs at 45°C, while the equilibrium constant K(T) of open–closed transition is changing from 0.016 to 1.5. This leads to k− spanning the range from 1.2 × 10² s−1 to 2.2 × 10⁴ s−1 and k+ from 7.4 × 10³ s−1 to 1.4 × 10⁴ s−1 (Fig. 4, diamonds). Note that for (T)21 most of the measurements are performed below the melting temperature of the secondary structure [K(T) ≤ 1]. In this temperature range k+ is mostly determined by τreaction (see Eq. 4) such that it varies by a factor of 2 only. On the other hand, the variation of k− is dominated by the temperature dependence of K, k− varying by two orders of magnitude. For the closing of this beacon the activation energy is +3.4 kcal/mol, whereas the activation energy for the opening is +32 kcal/mol (1 kcal = 4.18 kJ).
Figure 4.
Arrhenius plots of the opening rates (open symbols) and the closing rates (filled symbols) of beacons with different loop lengths: (T)12 (circles), (T)16 (squares), (T)21 (diamonds), and (T)30 (triangles). The lines are exponential fits to the data. The lines corresponding to opening and closing intersect at the melting temperature. The buffer contained 0.1 M NaCl for all the data.
Dependence of the Chemical Rates on Loop Length, Loop Sequence, and Salt Concentration.
In Fig. 4 we compare the Arrhenius plots of the extracted rates for the beacons with different loop sizes: the rates for opening k− are similar for different Nloop, whereas the rates of closing k+ decrease significantly with the loop size.
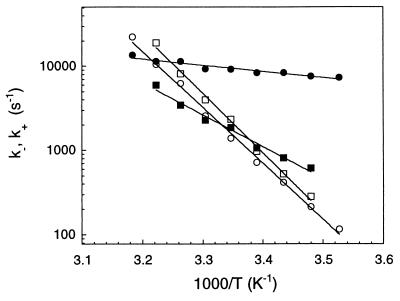
In Fig. 5 we present k− and k+ for two beacons differing in their loop sequence, (T)21 for the first and (A)21 for the second. Once again we observe that k− is affected only weakly, whereas k+ is remarkably different for these two sequences. The activation energy for closing the beacon of loop (T)21 is +3.4 kcal/mol, whereas for the beacon of loop (A)21 the barrier is +17.4 kcal/mol. It is striking that two beacons with identical stems and identical loop length are so different when the loop of 21 T residues is replaced by the loop of 21 A residues. This effect leads to the large difference of melting temperatures for these two beacons: 38°C for the loop of (T)21 and 23°C for the loop of (A)21.
Figure 5.
Comparison of the opening rates (open symbols) and the closing rates (filled symbols) for the beacons with loops of equal length but differing in content: (T)21 (circles) and (A)21 (squares). The lines are exponential fits to the data. The buffer contained 0.1 M NaCl for all the data.
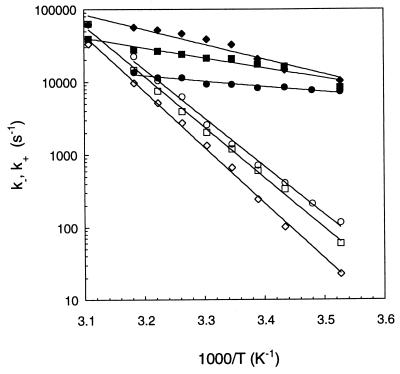
Finally, we compare the kinetics of hairpin fluctuations for different concentrations of monovalent ions (Fig. 6). The activation energy for the closing of the beacon increases strongly with the salt concentration: +3.4 kcal/mol for [Na+] = 0.1 M, +6.6 kcal/mol for [Na+] = 0.2 M, and +9.0 kcal/mol for [Na+] = 0.5 M. The barrier for the opening of the beacon stays approximately the same for all the salt concentrations used.
Figure 6.
Arrhenius plots of the opening rates (open symbols) and the closing rates (full symbols) of beacons with the 21 A loop at different salt concentrations: 0.1 M NaCl (circles), 0.2 M NaCl (squares), and 0.5 M NaCl (diamonds). The lines are exponential fits to the data.
DISCUSSION
The bulk of our results is consistent with the picture whereby the limiting step for the hairpin opening is the unzipping of the five base pairs of the stem, whereas the closing involves a search for the configuration that brings the two ends together among all the possible configurations of a randomly coiled beacon. The longer and the more rigid the loop is, the smaller the closing rate is, whereas the opening rate is relatively unaffected. The rigidity of the loop is increased through the substitution of Ts for As. This may be because of the larger size of As compared with Ts and the increased interaction of As in stacking. The addition of salt decreases k− and increases k+, because of the screening of the electrostatic charges associated with the bases, resulting in the stabilization of the base pairs and the “softening” of the loop. The increase with salt of the activation energy for closing is surprising: one would expect that the same screening of the electrostatic charges would reduce the barrier for forming base pairs.
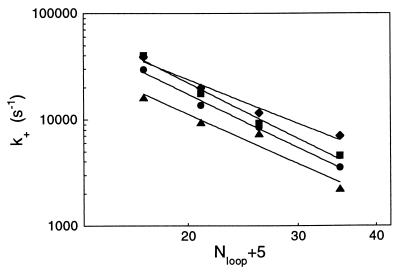
The closing rate is related to the probability of end-to-end collision for the DNA strand. It is expected to scale with the loop size (20, 21). Assuming that the collision of any of the five base pairs at the ends of the hairpin can lead to the hairpin closure, we express k+ as a function of Nloop + 5 (the number of bases between the midpoints of the stem). Fitting our data with k+ ∝ (Nloop + 5)−α gives exponents α between 2.3 and 2.9 (Fig. 7). The exponents at low temperatures tend to be larger then those at higher temperatures (above 30°C). These values are to be compared with the theoretical predictions made for a number of similar problems (DNA cyclization, intrachain reactions, etc.) (20–22). Our exponents are close to, although consistently larger than, the values calculated by Wilemski and Fixman (21) and obtained in simulations by Podtelezhnikov and Vologodskii (22): α = 2.2. The discrepancy can result from the large excluded volume effects, which is the picture supported by the simulations (22).
Figure 7.
Scaling relationship for the closing rate of the hairpin as a function of the characteristic length of the hairpin (Nloop + 5), at different temperatures: 10.4°C (triangle), 18.0°C (circle), 25.7°C (square), and 33.3°C (diamonds). The lines are power fits to the data. The exponents are respectively 2.67, 2.87, 3.00, and 2.35.
In conclusion, we report measurements of the kinetics of thermal fluctuations of a DNA hairpin-loop for various loop sequences and lengths. The rate associated with the closing of the secondary structure scales with the loop size with an exponent of 2.6 ± 0.3. The strikingly different closing rates for a loop made of T residues or of A residues suggest a strong sequence dependence for the rigidity of a single-stranded stretch of DNA. The activation barrier for the hairpin closing increases with higher salt concentration, an effect to be further investigated.
This technique combining fluorescence correlation spectroscopy under confocal configuration and fluorescence energy transfer can be extended to other biomolecules. For any study of conformation dynamics, it may allow measurements at essentially single molecule level and down to 100-ns resolution.
Acknowledgments
We thank Hervé Isambert, David Mauzerall, Sanjay Tyagi, and Alex Vologodskii for helpful discussions. This work was supported by the Mathers Foundation and by National Science Foundation Grant PHY-9408905. O.K. acknowledges support from a Rueff–Wormser Fellowship and the Burroughs Wellcome Fund.
ABBREVIATION
- FCS
fluorescence correlation spectroscopy
Footnotes
A similar approach has been applied by Wennmalm et al. (15) to study the conformational fluctuations of an M13 DNA, taking advantage of the quenching capabilities of the guanine base. In our system, however, the quencher is more efficient than guanine, giving better signal/background ratio.
At very short lag times (below 1 μs), G*(t) indicates another kinetic process, possibly related to transitions in the stacking of DNA bases (8, 14). In this range of lag times correlation functions are too noisy to extract reliable rates, and we do not consider this fast kinetics further in this paper.
References
- 1.Zazopoulos E, Lalli E, Stocco D M, Sassone-Corsi P. Nature (London) 1997;390:311–315. doi: 10.1038/36899. [DOI] [PubMed] [Google Scholar]
- 2.Froelich-Ammon S J, Gale K C, Osheroff N. J Biol Chem. 1994;269:7719–7725. [PubMed] [Google Scholar]
- 3.Trinh T Q, Sinden R R. Genetics. 1993;134:409–422. doi: 10.1093/genetics/134.2.409. [DOI] [PMC free article] [PubMed] [Google Scholar]
- 4.Tang J, Temsamani J, Agrawal S. Nucleic Acids Res. 1993;21:2729–2735. doi: 10.1093/nar/21.11.2729. [DOI] [PMC free article] [PubMed] [Google Scholar]
- 5.Senior M M, Jones R A, Breslauer K J. Proc Natl Acad Sci USA. 1988;85:6242–6246. doi: 10.1073/pnas.85.17.6242. [DOI] [PMC free article] [PubMed] [Google Scholar]
- 6.James J K, Tinoco I., Jr Nucleic Acids Res. 1993;21:3287–3293. doi: 10.1093/nar/21.14.3287. [DOI] [PMC free article] [PubMed] [Google Scholar]
- 7.Bloomers M J J, van de Ven F J M, van der Marel G A, van Boom J H, Hilbers C W. Eur J Biochem. 1991;201:33–51. doi: 10.1111/j.1432-1033.1991.tb16253.x. [DOI] [PubMed] [Google Scholar]
- 8.Gralla J, Crothers D M. J Mol Biol. 1971;73:497–511. doi: 10.1016/0022-2836(73)90096-x. [DOI] [PubMed] [Google Scholar]
- 9.Hilbers C W, Haasnoot C A, de Bruin S H, Jorden J J, van der Marel G A, van Boom J H. Biochimie. 1985;67:685–695. doi: 10.1016/s0300-9084(85)80156-5. [DOI] [PubMed] [Google Scholar]
- 10.Tyagi S, Kramer F R. Nature Biotechnology. 1996;14:303–308. doi: 10.1038/nbt0396-303. [DOI] [PubMed] [Google Scholar]
- 11.Mairi S, Haupts U, Webb W W. Proc Natl Acad Sci USA. 1997;94:11753–11757. doi: 10.1073/pnas.94.22.11753. [DOI] [PMC free article] [PubMed] [Google Scholar]
- 12.Rigler R, Mets Ü, Widengren J, Kask P. Eur Biophys J. 1993;22:169–175. [Google Scholar]
- 13.Magde D, Elson E, Webb W W. Phys Rev Lett. 1972;29:705–708. [Google Scholar]
- 14.Dewey T G, Turner D H. Biochemistry. 1979;18:5757–5762. doi: 10.1021/bi00593a002. [DOI] [PubMed] [Google Scholar]
- 15.Wennmalm S, Edman L, Rigler R. Proc Natl Acad Sci USA. 1997;94:10641–10646. doi: 10.1073/pnas.94.20.10641. [DOI] [PMC free article] [PubMed] [Google Scholar]
- 16.Widengren J, Mets Ü, Rigler R. J Phys Chem. 1995;99:13368–13379. [Google Scholar]
- 17.Rigler R, Mets Ü, Widengren J, Kask P. Eur Biophys J. 1993;22:169–175. [Google Scholar]
- 18.Berne B J, Pecora R. Dynamic Light Scattering. New York: Wiley; 1976. [Google Scholar]
- 19.Cantor C R, Schimmel P R. Biophysical Chemistry: The Behavior of Biological Macromolecules. San Francisco: Freeman; 1980. , Part 3. [Google Scholar]
- 20.Berg O. Biopolymers. 1984;23:1869–1889. doi: 10.1002/bip.360231005. [DOI] [PubMed] [Google Scholar]
- 21.Wilemski G, Fixman M. J Chem Phys. 1974;60:866–877. [Google Scholar]
- 22.Podtelezhnikov A, Vologodskii A. Macromolecules. 1997;30:6668–6673. [Google Scholar]


