

Abstract
Micro RNAs (miRNAs) regulate gene expression at the posttranscriptional level. Here we show that regulatory T (T reg) cells have a miRNA profile distinct from conventional CD4 T cells. A partial T reg cell–like miRNA profile is conferred by the enforced expression of Foxp3 and, surprisingly, by the activation of conventional CD4 T cells. Depleting miRNAs by eliminating Dicer, the RNAse III enzyme that generates functional miRNAs, reduces T reg cell numbers and results in immune pathology. Dicer facilitates, in a cell-autonomous fashion, the development of T reg cells in the thymus and the efficient induction of Foxp3 by transforming growth factor β. These results suggest that T reg cell development involves Dicer-generated RNAs.
Specialized cell types in multicellular organisms are defined by specific patterns of gene expression (1). In addition to the transcriptional regulation of protein-coding genes, posttranscriptional regulation is emerging as an important mechanism for the control of gene expression. In particular, the noncoding transcripts of several hundred micro RNA (miRNA) genes affect the translation and/or the stability of protein-coding transcripts (2). Long primary miRNAs are processed into hairpins of 60–70 nucleotides in length by a complex containing the nuclear RNase III enzyme Drosha and DGCR8 (DiGeorge syndrome critical region 8 homologue; references 3 and 4). These pre-miRNAs are exported to the cytoplasm and further processed into mature, double-stranded miRNAs of ∼22 nucleotides in length by a complex containing the RNase III enzyme Dicer and TRBP (human immunodeficiency virus 1–transactivating response RNA-binding protein; reference 5). After their unwinding, one of the miRNA strands remains associated with the RNA-induced silencing complex, which controls mRNA translation and/or the degradation based on sequence complementarity between RNA-induced silencing–associated miRNAs and the 3′ untranslated region (UTR) of target mRNAs (2). There are several hundred known miRNAs, each of which potentially targets multiple transcripts. Therefore, it is likely that a substantial proportion of protein-coding transcripts is subject to miRNA regulation (6–8). miRNAs are expressed in a cell type– and developmental stage–specific fashion with distinct patterns in embryonic stem cells/early embryos and committed lineages (2). The miRNA-generating enzyme Dicer is required for embryonic development (9, 10), and Dicer-deficient embryonic stem cells fail to differentiate in vitro or to contribute to embryonic development in vivo (11).
A role for miRNAs in hematopoiesis had been predicted based on recurrent breakpoints in leukemias at chromosomal locations that encode miRNAs (12) and a causal link between miRNA expression and leukemia has recently been demonstrated (13). Surveys of miRNA expression in hematopoiesis have shown lineage and developmental stage-specific patterns (14, 15), and the overexpression of one miRNA, miR-181, in hematopoietic precursor cells can bias lymphoid differentiation toward the B cell lineage at the expense of T cells (14). Conditional Dicer alleles avoid the lethality resulting from constitutive Dicer deficiency (9) and give insight into the role of Dicer-dependent RNAs in specific lineages. Dicer deletion early in T cell development induced by a Cre transgene driven by the lck promoter (lckCre, expressed from the double-negative [DN] 2 stage onward; reference 16) resulted in a sharp reduction of miRNAs by the double-positive (DP) stage and a 10-fold drop in the number of TCR-αβ thymocytes (17). The CD4/CD8 lineage choice appeared largely intact, including the up-regulation of lineage-specific genes and the stable silencing of Tdt, which is expressed in DP but not in single-positive (SP) thymocytes (17, 18). Deletion of Dicer later in T cell development (induced by a Cre transgene driven by the CD4 promoter, CD4Cre) resulted in moderately reduced T cell numbers (19 and unpublished data) and a failure to silence IFN-γ expression under Th2 polarizing conditions (19). Considering the importance of miRNA-mediated posttranscriptional regulation (8) and the requirement for Dicer in embryonic development (9), it was surprising that T cell development and differentiation progressed relatively normally in the absence of Dicer (17, 19).
Regulatory CD4 T (T reg) cells are essential for immune regulation (20, 21). They are characterized by the constitutive expression of CD25, the α chain of the high affinity IL-2 receptor, glucocorticoid-induced tumor necrosis factor receptor (GITR), CTLA4, and the forkhead transcription factor Foxp3, which is both necessary and sufficient for T reg cell function (22–28). T reg cells arise “naturally” during T cell differentiation in the thymus (20, 21) and their frequencies can be manipulated experimentally (27, 28). Nevertheless, the rules that govern T reg cell differentiation are incompletely understood, which, combined with their potential to balance autoimmunity and immune pathology on the one hand and effective immunity to infections and tumors on the other, explains why T reg cells currently attract special attention (20, 21). To gain insight into the biology of T reg cells we have analyzed their miRNA expression. We find that natural T reg cells and conventional CD4 T cells have distinctly different miRNA profiles. Interestingly, the miRNA expression profile of natural T reg cells shows strong similarities to that of activated conventional CD4 T cells. Collectively, with the constitutive expression of several protein-coding genes usually expressed in response to activation (CD25, CTLA4, and GITR), these data suggest that T reg cells represent a state of partial activation. Analysis of mice that are depleted of miRNAs in the T cell lineage as a result of the loss of Dicer function uncovers a role for Dicer in the generation of natural T reg cells in vivo, and the in vitro induction of Foxp3 by TGF-β. Mice lacking Dicer in the T cell lineage are prone to immune pathologies, indicating a role for Dicer in the regulation of the immune system.
RESULTS
Natural T reg cells and conventional CD4+ T cells have distinct miRNA profiles
We isolated natural T reg cells and conventional CD4 LN T cells by staining and sorting CD4+25+GITR+ and CD4+25−GITR− subsets (Fig. 1 a). An aliquot was stained for Foxp3, confirming expression in the CD4+25+GITR+ (87% Foxp3+) but not the CD4+25−GITR− subset (1% Foxp3+; Fig. 1 a). Low molecular weight RNA was extracted from conventional T cells and T reg cells from three independent sorts. Each set of samples was hybridized to microarrays containing oligonucleotide probes complementary to 173 known miRNAs (29). Two hybridizations (chip 1 and chip 2 in Fig. 1 b) were performed for each biological replicate (Fig. 1 b, A–C) using reciprocal labeling with Cy3/Cy5 and Cy5/Cy3 to offset possible detection bias. This dataset was subjected to significance analysis of microarrays (SAM), in which each miRNA is assigned a score on the basis of its change in expression relative to the standard deviation of repeated measurements (30). SAM identified 68 miRNAs that were differentially expressed between natural T reg cells and conventional CD4+CD25− T cells (Fig. 1 c). 35 miRNAs were preferentially expressed in T reg cells (including miR-223, miR-146, miR-21, miR-22, miR-23a and b, miR-24, miR-214, miR-155, and others) and 33 were down-regulated in T reg cells (including miR-142-5p and -3p, miR-30b, c, e, and members of the Let-7 family). Differential miRNA expression was validated by real-time PCR and Northern blotting (Fig. 1, d and e).
Figure 1.

The miRNA profile of natural T reg cells is distinct from that of conventional CD4+CD25− T cells. (a) Natural T reg cells and conventional CD4 LN T cells were isolated as CD4+25+GITR+ and CD4+25−GITR− populations. Intracellular staining confirmed the expression of Foxp3 in the CD4+25+GITR but not the CD4+25−GITR− subset. (b) Low molecular weight RNA from conventional T cells and T reg cells was labeled with Cy3 and Cy5 and hybridized to microarrays containing oligonucleotide probes corresponding to the known miRNA sequences. The heat map summarizes three biological replicates (A–C) and six technical replicates, including dye swaps for each set. Red indicates overexpression in T reg cells, green indicates underexpression in T reg cells, and gray indicates no signal. (c) Scatter plot of differential miRNA expression between T reg cells and conventional CD4 T cells according to the SAM algorithm. Data points outside the diagonal blue lines are differentially expressed. miRNAs up-regulated in T reg cells are shown in red, and miRNAs down-regulated in T reg cells are shown in green. (d) Differential miRNA expression by real-time PCR analysis of mature miRNAs. 24 miRNAs were analyzed and the real-time PCR results confirmed the array data in all but two cases (miR-15a and 191), which we omitted from our subsequent analysis. (e) Differential miRNA expression confirmed by Northern blotting. Microarray data is available under accession number GSE6003.
Conventional CD4 T cells transiently adopt a T reg cell–like miRNA expression profile in response to activation
From the dataset described in Fig. 1, we selected the 40 miRNAs to which SAM analysis had assigned the lowest q values, indicative of false discovery rates of 0–0.5%. 20 of these miRNAs were overexpressed in T reg cells and 20 were down-regulated in T reg cells compared with conventional CD4 T cells. We then used miRNA microarrays to track the expression of these miRNAs during the activation of conventional CD4 T cells (Fig. 2 a). Strikingly, the miRNA profile of conventional CD4 T cells began to resemble that of T reg cells so that 3 d after activation, 9 of the 20 most T reg cell–specific miRNAs were up-regulated (Fig. 2 b, yellow) and 11 of the 20 miRNAs most underexpressed in T reg cells were down-regulated (Fig. 2 b, blue). This pattern was highly nonrandom because none of 20 miRNAs overexpressed in T reg cells became down-regulated, and none of 20 miRNAs underexpressed in T reg cells became up-regulated in activated conventional T cells (Fig. 2 b). miRNA expression by activated T cells was dynamic so that miRNAs that had been selected for differential expression between T reg cells and naive CD4 T cells began to show a positive correlation between T reg cells and activated T cells 24 h after activation (R2 = 0.28). By day 3 of activation, this positive correlation strengthened to R2 = 0.6 and then declined again (day 10, R2 = 0.03; Fig. 2 c). Hence, conventional CD4 T cells transiently adopt a T reg cell–like miRNA profile during activation.
Figure 2.

The T reg cell miRNA expression profile bears an activation signature. (a) miRNA array comparison of 72-h activated T cells versus naive T cells. Conventional CD4+25− T cells were sorted and activated using plate-bound anti-TCR and anti-CD28. Low molecular weight RNA was extracted from freshly isolated CD4+25− T cells and after 1, 3, and 10 d of activation and hybridized to miRNA arrays as in Fig. 1. (b) T cell activation results in the up-regulation of several miRNAs that are overexpressed in T reg cells (highlighted in yellow) and in the down-regulation of several miRNAs that are underexpressed in T reg cells (highlighted in blue). A kinetic analysis of day 1, 3, and 10 time points is presented in Fig. S1. (c) miRNA expression ratios between T reg cells/naive CD4 T cells are plotted against activated CD4/naive CD4 for days 1, 3, and 10 after activation. A positive correlation develops by day 1 after activation, increases in significance by day 3, and declines by day 10. Microarray data is available under accession number GSE6006.
To determine whether Foxp3, the signature transcription factor of T reg cells, plays a role in defining the T reg cell miRNA expression profile, we activated conventional CD4 T cells and transduced them with retroviruses encoding Foxp3-IRES-GFP or IRES-GFP alone. GFP+ cells were sorted 3–4 d later and, as expected, intracellular staining showed the presence of Foxp3 protein in Foxp3-IRES-GFP–transduced cells but not in cells transduced with the control vector (Fig. 3 a). We then compared miRNA expression between Foxp3 and control vector–transduced cells after 72 (Fig. 3 b) and 96 h (not depicted) and found that 9 of the 10 miRNAs that were up-regulated in Foxp3-expressing cells at both time points were among the top 20 miRNAs preferentially expressed in T reg cells (Fig. 3 c, yellow). Among the miRNAs overexpressed in Foxp3-transduced cells was miR-146, which is overexpressed by T reg cells but not by activated T cells (see above). Conversely, 6 of the 10 miRNAs down-regulated in Foxp3-transduced cells were among the 20 most underexpressed miRNAs in T reg cells (Fig. 3 c, blue). This analysis shows that Foxp3 directly or indirectly contributes to the profile of miRNA expression in T reg cells.
Figure 3.

Foxp3 confers aspects of the T reg cell miRNA profile. (a) CD4+CD25− cells activated overnight with plate-bound anti-TCR and anti-CD28 were transduced with Foxp3-IRES-GFP or IRES-GFP control vector. GFP-expressing cells were sorted 72 or 96 h later, and intracellular staining of GFP+ cells confirmed Foxp3 expression in Foxp3-IRES-GFP–transduced but not in control cells. (b) miRNA microarray analysis of Foxp3-IRES-GFP– versus IRES-GFP–transduced cells 72 h after Foxp3 transduction. The experiment was repeated at 96 h after Foxp3 transduction (not depicted). (c) Foxp3-transduced CD4 T cells overexpress and underexpress a subset of miRNAs that are overexpressed (yellow) or underexpressed (blue) in natural T reg cells (from Fig. 1). Microarray data is available under accession number GSE6007.
Absence of the miRNA-generating RNase III enzyme Dicer from the T cell lineage results in reduced numbers of natural T reg cells and immune pathology
The RNase III enzyme Dicer is essential for the processing of pre-miRNAs into mature, functional miRNAs; therefore, its deletion provides a genetic test for the relevance of miRs to T reg cell biology. In the conditional lckCre Dicer deletion model we had analyzed previously (17), thymocyte numbers are reduced 10-fold and there are very few peripheral T cells (not depicted), precluding an analysis of the involvement of Dicer-generated RNAs in T reg cell development. We therefore crossed our conditional Dicer allele with CD4Cre, which deletes during the DN/DP transition (16, 19) significantly later during T cell development than lckCre (16, 17). Dicer deletion was ∼90% in DP thymocytes, mature miRNAs were still abundant at the DP stage, and thymocyte numbers were normal in CD4Cre dicer Δ/Δ mice (19 and not depicted). Dicer deletion was essentially complete in CD4Cre dicer Δ/Δ SP thymocytes and mature miRNAs were reduced ∼10-fold in naive CD4 peripheral T cells (19 and not depicted). Adult CD4Cre dicer Δ/Δ mice have moderately reduced numbers of peripheral CD4 T cells (19 and not depicted). Among these CD4 T cells, we found a substantial reduction in the frequency of natural T reg cells (2.7 ± 0.3% in CD4Cre dicer Δ/Δ CD4 spleen cells, 7.5 ± 2.5% in dicer lox/lox CD4 spleen, n = 15, ratio = 2.8; 3.3 ± 0.8% in CD4Cre dicer Δ/Δ CD4 LN cells, 7.6 ± 0.8% in dicer lox/lox CD4 LN, n = 13, ratio = 2.3; 0.8 ± 0.2% in CD4Cre dicer Δ/Δ CD4 SP thymocytes, 3.7 ± 0.5% in dicer lox/lox CD4 SP thymocytes, n = 4, ratio = 4.6) and in the expression of Foxp3 mRNA compared with dicer lox/lox controls (Fig. 4, a and b). The introduction of a Bcl-2 transgene failed to correct this deficiency in natural T reg cells (not depicted).
Figure 4.
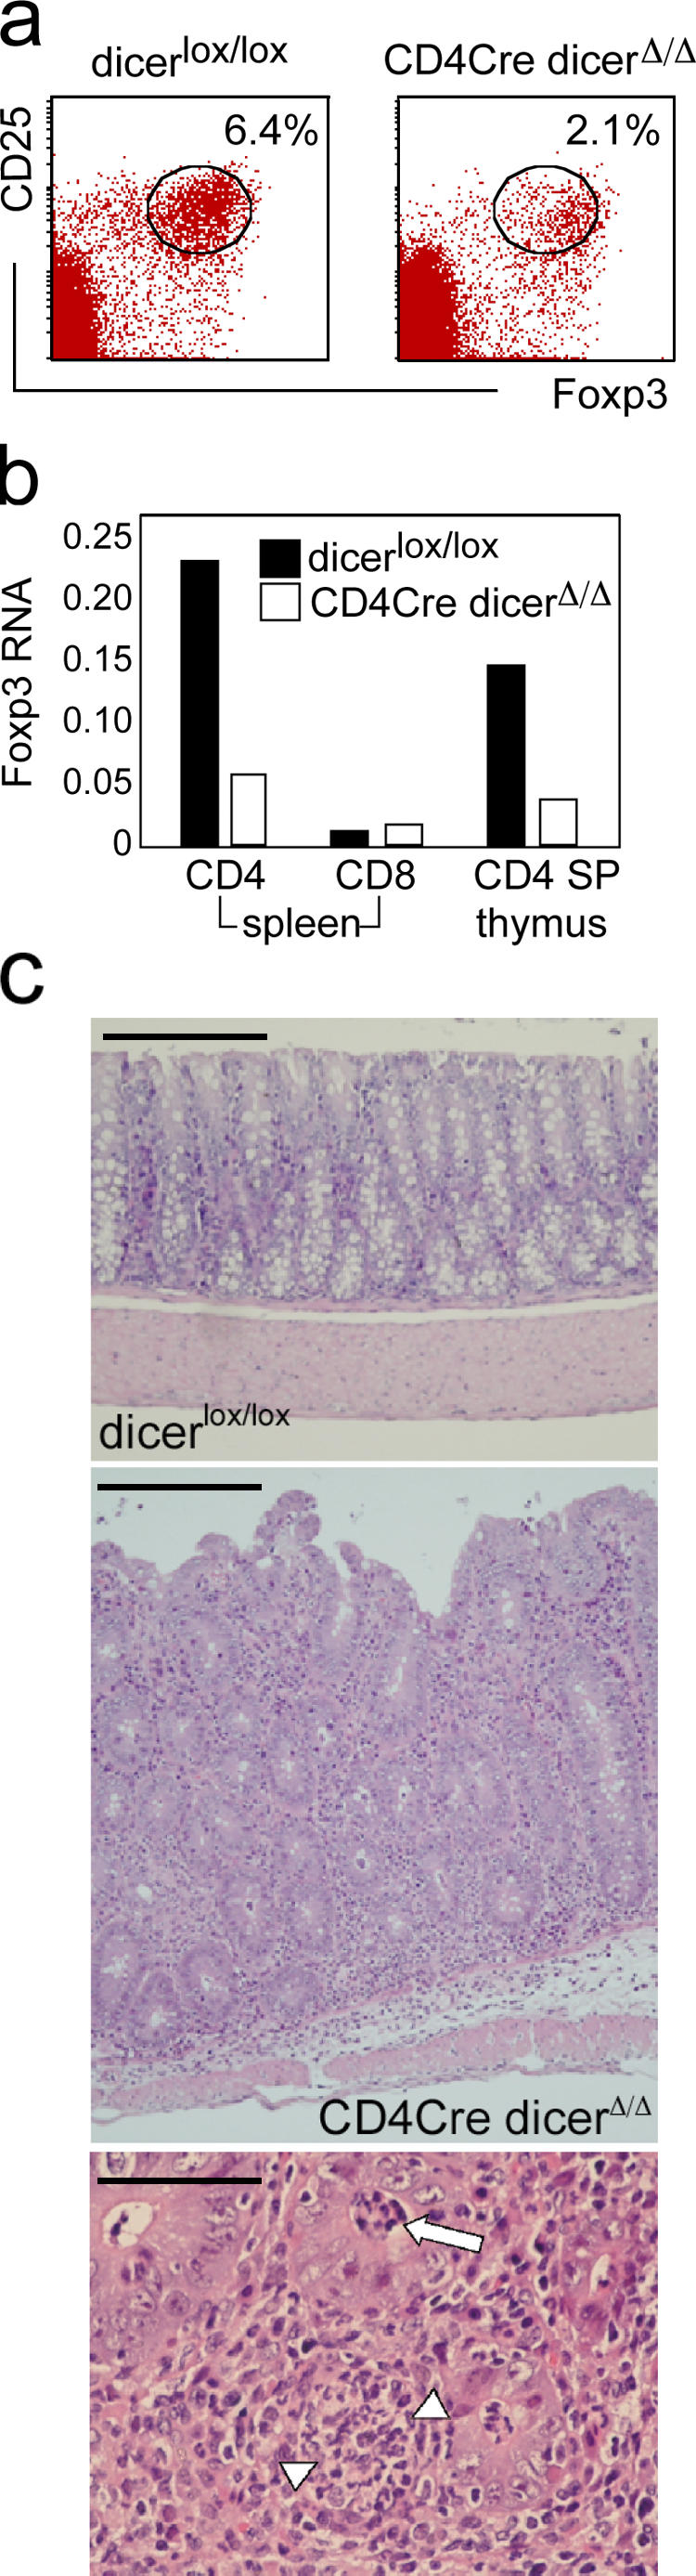
Reduced numbers of natural T reg cells and immune pathology in the absence of the miRNA-generating RNase III enzyme Dicer. (a) Splenocytes from CD4Cre dicer Δ/Δ mice and dicer lox/lox controls were stained for CD4, CD25, and Foxp3 gated on CD4-expressing cells. (b) Quantitative RT-PCR of Foxp3 RNA levels in dicer lox/lox and CD4Cre dicer Δ/Δ CD4+ and CD8+ splenocytes and CD4 SP thymocytes. (c) Top: Normal colonic mucosa of a dicer lox/lox control mouse (Bar, 400 μm). Middle: Colon histology of a CD4Cre dicer Δ/Δ mouse with active colitis. The lamina propria shows a dense infiltrate of inflammatory cells with a sparse infiltrate extending into the submucosa (Bar, 400 μm). Bottom: High power view of CD4Cre dicer Δ/Δ colonic mucosa with crypt abscess formation (arrow), focal gland destruction, and abscess formation (arrowheads; Bar, 100 μm).
Splenomegaly and enlarged intestinal LNs as well as macroscopic thickening of the colon were noted in the majority of our CD4Cre dicer Δ/Δ mice aged between 3 and 4 mo. Histopathological examination revealed immune pathology affecting the colon, lung, and liver. 5 of 11 4-mo-old CD4Cre dicer Δ/Δ mice examined were affected by colitis, characterized by a diffuse infiltrate of inflammatory cells in the lamina propria and focal formation of crypt abscesses (Fig. 4 c). There also was focal portal and lobular inflammation in the liver in three mice (not depicted). The colon appeared healthy in 3-mo-old CD4Cre dicer Δ/Δ mice examined (n = 5) and in all dicer lox/lox controls (n = 10).
Dicer is required in a cell-autonomous fashion for the development of natural T reg cells in the thymus
The data presented above suggest that Dicer plays a role in T reg cell biology, but they do not distinguish between an involvement in T reg cell differentiation on the one hand and T reg cell maintenance or homeostasis on the other. It could be that Dicer-deficient T reg cells differentiate in normal numbers but are prone to apoptosis (17), for example in response to the recognition of self-antigen (31, 32). Alternatively, homeostatic control (33) could partially compensate for a more serious defect in T reg cell differentiation than is apparent by their frequency at steady-state. We therefore examined the first wave of natural T reg cell development in the thymus. To exclude exchange between the thymic and the peripheral T cell pool, we used thymic organ culture initiated at embryonic day 15 (E15), when all thymocytes are still CD4−CD8− DN. Fetal thymi from lckCre dicer Δ/Δ and dicer lox/lox controls were cultured for 10 d, and the frequency of T reg cells was evaluated (Fig. 5 a). In dicer lox/lox control cultures, 2.4 ± 0.3% of CD4 SP cells were CD25+ CD69− (n = 6), whereas in lckCre dicer Δ/Δ culturesthe frequency of CD4 SP CD25+ CD69− cells was reduced fourfold to 0.6 ± 0.2% (n = 11). The absolute numbers of CD4 SP CD25+ CD69− cells generated were 1,041 ± 296 per dicer lox/lox fetal thymic lobe (n = 6) versus 48 ± 22 per lckCre dicer Δ/Δ lobe (n = 11), a difference of 22-fold. Analysis of Foxp3 and GITR expression confirmed the inefficient generation of natural T reg cells in lckCre dicer Δ/Δ thymi (Fig. 5 a). We conclude that the thymic differentiation of natural T reg cells is compromised in the absence of Dicer and mature miRNAs.
Figure 5.

Dicer is required cell autonomously for the differentiation of natural T reg cells in the thymus. (a) E15 thymi were explanted into organ culture and 10 d later analyzed for CD4, CD8, and T reg cell markers. The expression profile of CD25 and CD69 or Foxp3 and GITR is shown for CD4 SP thymocytes. Note that lckCre dicer Δ/Δ thymi fail to generate a substantial population of natural T reg cells. (b) Mixed thymus chimeras were constructed (reference 34) consisting of a wild-type component marked by the Thy1.1 alloantigen and a Thy1.2 component consisting of either dicer lox/lox controls or lckCre dicer Δ/Δ. e15-17 thymi were dissociated by proteolysis, mixed as indicated, reaggregated, and cultured. After 7–10 d, thymocytes were stained for Thy1.1, CD4, CD8, CD25, and GITR and analyzed by five-color flow cytometry. The expression of CD25 and GITR (used to define T reg cells) was determined separately for Thy1.1+ and Thy1.1− CD4 SP cells. Note that Thy1.2 dicer lox/lox controls but not Thy1.2 lckCre dicer Δ/Δ thymocytes generate T reg cells in mixed chimeras with wild-type Thy1.1 cells.
Because T reg cell differentiation can be driven by extrinsic signals such as TGF-β (27), we asked whether T reg cell differentiation of Dicer-deficient T cell precursors could be rescued by a wild-type environment. To this end, we constructed mixed thymus chimeras (34) consisting of a wild-type component marked by the Thy1.1 alloantigen and a Thy1.2 component of either dicer lox/lox controls or lckCre dicer Δ/Δ (see Materials and methods). Embryonic day 15–17 thymi were dissociated by proteolysis, mixed as indicated, reaggregated, and cultured for 7–10 d. CD4 SP thymocytes that developed in these chimeras were analyzed for the presence of natural T reg cells, identified by CD25 and GITR. Mixed chimeras containing wild-type Thy1.1 and dicer lox/lox Thy1.2 thymi generated distinct populations of CD25+ GITR+ CD4 SP thymocytes within both the Thy1.1+ (wild-type) and the Thy1.1− (dicer lox/lox) subset (4.2 and 4.3%, respectively; Fig. 5 b). In contrast, mixed chimeras containing wild-type Thy1.1 and lckCre dicer Δ/Δ Thy1.2 thymi generated a distinct CD25+ GITR+ population only in the Thy1.1+ (wild-type) but not the Thy1.1− (lckCre dicer Δ/Δ) CD4 SP subset (2.7 and 0.2%, respectively; Fig. 5 b). Hence, the impaired thymic development of Dicer-deficient natural T reg cells is not rescued by the provision of an environment in which wild-type natural T reg cells develop normally.
Lack of Dicer affects the induction of Foxp3 in peripheral CD4+CD25− T cells without diverting them to the IL-17 lineage
T cell activation in the presence of TGF-β induces Foxp3 expression and T reg cell function (27), providing a model system for postthymic T reg cell differentiation. We activated CD4Cre dicer Δ/Δ or control dicer lox/lox CD4+CD25− LN T cells with 200 ng/ml of plate-bound anti-TCR (H57) and anti-CD28. 2 d after exposure to 1 ng/ml TGF-β1 (Sigma-Aldrich), 48.5 ± 15.7% of dicer lox/lox but only 13.5 ± 4.7% of CD4Cre dicer Δ/Δ cells expressed Foxp3 (n = 6; Fig. 6 a). This demonstrates a role for Dicer in the induction of Foxp3 expression by environmental signals. Inflammatory signals such as IL-6 have been shown to abrogate Foxp3 induction by TGF-β (35) and to induce IL-17 expression instead (36, 37). To address the possibility that T cell differentiation was diverted toward the IL-17 lineage in the absence of Dicer, we restimulated the cells 5 d after activation. Intracellular staining showed no IL-17 production by CD4Cre dicer Δ/Δ or dicer lox/lox control cells after exposure to TGF-β, whereas IL-17 was readily induced by the combination of TGF-β and IL-6 (Fig. 6 b).
Figure 6.

Dicer facilitates the induction of Foxp3 in CD4+CD25− cells. (a) Sorted CD4Cre dicer Δ/Δ or control dicer lox/lox CD4+CD25− LN T cells were activated with 200 ng/ml of plate-bound anti-TCR (H57) and anti-CD28 with or without 1 ng/ml of recombinant TGF-β1 (Sigma-Aldrich). Expression of Foxp3 was assayed 2 d later by intracellular staining (mean ± SD, n = 6). (b) CD4+CD25− LN T cells were activated as in (a) in the presence of 50 ng/ml IL-6 (R &D Systems) and/or 1 ng/ml TGF-β1. Foxp3 expression was assayed as in (a). 5 d after activation the cells were restimulated with PMA and Ca2+ ionophore in the presence of brefeldin A and assayed for IL-17 expression by intracellular staining.
DISCUSSION
miRNAs control the expression of a large proportion of protein-coding genes at the posttranscriptional level (6–8), and Dicer is essential for embryonic development (9). It was therefore surprising when recent studies showed that many aspects of T cell differentiation are relatively normal in the absence of Dicer (17, 19). Here we show that the deletion of Dicer results in a specific defect at a relatively late stage of T cell development. We find that Dicer is required, in a cell-autonomous fashion, for the development of natural T reg cells in the thymus, for normal T reg cell numbers in peripheral lymphoid organs, and for the efficient induction of Foxp3 in naive CD4 T cells by TGF-β. Around 4 mo of age, a proportion (around 45%) of CD4Cre dicer Δ/Δ mice develop immune pathology, in particular inflammatory bowel disease. The late onset and incomplete penetrance of disease compared with mice that are genetically deficient in Foxp3 (22, 24) may be due to the presence of residual Foxp3-expressing cells in CD4Cre dicer Δ/Δ mice. CD4Cre dicer Δ/Δ T cells are predisposed to Th1 responses (19), which may contribute to the observed immune pathology.
Consistent with the importance of Dicer for T reg cell biology, we show that T reg cells express a characteristic set of miRNAs distinct from that of naive CD4 T cells, including 7 of a set of 21 miRNAs commonly overexpressed in solid tumors (miR-223, miR-214, miR-146, miR-21, miR-24, miR-155, and miR-191; reference 38), which can affect the growth and/or the survival of tumor cells (39, 40). In contrast, Let-7, which negatively regulates Ras, is down-regulated in some human tumors (41) and in T reg cells (this study). miRNA 21 is encoded in the 3′ UTR of the Tmem49 gene (EMBL: AJ459711; MMU459711). Despite sixfold overexpression of miR-21 in T reg cells, real-time PCR primers in the coding region and the 3′ UTR showed no difference in mature Tmem49 mRNA levels between T reg cells and conventional T cells (not depicted). Intronic primers demonstrated slightly (1.6-fold) higher levels of Tmem49 primary transcript in T reg cells, consistent with the fact that only nuclear transcripts are potential targets for processing by the nuclear RNase III Drosha (2). Similarly, mir-155 resides in the noncoding BIC transcript (EMBL: AY096003). BIC and miR-155 accumulate in B cell lymphomas, but the abundance of BIC transcript does not predict the amount of mature miR-155 (42). Hence, the levels of conventional transcripts do not predict the expression of miRNAs encoded at the same location, ruling out the use of cDNA expression data as indicators of miRNA levels. Expression of miR-146 is low in naive T cells and selectively up-regulated in Th1 cells (15) and T reg cells (this study), but not in Th2 cells (15), whereas miR-150 is expressed in naive T cells but down-regulated after activation in Th1 and Th2 cells (15, 19) as well as in T reg cells (this study). miR-142 and members of the Let7 family are also down-regulated in Th1 and Th2 cells (15) as well as in T reg cells.
The emerging picture is that T reg cells express an miRNA profile similar to that of acutely activated CD4 T cells. This brings into focus the knowledge that T reg cells constitutively express CD25, CTLA4, and GTIR, markers that are also induced by the activation of conventional CD4 T cells (20, 21), even though most T reg cells in peripheral LNs are CD69− CD62Lhigh and not actively dividing (31). From this perspective, one could argue that T reg cells may be locked in a partially activated state. Understanding the molecular mechanisms that maintain this state in natural T reg cells will be key to their biology. Interestingly, our data show that the ectopic expression of the T reg cell signature transcription factor Foxp3 can confer a partial T reg cell miRNA profile. Hence, aspects of the T reg cell–specific miRNA profile may be under the direct or indirect control of Foxp3. It remains to be investigated whether Foxp3 is under miRNA control. In addition to the extensive overlap between the miRNA profile of T reg cells and activated T cells, our analysis has identified miRNAs that are overexpressed by T reg cells but not by activated T cells, for example miR-223 and miR-146. Detailed studies on the mRNA targets of these and other T reg cell–expressed miRNAs may provide further clues to how T reg cells develop and are maintained over time. The systemic manipulation of miRNA function (43) may open new avenues for the control of T reg cell development and function in vivo.
MATERIALS AND METHODS
Mice, flow cytometry, and cell sorting.
Animal work was performed according to the Animals (Scientific Procedures) Act, UK. dicer lox/lox mice (17) on a mixed C57BL/129 background were crossed with LckCre or CD4Cre transgenic mice (16) to generate lckCre dicer Δ/Δ or CD4Cre dicer Δ/Δ mice and held in a conventional facility where they encountered Pasteurella pneumotropica and Tritrichomonas muris but no other identified pathogens, such as MHV or Sendai virus. Cells were stained, analyzed, and sorted by flow cytometry as described previously (17). The following antibodies were used: CD25-PE, CD25-APC, CD69-FITC, and Thy1.1-biotin (BD Biosciences); CD4-TC and CD8-PE (Caltag); GITR-FITC (R&D Systems); Streptavidin-Alexa-405 (Invitrogen); and Foxp3-PE and Foxp3-APC (eBioscience). Cells were analyzed or sorted on Becton Dickinson Calibur, DIVA, or Aria flow cytometers.
Cell and tissue culture.
LN T cells were activated at 1–3 × 10⁶/ml with 200 ng/ml of plate-bound anti–TCR-β (H57; BD Biosciences) and 2 μg/ml anti-CD28 (BD Biosciences). For induction of Foxp3 expression, we added 1 ng/ml TGF-β (Sigma-Aldrich). Retroviral gene transfer was performed by spin infection of overnight-activated T cells (90 min, 2,000 rpm, 37°C, without polybrene) using mouse stem cell virus vectors as described previously (44). Fetal thymic organ culture, reaggregate culture, and mixed thymic chimeras were established and cultured as described previously (34).
miRNA microarray analysis.
Probes for 173 miRNAs referenced in miRBase (29) were synthesized in sense orientation (Sigma-Aldrich) and spotted on glass slides in 16 replicates. Low molecular weight RNA was isolated using the MirVana kit (Ambion) and miRNAs were reverse transcribed using the 3DNA Array Detection 900 miRNA RT kit (Genisphere). 100 ng of small RNAs were tailed with poly(A) polymerase and reverse transcribed using a poly(dT) primer and a unique capture sequence. The tagged cDNAs were concentrated with Microcon YM-10 columns (Millipore), resuspended in 60 μl hybridization buffer (18.5% formamide, 5xSSC, 5x Denhardt's solution, 0.5% SDS, 5mM KH2PO4), denatured at 95°C for 5 min, and hybridized to the array at 42°C overnight. Arrays were developed with Cy3- and Cy5-coupled DNA oligonucleotides with reverse complementary to the capture sequences and scanned with a GenePix 4000B scanner using Genepix Pro 5.0 (Axon). Data analysis was performed in Acuity (Molecular Dynamics). Data was filtered by removing spots with <55% of pixels one standard deviation above background after subtracting median background values. Cy3/Cy5 ratios were log(2) transformed and normalized by Lowess, and in some cases by median centering, and the average ratio of replicates was calculated for each miRNA that passed the filter criteria. To eliminate dye bias, each experiment was hybridized to two separate arrays, swapping the dye of each sample. Data were subjected to SAM as described previously (30), accepting a false positive rate of 0.068.
RT-PCR and Northern blots.
Total RNA was isolated using RNAbee (Tel-Test) and reverse transcribed. Real-time PCR analysis was performed on an Opticon DNA engine (95°C for 15 min followed by 40 cycles at 94°C for 15 s, 60°C for 30 s, and 72°C for 30 s with a plate read at 72°C; MJ Research Inc.) and normalized to the geometric mean of Ywhaz (tyrosine 3-monooxygenase/tryptophan 5-monooxygenase activation protein, zeta polypeptide) and Ube2L3 (ubiquitin conjugating enzyme E2L3) as described previously (17). Primer sequences (5′ to 3′) are as follows: Ywhaz forward: CGTTGTAGGAGCCCGTAGGTCAT, Ywhaz reverse: TCTGGTTGCGAAGCATTGGG; Ube2L3 forward: AGGAGGCTGATGAAGGAGCTTGA, Ube2L3 reverse: TGGTTTGAATGGATACTCTGCTGGA; Foxp3 forward: ACTCGCATGTTCGCCTACTTCAG, Foxp3 reverse: GGCGGATGGCATTCTTCCAGGT; Tmem49 forward: GCCTGTGCTTCTATTCCAAACC, Tmem49 reverse: GAAAGTCACCATCTGCTCCA; Tmem49 3′UTR forward: GTTGAATCTCATGGCAACAGCAGTC, Tmem49 3′UTR reverse: AAGGGCTCCAAGTCTCACAAGACA; and Tmem49 intron 11 forward: AGAACCAGCAGATGTGTAGGCAGC, Tmem49 intron 11 reverse: GGGAAGAGGACCTAAACTCTGAGAGC.
For quantitative real-time RT-PCR of miRNAs, gene-specific reverse transcription was performed for each miRNA using 10 ng of low molecular weight RNA, 1 mM dNTPs, 50 U MutliScribe reverse transcriptase, 3.8 U RNase inhibitor, and 50 nM of gene-specific RT primer samples using the TaqMan MicroRNA Reverse Transcription kit (Applied Biosystems). 15-μl reactions were incubated for 30 min at 16°C, 30 min at 42°C, and 5 min at 85°C to inactivate the reverse transcriptase. Real time RT-PCR reactions (1.35 μl of RT product, 10 μl TaqMan 2x Universal PCR master Mix, No AmpErase UNG [Applied Biosystems], and 10 μl TaqMan MicroRNA Assay Mix containing PCR primers and TaqMan probes) were run in triplicates at 95°C for 10 min followed by 40 cycles at 95°C for 15 s and 60°C for 1 min. Expression values were normalized to miR-17-5p. Gene-specific RT primers and TaqMan MicroRNA Assay Mix were from the TaqMan MircoRNA Assays Human Panel Early Access kit (Applied Biosystems). Northern blots were performed as described previously (17).
Histology.
Tissues were fixed in 10% neutral-buffered formalin, embedded in paraffin, sectioned, and stained with hematoxylin and eosin and with periodic acid-Schiff for microscopic examination.
Online supplemental material.
Fig. S1 shows the kinetics of miRNA expression after the activation of naive CD4 T cells. It is available at http://www.jem.org/cgi/content/full/jem.20061692/DC1.
Supplemental Material
Acknowledgments
We thank Jane Mardon-Srivastava and Eugene Ng for cell sorting, Dr. Cristopher Wilson for CD4Cre mice, and Drs. Fiona Powrie and Pedro Vieira for advice and discussions.
This work was supported by the Medical Research Council, UK and the National Institutes of Health.
The authors have no conflicting financial interests.
Abbreviations used: DN, double-negative; DP, double-positive; GITR, glucocorticoid-induced tumor necrosis factor receptor; miRNA, micro RNA; SAM, significance analysis of microarrays; SP, single-positive; T reg, regulatory T; UTR, untranslated region.
B.S. Cobb, A. Hertweck, and J. Smith contributed equally to this work.
References
- 1.Fisher, A.G. 2002. Cellular identity and lineage choice. Nat. Rev. Immunol. 2:977–982. [DOI] [PubMed] [Google Scholar]
- 2.Bartel, D.P. 2004. MicroRNAs: genomics, biogenesis, mechanism, and function. Cell. 116:281–297. [DOI] [PubMed] [Google Scholar]
- 3.Denli, A.M., B.B. Tops, R.H. Plasterk, R.F. Ketting, and G.J. Hannon. 2004. Processing of primary microRNAs by the Microprocessor complex. Nature. 432:231–235. [DOI] [PubMed] [Google Scholar]
- 4.Gregory, R.I., K.P. Yan, G. Amuthan, T. Chendrimada, B. Doratotaj, N. Cooch, and R. Shiekhattar. 2004. The Microprocessor complex mediates the genesis of microRNAs. Nature. 432:235–240. [DOI] [PubMed] [Google Scholar]
- 5.Chendrimada, T.P., R.I. Gregory, E. Kumaraswamy, J. Norman, N. Cooch, K. Nishikura, and R. Shiekhattar. 2005. TRBP recruits the Dicer complex to Ago2 for microRNA processing and gene silencing. Nature. 436:740–744. [DOI] [PMC free article] [PubMed] [Google Scholar]
- 6.Lewis, B.P., C.B. Burge, and D.P. Bartel. 2005. Conserved seed pairing, often flanked by adenosines, indicates that thousands of human genes are microRNA targets. Cell. 120:15–20. [DOI] [PubMed] [Google Scholar]
- 7.Lim, L.P., N.C. Lau, P. Garrett-Engele, A. Grimson, J.M. Schelter, J. Castle, D.P. Bartel, P.S. Linsley, and J.M. Johnson. 2005. Microarray analysis shows that some microRNAs downregulate large numbers of target mRNAs. Nature. 433:769–773. [DOI] [PubMed] [Google Scholar]
- 8.He, L., and G.J. Hannon. 2004. MicroRNAs: small RNAs with a big role in gene regulation. Nat. Rev. Genet. 5:522–531. [DOI] [PubMed] [Google Scholar]
- 9.Bernstein, E., S.Y. Kim, M.A. Carmell, E.P. Murchison, H. Alcorn, M.Z. Li, A.A. Mills, S.J. Elledge, K.V. Anderson, and G.J. Hannon. 2003. Dicer is essential for mouse development. Nat. Genet. 35:215–217. [DOI] [PubMed] [Google Scholar]
- 10.Giraldez, A.J., R.M. Cinalli, M.E. Glasner, A.J. Enright, J.M. Thomson, S. Baskerville, S.M. Hammond, D.P. Bartel, and A.F. Schier. 2005. MicroRNAs regulate brain morphogenesis in zebrafish. Science. 308:833–838. [DOI] [PubMed] [Google Scholar]
- 11.Kanellopoulou, C., S.A. Muljo, A.L. Kung, S. Ganesan, R. Drapkin, T. Jenuwein, D.M. Livingston, and K. Rajewsky. 2005. Dicer-deficient mouse embryonic stem cells are defective in differentiation and centromeric silencing. Genes Dev. 19:489–501. [DOI] [PMC free article] [PubMed] [Google Scholar]
- 12.Chen, C.Z., and H.F. Lodish. 2005. MicroRNAs as regulators of mammalian hematopoiesis. Semin. Immunol. 17:155–165. [DOI] [PubMed] [Google Scholar]
- 13.He, L., J.M. Thomson, M.T. Hemann, E. Hernando-Monge, D. Mu, S. Goodson, S. Powers, C. Cordon-Cardo, S.W. Lowe, G.J. Hannon, and S.M. Hammond. 2005. A microRNA polycistron as a potential human oncogene. Nature. 435:828–833. [DOI] [PMC free article] [PubMed] [Google Scholar]
- 14.Chen, C.Z., L. Li, H.F. Lodish, and D.P. Bartel. 2004. MicroRNAs modulate hematopoietic lineage differentiation. Science. 303:83–86. [DOI] [PubMed] [Google Scholar]
- 15.Monticelli, S., K.M. Ansel, C. Xiao, N.D. Socci, A.M. Krichevsky, T.H. Thai, N. Rajewsky, D.S. Marks, C. Sander, K. Rajewsky, et al. 2005. MicroRNA profiling of the murine hematopoietic system. Genome Biol. 6:R71. [DOI] [PMC free article] [PubMed] [Google Scholar]
- 16.Lee, P.P., D.R. Fitzpatrick, C. Beard, H.K. Jessup, S. Lehar, K.W. Makar, M. Perez-Melgosa, M.T. Sweetser, M.S. Schlissel, S. Nguyen, et al. 2001. A critical role for Dnmt1 and DNA methylation in T cell development, function, and survival. Immunity. 15:763–774. [DOI] [PubMed] [Google Scholar]
- 17.Cobb, B.S., T.B. Nesterova, E. Thompson, A. Hertweck, E. O'Connor, J. Godwin, C.B. Wilson, N. Brockdorff, A.G. Fisher, S.T. Smale, and M. Merkenschlager. 2005. T cell lineage choice and differentiation in the absence of the RNAse III enzyme dicer. J. Exp. Med. 201:1367–1373. [DOI] [PMC free article] [PubMed] [Google Scholar]
- 18.Su, R.C., K.E. Brown, S. Saaber, A.G. Fisher, M. Merkenschlager, and S.T. Smale. 2004. Assembly of silent chromatin at a developmentally regulated gene. Nat. Genet. 36:502–506. [DOI] [PubMed] [Google Scholar]
- 19.Muljo, S.A., K.M. Ansel, C. Kanellopoulou, D.M. Livingston, A. Rao, and K. Rajewsky. 2005. Aberrant T cell differentiation in the absence of Dicer. J. Exp. Med. 202:261–269. [DOI] [PMC free article] [PubMed] [Google Scholar]
- 20.Sakaguchi, S. 2005. Naturally arising Foxp3-expressing CD25+CD4+ regulatory T cells in immunological tolerance to self and non-self. Nat. Immunol. 6:345–352. [DOI] [PubMed] [Google Scholar]
- 21.Fontenot, J.D., and A.Y. Rudensky. 2005. A well adapted regulatory contrivance: regulatory T cell development and the forkhead family transcription factor Foxp3. Nat. Immunol. 6:331–337. [DOI] [PubMed] [Google Scholar]
- 22.Brunkow, M.E., E.W. Jeffery, K.A. Hjerrild, B. Paeper, L.B. Clark, S.A. Yasayko, J.E. Wilkinson, D. Galas, S.F. Ziegler, and F. Ramsdell. 2001. Disruption of a new forkhead/winged-helix protein, scurfin, results in the fatal lymphoproliferative disorder of the scurfy mouse. Nat. Genet. 27:68–73. [DOI] [PubMed] [Google Scholar]
- 23.Khattri, R., T. Cox, S.A. Yasayko, and F. Ramsdell. 2003. An essential role for scurfin in CD4+CD25+ T regulatory cells. Nat. Immunol. 4:337–342. [DOI] [PubMed] [Google Scholar]
- 24.Fontenot, J.D., M.A. Gavin, and A.Y. Rudensky. 2003. FoxP3 programs the development and function of CD4+CD25+ regulatory T cells. Nat. Immunol. 4:330–336. [DOI] [PubMed] [Google Scholar]
- 25.Fontenot, J.D., J.P. Rasmussen, L.M. Williams, J.L. Dooley, A.G. Farr, and A.Y. Rudensky. 2005. Regulatory T cell lineage specification by the forkhead transcription factor FoxP3. Immunity. 22:329–341. [DOI] [PubMed] [Google Scholar]
- 26.Hori, S., T. Nomura, and S. Sakaguchi. 2003. Control of regulatory T cell development by the transcription factor Foxp3. Science. 299:1057–1061. [DOI] [PubMed] [Google Scholar]
- 27.Chen, W., W. Jin, N. Hardegen, K.J. Lei, L. Li, N. Marinos, G. McGrady, and S.M. Wahl. 2003. Conversion of peripheral CD4+CD25− naive T cells to CD4+CD25+ regulatory T cells by TGF-β induction of transcription factor Foxp3. J. Exp. Med. 198:1875–1886. [DOI] [PMC free article] [PubMed] [Google Scholar]
- 28.Kretschmer, K., I. Apostolou, D. Hawiger, K. Khazaie, M.C. Nussenzweig, and H. von Boehmer. 2005. Inducing and expanding regulatory T cell populations by foreign antigen. Nat. Immunol. 6:1219–1227. [DOI] [PubMed] [Google Scholar]
- 29.Griffiths-Jones, S., R.J. Grocock, S. van Dongen, A. Bateman, and A.J. Enright. 2006. miRBase: microRNA sequences, targets and gene nomenclature. Nucleic Acids Res. 34:D140–D144. [DOI] [PMC free article] [PubMed] [Google Scholar]
- 30.Tusher, V.G., R. Tibshirani, and G. Chu. 2001. Significance analysis of microarrays applied to the ionizing radiation response. Proc. Natl. Acad. Sci. USA. 98:5116–5121. [DOI] [PMC free article] [PubMed] [Google Scholar]
- 31.Fisson, S., G. Darrasse-Jeze, E. Litvinova, F. Septier, D. Klatzmann, R. Liblau, and B.L. Salomon. 2003. Continuous activation of autoreactive CD4+ CD25+ regulatory T cells in the steady state. J. Exp. Med. 198:737–746. [DOI] [PMC free article] [PubMed] [Google Scholar]
- 32.Hsieh, C.S., Y. Liang, A.J. Tyznik, S.G. Self, D. Liggitt, and A.Y. Rudensky. 2004. Recognition of the peripheral self by naturally arising CD25+ CD4+ T cell receptors. Immunity. 21:267–277. [DOI] [PubMed] [Google Scholar]
- 33.Setoguchi, R., S. Hori, T. Takahashi, and S. Sakaguchi. 2005. Homeostatic maintenance of natural FoxP3+ CD25+ CD4+ regulatory T cells by interleukin IL-2 and induction of autoimmune disease by IL-2 neutralization. J. Exp. Med. 201:723–735. [DOI] [PMC free article] [PubMed] [Google Scholar]
- 34.Merkenschlager, M., and A.G. Fisher. 1994. In vitro construction of thymus chimeras. J. Immunol. Methods. 171:177–188. [DOI] [PubMed] [Google Scholar]
- 35.Veldhoen, M., R.J. Hocking, C.J. Atkins, R.M. Locksley, and B. Stockinger. 2006. TGFbeta in the context of an inflammatory cytokine milieu supports de novo differentiation of IL-17-producing T cells. Immunity. 24:179–189. [DOI] [PubMed] [Google Scholar]
- 36.Bettelli, E., Y. Carrier, W. Gao, T. Korn, T.B. Strom, M. Oukka, H.L. Weiner, and V.K. Kuchroo. 2006. Reciprocal developmental pathways for the generation of pathogenic effector TH17 and regulatory T cells. Nature. 441:235–238. [DOI] [PubMed] [Google Scholar]
- 37.Harrington, L.E., R.D. Hatton, P.R. Mangan, H. Turner, T.L. Murphy, K.M. Murphy, and C.T. Weaver. 2005. Interleukin 17-producing CD4+ effector T cells develop via a lineage distinct from the T helper type 1 and 2 lineages. Nat. Immunol. 6:1123–1132. [DOI] [PubMed] [Google Scholar]
- 38.Volinia, S., G.A. Calin, C.G. Liu, S. Ambs, A. Cimmino, F. Petrocca, R. Visone, M. Iorio, C. Roldo, M. Ferracin, et al. 2006. A microRNA expression signature of human solid tumors defines cancer gene targets. Proc. Natl. Acad. Sci. USA. 103:2257–2261. [DOI] [PMC free article] [PubMed] [Google Scholar]
- 39.Cheng, A.M., M.W. Byrom, J. Shelton, and L.P. Ford. 2005. Antisense inhibition of human miRNAs and indications for an involvement of miRNA in cell growth and apoptosis. Nucleic Acids Res. 33:1290–1297. [DOI] [PMC free article] [PubMed] [Google Scholar]
- 40.Chan, J.A., A.M. Krichevsky, and K.S. Kosik. 2005. MicroRNA-21 is an antiapoptotic factor in human glioblastoma cells. Cancer Res. 65:6029–6033. [DOI] [PubMed] [Google Scholar]
- 41.Johnson, S.M., H. Grosshans, J. Shingara, M. Byrom, R. Jarvis, A. Cheng, E. Labourier, K.L. Reinert, D. Brown, and F.J. Slack. 2005. RAS is regulated by the let-7 microRNA family. Cell. 120:635–647. [DOI] [PubMed] [Google Scholar]
- 42.Eis, P.S., W. Tam, L. Sun, A. Chadburn, Z. Li, M.F. Gomez, E. Lund, and J.E. Dahlberg. 2005. Accumulation of miR-155 and BIC RNA in human B cell lymphomas. Proc. Natl. Acad. Sci. USA. 102:3627–3632. [DOI] [PMC free article] [PubMed] [Google Scholar]
- 43.Krutzfeldt, J., N. Rajewsky, R. Braich, K.G. Rajeev, T. Tuschl, M. Manoharan, and M. Stoffel. 2005. Silencing of microRNAs in vivo with ‘antagomirs’. Nature. 438:685–689. [DOI] [PubMed] [Google Scholar]
- 44.Cobb, B.S., S. Morales-Alcelay, G. Kleiger, K.E. Brown, A.G. Fisher, and S.T. Smale. 2000. Targeting of Ikaros to pericentromeric heterochromatin by direct DNA binding. Genes Dev. 14:2146–2160. [DOI] [PMC free article] [PubMed] [Google Scholar]
Associated Data
This section collects any data citations, data availability statements, or supplementary materials included in this article.