Abstract
The dynamic behavior of metabolic networks is governed by numerous regulatory mechanisms, such as reversible phosphorylation, binding of allosteric effectors or temporal gene expression, by which the activity of the participating enzymes can be adjusted to the functional requirements of the cell. For most of the cellular enzymes, such regulatory mechanisms are at best qualitatively known, whereas detailed enzyme-kinetic models are lacking. To explore the possible dynamic behavior of metabolic networks in cases of lacking or incomplete enzyme-kinetic information, we present a computational approach based on structural kinetic modeling. We derive statistical measures for the relative impact of enzyme-kinetic parameters on dynamic properties (such as local stability) and apply our approach to the metabolism of human erythrocytes. Our findings show that allosteric enzyme regulation significantly enhances the stability of the network and extends its potential dynamic behavior. Moreover, our approach allows to differentiate quantitatively between metabolic states related to senescence and metabolic collapse of the human erythrocyte. We think that the proposed method represents an important intermediate step on the long way from topological network analysis to detailed kinetic modeling of complex metabolic networks.
Keywords: dynamic behavior, kinetic modeling, metabolic network, robustness, stability
Introduction
One of the most challenging goals of computational systems biology is the development of detailed kinetic models to simulate and predict the dynamic response of metabolic networks toward, for example, changes in kinetic parameters due to pharmacological interventions or variations of environmental conditions. However, for complex metabolic networks comprised of several interwoven pathways, detailed kinetic modeling is usually not possible due to the inevitable lack of knowledge about the kinetic properties of the involved enzymes and membrane transporters. In this work, we extend a recently proposed method that bridges between topology-based approaches and explicit kinetic models of metabolic networks (Steuer et al, 2006). In the face of lacking or incomplete enzyme-kinetic information, we (i) derive and compare statistical measures for the relative impact of enzymatic reactions and parameters on the dynamic properties (such as local stability) of metabolic networks, (ii) evaluate the functional role of allosteric feedback regulation in the stabilization of metabolic networks and (iii) propose measures to quantitatively evaluate the stability and robustness properties of metabolic states.
Our approach is exemplified and validated using a representation of the metabolic network of the human erythrocyte. Due to the fundamental role of erythrocytes in the oxygen supply of cells, as well as the relative simplicity of its metabolism, erythrocytes have been subject to extensive experimental and theoretical research for decades. Numerous explicit mathematical models have been developed since the late 1970s (Rapoport et al, 1976; Ataullakhanov et al, 1981; Holzhütter et al, 1985; Joshi and Palsson, 1989; McIntyre et al, 1989; Ni and Savageau, 1996a; Mulquiney and Kuchel, 1999; Nakayama et al, 2005) providing a suitable benchmark to assess the reliability of our method.
Our approach is motivated by the increasing experimental accessibility of cellular characteristics, such as metabolic fluxes and concentrations of metabolic intermediates (Fernie et al, 2004; Goodacre et al, 2004; Sauer, 2004). Each metabolic state, characterized by a flux distribution and metabolite concentrations, is associated with a unique spectrum of dynamic properties, as defined by the ensemble of all possible kinetic models consistent with the respective state. Our main focus thus lies on a quantitative characterization and comparison of the stability properties of metabolic states.
In particular, transitions to instability, occurring via a loss of a stable steady state, were previously argued to play a crucial role in senescence and metabolic collapse of erythrocytes and may act as a primary signal for cell removal in patients with hemolytic anemia (Schuster and Holzhütter, 1995; de Atauri et al, 2006).While usually an investigation of such transitions necessitates the construction of explicit kinetic models, our approach allows to draw quantitative conclusions about the stability of metabolic states in response to an increased ATP demand, occurring, for example, under conditions of osmotic or mechanic stress (Kodicek, 1986; Dariyerli et al, 2004). It is demonstrated that different metabolic states, each satisfying the flux balance equation and thermodynamic constraints, can nonetheless show drastic differences in the ability to ensure stability and maintain metabolic homeostasis.
As our method requires no detailed information about enzyme-kinetic rate equations and parameters and due to its computational simplicity it is applicable to large metabolic networks. In particular, as the construction of explicit kinetic model is usually not feasible, our method significantly extends previous approaches to metabolic robustness, often based on topological or stoichiometric considerations alone (Edwards and Palsson, 2000; Stelling et al, 2002; Deutscher et al, 2006; Tekir et al, 2006). We argue that dynamic aspects of metabolic networks are becoming more and more important in view of modern techniques like siRNA knockdowns or genetic modifications (Bailey, 1991; Becker et al, 2005) to modify the activity of individual enzymes in vivo. It has to be expected that such perturbations may give rise to fundamental changes in the dynamic behavior of the underlying network.
Results
The parameterization of metabolic states
A metabolic network is a set of coupled chemical reactions and transport processes. Neglecting spatial variations of the metabolite concentrations within the reactions compartments the time-dependent changes of the metabolite concentrations can be described by a set of differential equations of the form [Sdot]=Nν(S), where S denotes the m-dimensional vector of metabolite concentrations, N denotes the m × r-dimensional stoichiometric matrix and ν(S) denotes an r-dimensional vector of enzyme kinetic reaction rates. In the case of lacking or incomplete enzyme-kinetic data and assuming the existence of a stationary state S0, the differential equation can be interpreted as linear equation for the stationary reaction rates ν0=ν(S0). The mass balance equation Nν0=0 provides the conceptual foundation for current stoichiometry-based approaches to metabolic network analysis and brought forth a number of highly successful applications to determine the structure and function of metabolic networks (Varma and Palsson, 1994; Schuster et al, 1999; Stelling et al, 2002). Recently, the flux balance equation was supplemented with thermodynamic constraints, providing a link between feasible flux distributions and metabolite concentrations (Holzhütter, 2004; Henry et al, 2006; Kümmel et al, 2006; Hoppe et al, 2007).
However, the mass balance equation itself, along with its associated thermodynamic constraints, does not allow to draw any conclusions about the possible dynamics or potential instabilities of a metabolic state. To obtain information about essential aspects of the dynamics, we thus augment the mass balance equation with the first-order expansion of the differential equation. Given a metabolic system at a (possibly unknown and not necessarily unique) metabolic state, characterized by ν0 and S0, the system of differential equations can be approximated by a Taylor series expansion.
 |
The first term describes the steady-state properties of the system, as exploited by flux–balance analysis to constrain the stoichiometrically feasible flux distributions. Along similar lines, taking the next term of the expansion into account, the structure of the Jacobian matrix J constrains the possible dynamics of the system at each metabolic state.
Our method builds upon a statistical evaluation of the Jacobian matrix. Based on the formalism of structural kinetic modeling (Steuer et al, 2006), we construct a parametric representation of the Jacobian matrix, such that each element covers the comprehensive parameter space at a specific metabolic state. In particular, the Jacobian matrix can be written as the product of two matrices Λ and θxμ. The elements of the matrix Λ are fully specified by the metabolic state of the system. In addition, the (usually unknown) elements of the matrix θxμ specify the relative saturation of each enzyme with respect to its ligands and can be assigned to well defined intervals even when the explicit functional form of the rate equations is not known. In the following, these matrix elements are denoted by saturation parameters θmr, where r stands for the reaction saturated by metabolite m. A brief mathematical synopsis is given in Materials and methods.
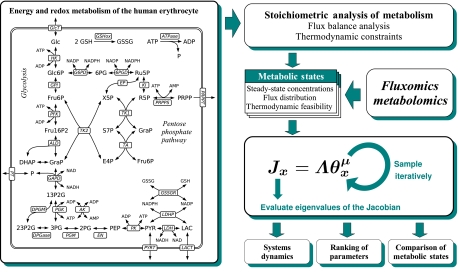
Evaluating the Jacobian matrix with respect to the (unknown) elements of the matrix θxμ then defines the spectrum or scope of dynamic behavior at the respective metabolic state. The proposed workflow is summarized in Figure 1. First, the stoichiometry and a metabolic state ν0 and S0 are specified, based on available experimental data and existing mathematical models. Second, an ensemble of Jacobian models is generated by assigning random values to the elements of θxμ, obeying the defined intervals. Evaluating the eigenvalues of the Jacobian matrix repetitively, allows to investigate and compare the scope of dynamic behavior under different preconditions, for example, suppressed or absent allosteric regulation. In this respect, especially the largest real part of the eigenvalues, denoted by λRemax, is of interest, as it relates to the slowest timescale of the system and, if positive, implies (local) instability of the metabolic state. The metabolic state is stable only if all eigenvalues have a negative real part (see also Materials and methods).
Figure 1.
Energy and redox metabolism of the human erythrocyte and the proposed workflow: the stoichiometry and the steady-state concentrations and fluxes are extracted from existing models and available experimental data. The Jacobian matrix is established and the intervals for the saturation parameters are specified according to available biological information and/or additional constraints of interest. The saturation parameters are sampled repeatedly and the eigenvalues of the Jacobian are evaluated. Abbreviations: Glc, glucose; Glc6P, glucose-6-phosphate; Fru6P, fructose-6-phosphate; Fru16P2, fructose 1,6-bisphosphate; GraP, glyceraldehydes-3-phosphate; DHAP, dihydroxyacetone phosphate; 13P2G, 1,3-bisphosphoglycerate; 23P2G, 2,3-bisphosphoglycerate; 3PG, 3-phosphoglycerate; 2PG, 2-phosphoglycerate; PEP, phosphoenolpyruvate; PYR, pyruvate; LAC, lactate; 6PG, 6-phosphoglycanate; Ru5P, ribulose-5-phosphate; Xul5P, xylulose-5-phosphate; Rib5P, ribose-5-phosphate; S7P, sedoheptulose-7-phosphate; E4P, erythrose-4-phosphate; PRPP, phosphoribosyl pyrophosphate; GSH, reduced glutathione; GSSG, oxidized glutathione; GlcT, glucose transport; HK, hexokinase; GPI, glucose-6-phosphate isomerase; PFK, phosphofructokinase; ALD, aldolase; TPI, triosephosphate isomerase; GAPD, glyceraldehyde phosphate dehydrogenase; PGK, phosphoglycerate kinase; DPGM, 2,3-bisphosphoglycerate mutase; DPGase, 2,3-bisphosphoglycerate phosphatase; PGM, 3-phosphoglycerate mutase; EN, enolase; PK, pyruvate kinase; LDH(P), lactate dehydrogenase; Lact, lactate transport; AK adenylate kinase; G6PD, glucose-6-phosphate dehydrogenase; 6PGD, 6-phosphogluconate dehydrogenase; GSSGR, glutathione reductase; EP, ribose phosphate epimerase; KI, ribose phosphate isomerase; TK, transketolase; TA, transaldolase; PRPPS, phosphoribosylpyrophosphate synthetase; PRPPT, phosphoribosylpyrophosphate transport.
The role of regulation
Allosteric regulation is one of the main mechanisms to control enzyme activity. Since allosteric regulation occurs within metabolic networks as feedback or feed-forward loops, it operates network-wide and affects the dynamic properties at a systems level. The presented approach is used to analyze the effects of allosteric regulation on stability in a systematic way. Two sets of models under different preconditions are created, both corresponding to the normal in vivo conditions of the erythrocyte (see Figure 1 for a schematic representation of the energy and redox metabolism of the human erythrocyte and the abbreviations used). Within the first set of models Cnoreg all saturation parameters associated with allosteric effectors are fixed to zero, corresponding to absence of regulatory interactions. In addition, a second set Creg is constructed by assigning all saturation parameters, including those for allosteric regulation, to their respective intervals (see Materials and methods and the Supplementary information for details).
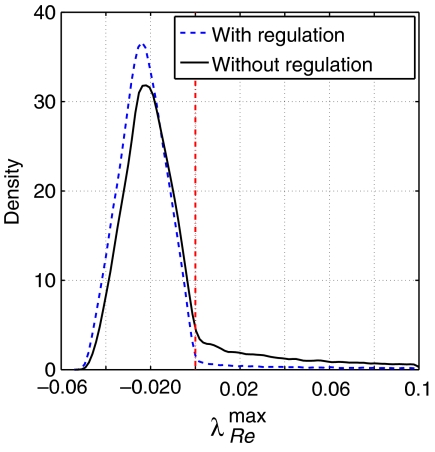
Each Jacobian model is evaluated according to its spectrum of eigenvalues, with λRemax>0 implying instability of the metabolic state. In the case of absence of allosteric regulation, corresponding to the set Cnoreg, the proportion of dynamically stable models is approximately 81% (see Figure 2 for the estimated probability density functions of the largest real part λRemax). Thus, although vast majority of the models are stable, the proportion of unstable models cannot be neglected. As dynamic stability is mandatory for the existence of the metabolic state, it indicates a substantial risk for the unregulated network to be driven out of the observed steady state when changes of the binding constants for the substrates occur for genetic or pharmacological reasons.
Figure 2.
The probability density function of the largest real part λRemax within the spectrum of eigenvalues for both sets Cnoreg and Creg. A value λRemax>0 implies instability. Allosteric regulation significantly suppresses the number of unstable models. Interestingly, the probability density function for Creg does not show a shift toward more negative λRemax, but rather an increase at the peak.
Within the whole set, no (Jacobian) model is found exhibiting more than one eigenvalue larger than zero, suggesting that the occurrence of a Hopf bifurcation is, at least, rare under the precondition of suppressed allosteric regulation. Since a Hopf bifurcation indicates the transition to sustained oscillation, such dynamical behavior seems unlikely under these conditions. Looking at the set Creg, thus including allosteric regulation, the proportion of stable models shifts to 91%, which is significantly higher than in case of suppressed regulation (see Materials and methods). Similar observations were made by Ni and Savageau (1996b), where additional regulation was introduced to a model to stabilize the steady state. Note that here regulation is only defined qualitatively, that is, the actual strength of each regulatory interaction is chosen randomly and varies between the individual samples. Nonetheless, even without specific fine-tuning of parameters, allosteric regulation results in a higher proportion of stable networks. This is presumably evolutionary advantageous, since a larger parameter subspace corresponding to stable models increases the flexibility to optimize parameter towards additional requirements other than stability.
Within the set of unstable models, 592 out of 106 samples in Creg have two eigenvalues greater than zero, in each case exhibiting complex conjugate imaginary parts. A smaller fraction (41 samples) shows three eigenvalues larger than zero, pointing to bifurcations of higher co-dimension. Although restricted to a very small region in parameter space, allosteric regulation thus expands the scope of dynamical behavior by increasing the region in parameter space where oscillatory or more complex dynamics can be expected.
Furthermore, we tested if the observed increase is specific for the actual set of regulation parameters or if it can be achieved by any randomly chosen set of allosteric regulation parameters. To this end, instead of the actual regulation parameters, 10 putative allosteric regulations were selected randomly and the increase in the percentage of stable models was recorded. Most random sets (∼85%) of regulation parameters lead to a decrease in the percentage of stable models, demonstrating that not every possible arbitrary allosteric regulation has a positive effect on stability.
The ranking of parameters
Stability of a metabolic steady state is an emergent systemic property that is brought about by the kinetic properties of all enzymes. Nevertheless, changes in the kinetic parameters of individual enzymes may have quite differential impact on the stability of a given steady state. To evaluate and compare the degree of influence of individual parameters and reactions on the stability and response to perturbations, we rank the parameters according to several objective measures. Three distinct measures are used and compared with each other, namely the (Pearson) correlation coefficient, the mutual information and the Kolmogorov–Smirnov test (KS test) (see Materials and methods for explicit definitions).
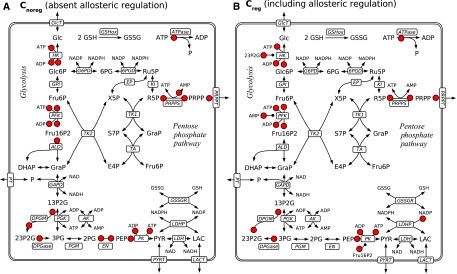
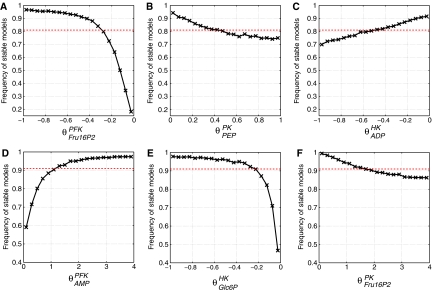
All three measures were evaluated for all saturation parameters for both sets of models Cnoreg and Creg. Although the detailed ranking of the parameters is not identical, it is still consistent with respect to all different measures. Figure 3 depicts the significant parameters for both sets of models Cnoreg and Creg. Figure 4 exemplifies the influence of the most highly ranked parameters on the stability of the metabolic state. The percentage of stable models within the parameter space as a function of selected saturation parameters is shown. For a more detailed discussion and comparison of the different rankings see also the Supplementary information.
Figure 3.
All significant saturation parameters (red dots) for both sets of models Cnoreg (absent allosteric regulation, left plot) and Creg (included allosteric regulation, right plot). Allosteric regulation by a metabolite, which is neither substrate nor product is marked by a small circle instead of an arrowhead. For brevity, only the ranking according to the correlation coefficient is considered.
Figure 4.
Relationships between selected saturation parameters and the probability of stable models. Shown is the case of suppressed allosteric regulation (A–C) and for included allosteric regulation (D–F). In each case, a single saturation parameter is fixed while all others parameters are chosen randomly. The dotted red line marks the overall averages, 81% in the case of Cnoreg and 91% in the case of Creg. The plots D and F show saturation parameters associated with allosteric regulation.
The ranking of parameters allows for several significant conclusions about the role of regulation within the metabolic network. First, almost all high-ranked parameters are associated with reactions involved in ATP production or consumption. Especially the PFK, HK and PK play an important role in stabilizing the network. Interestingly, evaluating the set Cnoreg reveals that, although no additional information about putative sites for allosteric regulation is included, mainly those parameters are ranked very high that affect reactions that are known to be allosterically regulated (see Materials and methods for a statistical verification of this assertion). We point out that for the construction of Cnoreg, only the stoichiometry and the metabolic state under normal conditions were used. This emphasizes the usefulness of our approach to analyze the metabolic networks that are not as well studied as the one of erythrocytes, and where detailed information about allosteric regulation is not available.
Several more observations can be made from the ranking of the parameters. First, the high-ranked parameters almost all belong to enzymes of the glycolytic pathway. Intriguingly, kinetic alterations of the allosterically regulated enzyme G6PD, which is known to control the flux through the pentose phosphate pathway, does not show significant impact on stability. This corresponds with results from de Atauri et al (2006), obtained from an explicit kinetic model. The authors show that the metabolic network breaks down for low concentrations of the glycolytic enzymes, whereas such a transition to instability does not occur if the enzymes of the pentose phosphate pathway are at very low concentrations. Second, all parameters associated with 23P2G as an allosteric effector are relatively low ranked. This indicates that the main function of these regulatory mechanisms is not to maintain or achieve stability.
Comparison with the explicit model
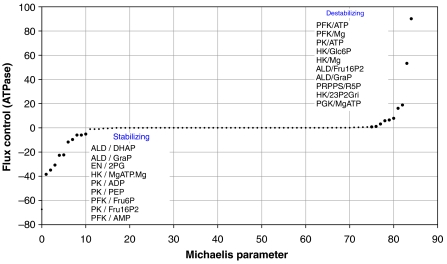
The availability of a comprehensive and well-established mathematical model of the erythrocyte metabolism (Schuster and Holzhütter, 1995) allows to validate our method by comparing the ranking of saturation parameters with results of metabolic control analysis (MCA; see Heinrich and Schuster, 1996). As metabolic instability of the erythrocyte may occur if the energy demand exceeds the glycolytic ATP production, we study the impact that changes in the kinetic parameters of the various enzymes of the network have on ATP utilization. The relative change of the rate of ATP utilization (νATPase) elicited by a (small) change of the Michaelis constant characterizing affinity of metabolite M to enzyme E is given by the flux control coefficient.
 |
Note that negative values of the flux coefficient indicate that decreasing value of the Michaelis constant (corresponding to increasing saturation) increases the rate of ATP production and thus stabilizes the steady state. Calculating the flux control coefficient for all 85 Michaelis constants occurring in the rate laws of the mathematical model and ranking them in ascending order reveals that only 10 affinity parameters each contribute significantly to the energetic stabilization and destabilization of the network (Figure 5). Changes in the Michaelis constants for binding of AMP and ATP to the phosphopfructokinase (PFK) have by far the highest impact on the ATP production. This underlines the well-known central regulatory importance of this enzyme for red cell glycolysis. Remarkably, the set of 20 regulatory most relevant Michaelis constants determined by MCA of the basis of the full mathematical model comprises all saturation parameters identified by our random sampling method.
Figure 5.
Values of the flux control coefficient defined by equation (2) plotted in ascending order for the 85 Michaelis constants contained in the rate laws of kinetic model. Bold points indicate the flux control coefficients for the explicitly depicted 20 Michaelis constants that upon decrease (i.e., increase of saturation) exert the most stabilizing and destabilizing influence on ATP supply, respectively.
Robustness of metabolic states
As yet our analysis has focused on the analysis of a single metabolic state corresponding to the normal in vivo conditions of the erythrocyte. However, the energy metabolism of this cell has to cope with large fluctuations of the ATP demand as the activity of the Na/K-ATPase, accounting for about 70% of the total ATP utilization, is greatly enhanced under conditions of osmotic stress (Dariyerli et al, 2004) or mechanic stress exerted during passage of the cell through thin capillaries (Kodicek, 1986). Moreover, because of lacking de novo protein synthesis the erythrocyte is extremely susceptible to enzyme deficiencies which typically result in an impairment of glycolytic ATP production and subsequent break down (hemolysis) of the cell (Jacobasch and Rapoport, 1996).
To demonstrate the discriminatory power of our approach to detect changes in the stability properties of metabolic states, we thus consider a second metabolic state of the erythrocyte, characterized by an increased energy demand. To this end, we use the kinetic model to calculate fluxes and metabolite concentrations at a sixfold higher energetic load as compared with the normal reference state. Switching from the normal in vivo state (kATPase=1.6 mM/h) to the new steady state at increased energetic load (kATPase=10 mM/h), the glycolytic flux increases from 1.5 to 2.33 mM/h (=155%); whereas the ATP concentration decreases from 1.6 to 0.56 mM(=35%). These relative changes are in excellent agreement with experimental data (160% increase of glycolytic flux at 35% decrease of ATP) obtained by successively decoupling glycolysis from ATP consumption by means of arsenate titrations (Ataullakhanov et al, 1981).
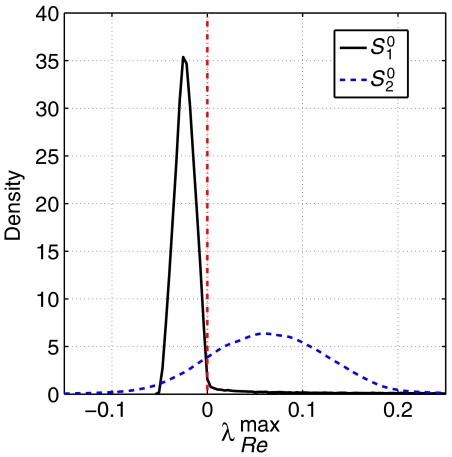
The parameterization of the second state S20 is performed as described before, with all saturation parameters, including allosteric regulation, sampled randomly from their respective intervals. Figure 6 depicts the resulting distribution of the largest real eigenvalue λRemax within the spectra of eigenvalues, as compared to the distribution under normal conditions (state S10). While for normal in vivo conditions, the proportion of stable Jacobian models was approximately 91%; this value drops drastically to only about 13.2% for the second state S20. This is in accordance with our earlier observation that energy related reactions are most crucial with respect to stability, as well as with the fact that in the detailed kinetic model of Schuster and Holzhütter (1995) the system is able to compensate an increased energy load only up to an upper critical value, but breaks down if the energy demand is increased any further. We emphasize that both states cannot be discriminated based on stoichiometric considerations alone: Both satisfy the flux balance equation and are consistent with thermodynamic constraints.
Figure 6.
The probability density functions of λmaxRe for two metabolic states. Under increased energy load (S20) a significantly higher percentage of unstable models is observed, as compared with normal conditions (S10). In both cases allosteric regulation is included.
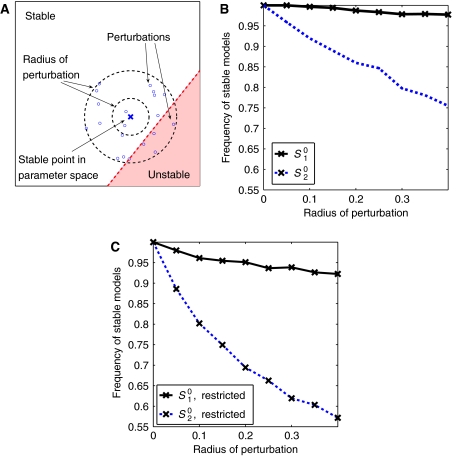
The proportion of unstable models alone, evaluated over the comprehensive parameter space of a metabolic state, does not necessarily imply actual instability of the respective flux distribution. However, the proportion of unstable models has significant consequences for the ability of the system to maintain the considered metabolic state at perturbations of enzyme-kinetic parameters (Morohashi et al, 2002). To evaluate the robustness properties of both states quantitatively, we consider two distinct scenarios: First, for both metabolic states random instances of stable models are repeatedly selected from the parameter space and the set of parameters is subsequently perturbed within a given radius. The percentage of perturbations that remain stable, as a function of the magnitude or radius of the perturbations, then serves as a quantitative measure of robustness. See Figure 7A for a schematic representation. Second, to make the results for both metabolic states more comparable, the parameter space from which random instances of models are selected is restricted to a small interval with λRemax∈[0, −0.01] for both states. Again each parameter set is perturbed with increasing radius and the frequency with which a given magnitude of perturbations leads to instability is recorded. The results are shown in Figure 7.
Figure 7.
The robustness of the two metabolic states. A stable point in parameter space is chosen randomly. Within a given radius the point is perturbed several times. Each such perturbation is checked for stability (A). A thousand stable points were chosen randomly with 10 perturbations each. A radius of r allows the perturbation to vary within θ±rθ, where θ is the initially samples value (B). In the second scenario, denoted as ‘restricted', only stable states close to the instability were considered λmaxRe∈[−0.01, 0] (C).
Clearly, for both metabolic states the probability that a perturbation results in a loss of stability increases with increasing magnitude of perturbations. However, starting (by construction) with initially 100% of stable models, the fraction of models that become unstable increases significantly faster for the state S20. This effect is even more pronounced in the second scenario. Here, the stable models for both metabolic states are initially restricted to similar real parts within the spectra of the eigenvalues, and thus to similar distances to the bifurcation. Nonetheless, a perturbation of the (initially stable) metabolic state S20 is much more likely to result in a transition to instability than corresponding perturbations of the normal state S10. In this sense, the in vivo metabolic state S10, and concomitantly also its observed that flux distribution is more robust than the second state S20. We emphasize again that our quantification of robustness does not involve any knowledge about the explicit functional form of the rate equations or kinetic parameters. Nonetheless, different metabolic states can be clearly differentiated, based only on information about metabolite concentrations and associated flux patterns. In this respect, our approach gives valuable insights on the qualitative and quantitative dynamic behavior of metabolic states that cannot be obtained by considering the stoichiometric balance equation alone and is also applicable to situations where detailed knowledge about the explicit rate equations is not yet available.
Discussion and conclusions
A central goal of metabolic regulation is homeostasis, that is the maintenance of a stable quasi-stationary state under largely varying external conditions. In this work, we present a kinetic-free approach that enables the identification of those enzymes and putative allosteric regulators having the largest impact on the stability of experimentally observed metabolic steady states. Our analysis was focused on three different aspects: first, the role of allosteric regulation was elucidated by comparing the dynamic behavior of the network under suppressed and allowed allosteric regulation. The proportion of stable models is significantly increased by allosteric regulation, showing that feedback regulation has a stabilizing effect. Second, three statistical measures were introduced to quantify the influence of enzymatic reactions and saturation parameters on stability in a systematic way. The parameters were ranked according to these measures. Intriguingly, almost all high-ranked parameters are involved in one of the three reactions HK, PFK or PK, corresponding to those reactions that are indeed highly regulated and almost irreversible. We note that these results also hold when knowledge about allosteric regulation and irreversibility is not presupposed in the initial analysis. Third, we provided a quantitative measure to analyze different metabolic states with respect to their robustness towards perturbations in parameters. We compared the in vivo state with a second metabolic state, corresponding to an increased energy demand of the cell. With respect to robustness, the in vivo state is clearly superior in accordance with the fact that high energy demand will lead to a metabolic collapse of the red blood cells.
Our approach is essentially based on the knowledge of stoichiometry and metabolic state of the system. While detailed kinetic models are available for only very few metabolic networks, knowledge of metabolite concentrations and flux distributions becomes increasingly experimentally accessible (Fernie et al, 2004; Goodacre et al, 2004; Sauer, 2004). In this respect, we have demonstrated that different metabolic states, only characterized by a flux distribution and metabolite concentrations, are indeed associated with a unique spectrum of dynamic capabilities and can be differentiated based on their stability properties. As our method specifically samples the parameter space associated with a given metabolic state, it can be directly related to experimental observations and thus improves methods based on a straightforward sampling of kinetic parameters within an explicit kinetic model (von Dassow et al, 2000).
In particular, we expect that recent efforts for biotechnological modifications of metabolic systems will concomitantly result in fundamental changes in the dynamic behavior of these networks. While a desired flux distribution might be stoichiometrically feasible, unanticipated changes in dynamic properties can lead to a failure of network function. The weak preconditions and the semi-automatic and straightforward manner of its implementation thus make our approach a suitable starting point to elucidate and detect changes in dynamic properties of metabolic networks for which the construction of detailed kinetic models is not yet possible.
Materials and methods
Models of the human erythrocyte
To exemplify and validate our approach, we mainly draw upon a previously published model of Schuster and Holzhütter (1995), consisting of 30 metabolites and 31 reactions (see Figure 1 for a schematic representation). The model was slightly modified to account for free inorganic phosphate and additional transport reactions for the educt glucose, the intermediate phosphate and the end products phosphoribosyl pyrophosphate, pyruvate and lactate. Mg-complexes were omitted. All reactions, except ATPase, GSHox and PRPPT, were treated as reversible. As ATPase and GSHox are merged overall reactions describing energy consumption and oxidative load, product inhibition for these reactions was not included, that is, ADP and GSSG have no influence on ATPase and GSHox, respectively.
The kinetic model was used to calculate the steady metabolic state of the human erythrocytes under normal in vivo conditions (state S10). Metabolite concentrations and flux values are given in the Supplementary information. In addition to the normal in vivo state S10, a second steady-state S20 was calculated, corresponding to an increased energy demand of the cell. Analogous simulations were performed previously to explore senescence and metabolic collapse of erythrocytes (Schuster and Holzhütter, 1995; de Atauri et al, 2006); see also Tekir et al (2006) for an analysis of red blood cell enzymopathies based on stoichiometric analysis.
Structural kinetic modeling
Our analysis is based on a decomposition of the Jacobian matrix of a metabolic system at a state S0 into a product of two matrices. Given a metabolic system consisting of m metabolites and r reactions, the set of differential equations S=Nν(S), which describe the time-dependent behavior of all metabolite concentrations Si(t) can be rewritten as
 |
where Si0 and νj0=νj(S0) denote the metabolic state at which the system is to be evaluated. Using the definitions given in (3) and the variable transformation xi(t)=Si(t)/Si0, the Jacobian with respect to the normalized variables x is
 |
The scaled Jacobian Jx is related to the original Jacobian by a simple similarity transformation and it is fully specified by the parameter matrices Λ and θμx. The elements of Λ describe the time scales of the system, as specified by the metabolic state S0 and ν(S0). The (usually unknown) elements of θμx are defined as the normalized derivatives of the reaction rates and, analogous to the scaled elasticity coefficients of MCA, denote the effective kinetic order or normalized saturation of each reaction with respect to its substrates. Each element θSv is constrained to the interval of [0,1] if the metabolite S is a substrate and [0,−1] if S is a product of the reaction ν(S). Additional non-zero terms arise from allosteric regulation. Allosteric regulation is included by assigning the corresponding parameter to intervals, such that θSν∈[0,−n] for inhibition and θSν∈[0, n] for activation of a reaction ν by S, respectively. A detailed derivation is given elsewhere (Steuer et al, 2006).
Statistical sampling of the parameter space
The stability and possible dynamics of the metabolic network are evaluated at a given metabolic state, characterized by metabolite concentrations S0 and fluxes ν(S0). The vector of reaction rates satisfies the steady-state condition Nν(S0)=0 and is described by r-rank(N)-free parameters. The vector of metabolite concentrations S0 is restricted by thermodynamic constraints (Henry et al, 2006; Kümmel et al, 2006) and approximated by values adapted from Schuster and Holzhütter (1995). The metabolic state fully specifies the matrix Λ. To evaluate the dynamic capabilities at a given metabolic state, the non-zero elements of the matrix θμx are sampled from their predefined intervals (Wang et al, 2004; Steuer et al, 2006), while the elements of the matrix Λ are restricted to the respective metabolic state. The schematic workflow is shown in Figure 1.
Specifically, each reversible enzyme-kinetic reaction νi(S) is split into a forward νi+(S) and backward rate ν−(S) and described by the overall steady-state flux νi0, the flux ratio γ=ν−(S0)/ν+(S0), the steady-state S0, as well as by a set of saturation parameters θsiv. Although the method does not presuppose a specific functional form of the rate equations, we illustrate the parameterization using a generic form of enzyme-kinetic rate equations, such as
where f (A, B, P, Q) denotes a first order polynomial. The reaction is characterized by the net flux ν0, the steady-state concentrations A0, B0, C0, D0, as well as the flux ratio γ=ν−/ν+, relating to the (often accessible) equilibrium constant Keq. The four unknown saturation coefficients apply to forward and backward rate separately, obeying the relationships θAν+∈[0, 1] and θAν−=θAν+−1∈[0,−1] for substrates and θPν+∈[0, −1] and θPν−=θAν++1∈[0, 1] for products, respectively.
The model of the erythrocyte is parameterized by 87 saturation parameters for substrate and product dependencies of each reaction, as well as 10 additional parameters corresponding to allosteric regulation. See Supplementary information for a detailed listing. The parameters are denoted with reactions (superscript) and substrate (subscript) respectively, that is, θFru6PPFK denotes the dependence of the phosphofructokinase (PFK) on fructose-6-phosphate (Fru6P).
Stability and dynamics of metabolic states
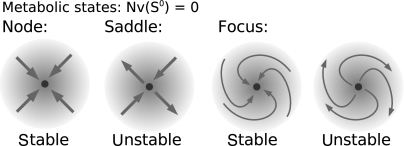
Our method is based upon a statistical evaluation of the Jacobian matrix. In particular, a metabolic state that satisfies the steady-state condition Nν(S0)=0 must not necessarily be stable. Rather, its dynamic stability is determined by the eigenvalues of the Jacobian at the respective state. Each eigenvalue describes the behavior of the system after an (infinitesimal) perturbation of the concentrations (Heinrich and Schuster, 1996). The possible dynamics in the vicinity of a metabolic state are schematized in Figure 8: The metabolic state can either be (i) a stable (attracting) steady state, characterized by a largest real part of the eigenvalues λmaxRe<0 (ii) an unstable (repelling) state, characterized by a positive largest real part λmaxRe>0 within the spectrum of eigenvalues, or (iii) a stable (attracting) focus, characterized by non-zero (complex conjugate) imaginary parts λmaxRe±λmaxIm with λmaxRe<0 and λmaxIm≠0, (iv) an unstable focus, characterized by a positive real part λmaxRe>0 and complex conjugate eigenvalues λmaxIm ≠0.
Figure 8.
The stoichiometric balance equation Nν0=0 does not imply actual stability of a metabolic state. Although each of the depicted scenarios fulfills the steady-state condition, the dynamic behavior can be classified as (i) stable node, (ii) unstable saddle (iii) stable focus, corresponding to damped transient oscillations and (iv) unstable focus, corresponding to (undamped) transient oscillations (Heinrich and Schuster, 1996).
Of particular interest are also transitions between the scenarios (bifurcations), most importantly the Hopf bifurcation, where a pair of complex conjugate eigenvalues cross the imaginary axis (stable → unstable focus) and bifurcations of the saddle-node type, where the largest real part within the eigenvalues crosses the imaginary axis (stable node → unstable saddle). Further types of bifurcations are discussed in Steuer et al (2006). We emphasize that stability does not imply constancy of a metabolic state. Rather, local dynamic stability is mandatory for the existence of the state, but all actual states will fluctuate around their average values (Steuer et al, 2003). All reported results are robust against small deviations of metabolite concentrations and flux values, that is, an analysis with small alterations of the metabolic state under normal conditions yields identical results.
A simple example
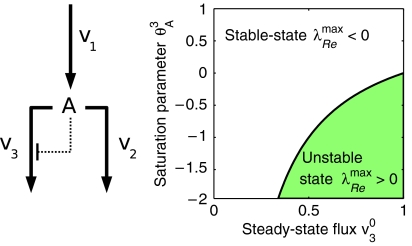
To illustrate our approach, we briefly consider the simple example pathway depicted in Figure 9.
Figure 9.
Left: A simple example, consisting of r=3 reactions and m=1 metabolite. Right: The dynamic behavior of the pathway as a function of the metabolic state ν30 and the (unknown) saturation parameter.
Within our approach, not assuming any further knowledge of the explicit rate equations and parameters, the system is parameterized by the matrices Λ and θAμ
 |
where Λ defined the metabolic state of the system, constraint by ν10=ν20+ν30. For simplicity, we assume linear dependence of ν2(A) on its substrate A, and thus θAμ2=1. The parameter θAμ3∈[1−n, 1] includes possible non-linear inhibition of ν3(A) by its substrate A. As the units of times and concentrations are arbitrary, we set ν10=1 and A0=1 without loss of generality. The Jacobian at an observed metabolic state (specified by the matrix Λ) is thus given as
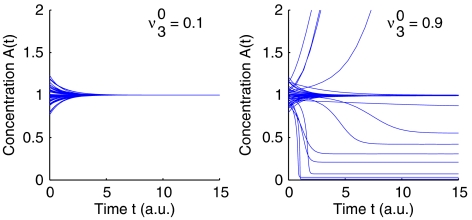
Figure 9 shows the region of stability of the observed state ν30 versus the (unknown) parameter θAμ3. More importantly, the observed metabolic state, here only characterized by ν30, restricts the stability properties of the state. For small flux the observed state is always stable, that is, there exists no set of parameters such that the state is unstable. However for high flux ν30 the system might lose stability and is stable only in a small region of the (unknown) parameter space. This behavior is again exemplified in Figure 10, using explicit differential equations. Starting in the vicinity of the metabolic state {A0, ν30}, all other parameters are chosen randomly from the comprehensive parameter space. For small ν30 (left plot), the system will always decay back to the state. Hence, the steady state remains stable, independent of the actual value of θ3A. However, for large ν30 (right plot) the probability of instability increases. For some perturbations of θA3 the steady state becomes unstable, i.e. the initial state cannot be restored. The systems transit into a new stable steady state with concentrations of A different from the initial value A=1. In this sense, the observed metabolic state puts constraints on the possible dynamics and allows to quantify the existent size of unstable regions in parameter space. The perturbation analysis shows that the metabolic state with small ν30 is more robust against changes in parameters than a metabolic state with large ν30.
Figure 10.
The time course of the concentration A(t) using explicit kinetic simulations. Starting at the vicinity of a metabolic state, the observed flux distribution puts constraints on the possible dynamics of the pathway. For small ν30 (left plot), the system will always decay back to the state. For large ν30 (right plot) the probability of instability increases.
The role of regulation
The evaluation of models (Jacobians) for Creg and Cnoreg was repeated 103 times and the percentage of unstable instances recorded. In both cases, the variance of the values, due to finite sampling effects, was estimated numerically. A t-test was used to test the average values for both cases Creg and Cnoreg against each other. The null hypothesis that the expectation value in case of allowed allosteric regulation is equal or lower than in case of suppressed allosteric regulation is rejected with a P-value below 10−320. So allosteric regulation significantly increases the frequency of stable models.
Ranking of parameters
To assess the relative impact of enzyme-kinetic parameters on the stability properties of a given metabolic state, we employed and compared several measures of dependency.
The most common choice to detect dependencies between variables is the (Pearson) correlation coefficient r, defined as
 |
where xi and yi are n realizations of the random variables X and Y. Although the Pearson correlation only detects linear dependencies, it holds the advantage that its sign specifies whether a parameter must be increased or decreased to obtain a higher percentage of stable models. Nonetheless, the Pearson correlation suffers from several drawbacks, such as sensitivity to non-Gaussian and skewed distributions, making more elaborate measures necessary (Kumar and Shoukri, 2007).
A more general measure of dependency is given by the mutual information (Shannon, 1948), defined as
where H(X)=∑kpk(x) logpk(x) denotes the entropy of the variable X, measured from a binned histogram such that each bin occurs with probability pk. The entropy H(X,Y) denotes the joint entropy of X and Y. Among its main advantages is that the mutual information is zero if and only if both variables are statistically independent. Evaluating the mutual information between network parameters and the resulting largest real part of the eigenvalue λRemax thus accounts for arbitrary nonlinear dependencies and does not presuppose Gaussian or uniform distribution of the parameters. A detailed account of its numerical estimation is given elsewhere (Steuer et al, 2002).
Based on a slightly different concept, the KS test is used to test for the equality of two distributions. The null hypothesis in the context of our analysis is as follows: if a saturation parameter has no impact on the stability of the metabolic system, then its distribution within the restricted subset of stable models equals (in a statistical sense) its initial distribution for the comprehensive set of models. On the other hand, if the distribution of a parameter within the restricted set of stable models shows a strong deviation from the initial distribution, a significant dependency can be expected. In this sense, the KS test determines whether two random variables X and Y have the same distribution. The cumulative frequencies FX and FY and the maximal difference
are calculated. If the test statistic D is greater than the critical value for the sample size, the null hypothesis that both distributions are equal is rejected. Since D is always identically distributed, the KS test is independent of the distribution of X and Y. If the test rejects the null hypothesis, given a sufficiently small P-value, the parameter under consideration has significant impact on stability.
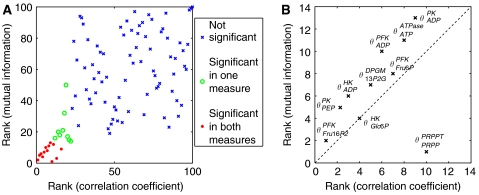
All measures yielded consistent results, as depicted in Figure 11.
Figure 11.
The ranking according to the correlation coefficient is plotted versus the ranking according to mutual information in case of suppressed allosteric regulation (A). For the significant parameters (red dots) the two measures give consistent result. The top-ranking parameters from a total of 87 are shown in (B). The outlier θPRPPPRPPT is caused by nonlinear dependencies between θPRPPPRPPT and λRemax. Note that θPRPPPRPPT is still high-ranked under both measures.
Significance of ranking
To test for the significance of the correlation coefficient and the mutual information, we employed a permutation test: the values of λRemax were randomly permuted in order to abolish any relationship between the saturation parameters and λRemax. This yielded mean values of the correlation coefficient and the mutual information close to zero (<5 × 10⁻⁵) and standard deviation of 3.1 × 10⁻³ and 2.5 × 10⁻⁴, respectively. The correlation coefficient and the mutual information for the high-ranked parameters are indeed significantly larger than those obtained in case of totally unrelated saturation parameters.
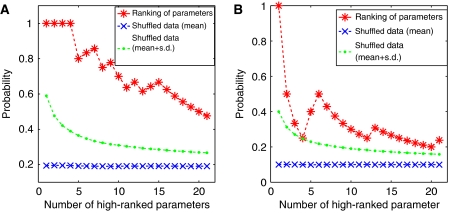
To verify the assertion that there is an enrichment of actual feedback parameters in the top-ranking parameters, we conducted two statistical tests (i) for the ensemble of models with absent regulation (Cnoreg), we verify that high-ranking parameters are primarily associated with reactions that are actually allosterically regulated (PK, PFK, PK, G6PD and 6PDG). To this end, we record the fraction of parameters associated with regulated reactions within the top k-ranked parameters. This number is then compared (statistically) to the number that must be expected if the high-ranking parameters are indeed randomly distributed across all reactions. The results are depicted in Figure 12A (as a function of k) and show a clear significant enrichment of parameters associated with regulated reactions among the top-ranking parameters; (ii) for the ensemble of models including allosteric regulation (Creg), we evaluate if regulation parameters are statistically overrepresented in the set of top-ranking parameters. Again, we record the expected number of regulation parameters within the k top-ranking parameters, based on a purely random distribution of parameters. This value is compared with the actual number of regulation parameters within the set of top-ranked parameters. The result is again significant and depicted in Figure 12B.
Figure 12.
Probability of a parameter among the high-ranked parameters to belong to a special subset of parameters (for Cnoreg: parameters that correspond to allosterically regulated reactions (A); for Creg: regulation parameters (B)). On the x-axis the number of parameters that are considered to be high ranked is shown (always beginning at the topmost). The results for the rankings given by Cnoreg and Creg are denoted by the red stars. The blue crosses show the results for shuffled rankings.
Implementation
All calculations were made using MATLAB, Version 7.3.0.298. The code is available upon request.
Supplementary Material
Supplementary Information
Acknowledgments
The work of SB was funded by the systems biology initiative of the Federal Ministry of Education and Research, Grant Nr 0313078. JS is supported by the GoFORSYS project funded by the Federal Ministry of Education and Research, Grant number 0313924.
References
- Ataullakhanov FI, Vitvitsky VM, Zhabotinsky AM, Pichugin AV, Platonova OV, Kholodenko BN, Ehrlich LI (1981) The regulation of glycolysis in human erythrocytes the dependence of the glycolytic flux on the ATP concentration. Eur J Biochem 115: 359–365 [DOI] [PubMed] [Google Scholar]
- Bailey JE (1991) Toward a science of metabolic engineering. Science 252: 1668–1675 [DOI] [PubMed] [Google Scholar]
- Becker J, Klopprogge C, Zelder O, Heinzle E, Wittmann C (2005) Amplified expression of fructose 1,6-bisphosphatase in Corynebacterium glutamicum increases in vivo flux through the pentose phosphate pathway and lysine production on different carbon sources. Appl Environ Microbiol 71: 8587–8596 [DOI] [PMC free article] [PubMed] [Google Scholar]
- Dariyerli N, Toplan S, Akyolcu MC, Hatemi H, Yigit G (2004) Erythrocyte osmotic fragility and oxidative stress in experimental hypothyroidism. Endocrine 25: 1–5 [DOI] [PubMed] [Google Scholar]
- de Atauri P, Ramírez MJ, Kuchel PW, Carreras J, Cascante M (2006) Metabolic homeostasis in the human erythrocyte: in silico analysis. Biosystems 83: 118–124 [DOI] [PubMed] [Google Scholar]
- Deutscher D, Meilijson I, Kupiec M, Ruppin E (2006) Multiple knockouts analysis of genetic robustness in the yeast metabolic network. Nat Genet 38: 993–998 [DOI] [PubMed] [Google Scholar]
- Edwards JS, Palsson BO (2000) Robustness analysis of the Escherichia coli metabolic network. Biotechnol Prog 16: 927–939 [DOI] [PubMed] [Google Scholar]
- Fernie AR, Trethewey RN, Krotzky AJ, Willmitzer L (2004) Metabolite profiling: from diagnostics to systems biology. Nat RevMol Cell Biol 5: 763–769 [DOI] [PubMed] [Google Scholar]
- Goodacre R, Vaidyanathan S, Dunn WB, Harrigan GG, Kell DB (2004) Metabolomics by numbers: acquiring and understanding global metabolite data. Trends Biotechnol 22: 245–252 [DOI] [PubMed] [Google Scholar]
- Heinrich R, Schuster S (1996) The Regulation of Cellular System. New York: Chapman & Hall [Google Scholar]
- Henry CS, Jankowski MD, Broadbelt LJ, Hatzimanikatis V (2006) Genome-scale thermodynamic analysis of Escherichia coli metabolism. Biophys J 90: 1453–1461 [DOI] [PMC free article] [PubMed] [Google Scholar]
- Holzhütter HG (2004) The principle of flux minimization and its application to estimate stationary fluxes in metabolic networks. Eur J Biochem 271: 2905–2922 [DOI] [PubMed] [Google Scholar]
- Holzhütter HG, Jacobasch G, Bisdorff A (1985) Mathematical modelling of metabolic pathways affected by an enzyme deficiency a mathematical model of glycolysis in normal and pyruvate-kinase-deficient red blood cells. Eur J Biochem 149: 101–111 [DOI] [PubMed] [Google Scholar]
- Hoppe A, Hoffmann S, Holzhütter HG (2007) Including metabolite concentrations into flux balance analysis: thermodynamic realizability as a constraint on flux distributions in metabolic networks. BMC Syst Biol 1: 23. [DOI] [PMC free article] [PubMed] [Google Scholar]
- Jacobasch G, Rapoport SM (1996) Hemolytic anemias due to erythrocyte enzyme deficiencies. Mol Aspects Med 17: 143–170 [DOI] [PubMed] [Google Scholar]
- Joshi A, Palsson BO (1989) Metabolic dynamics in the human red cell. Part i–a comprehensive kinetic model. J Theor Biol 141: 515–528 [DOI] [PubMed] [Google Scholar]
- Kodicek M (1986) Enhanced glucose consumption in erythrocytes under mechanical stress. Cell Biochem Funct 4: 153–155 [DOI] [PubMed] [Google Scholar]
- Kumar P, Shoukri M (2007) Copula based prediction models: an application to an aortic regurgitation study. BMC Med Res Methodol 7: 21. [DOI] [PMC free article] [PubMed] [Google Scholar]
- Kümmel A, Panke S, Heinemann M (2006) Putative regulatory sites unraveled by network-embedded thermodynamic analysis of metabolome data. Mol Syst Biol 2; 2006.0034. 10.1038/msb4100074 [DOI] [PMC free article] [PubMed] [Google Scholar]
- McIntyre LM, Thorburn DR, Bubb WA, Kuchel PW (1989) Comparison of computer simulations of the f-type and l-type non-oxidative hexose monophosphate shunts with 31p-nmr experimental data from human erythrocytes. Eur J Biochem 180: 399–420 [DOI] [PubMed] [Google Scholar]
- Morohashi M, Winn A, Borisuk M, Bolouri H, Doyle J, Kitano H (2002) Robustness as a measure of plausibility in models of biochemical networks. J Theor Biol 216: 19–30 [DOI] [PubMed] [Google Scholar]
- Mulquiney PJ, Kuchel PW (1999) Model of 2,3-bisphosphoglycerate metabolism in the human erythrocyte based on detailed enzyme kinetic equations: computer simulation and metabolic control analysis. Biochem J 342 (Part 3): 597–604 [PMC free article] [PubMed] [Google Scholar]
- Nakayama Y, Kinoshita A, Tomita M (2005) Dynamic simulation of red blood cell metabolism and its application to the analysis of a pathological condition. Theor Biol Med Model 2: 18. [DOI] [PMC free article] [PubMed] [Google Scholar]
- Ni TC, Savageau MA (1996a) Application of biochemical systems theory to metabolism in human red blood cells. Signal propagation and accuracy of representation. J Biol Chem 271: 7927–7941 [DOI] [PubMed] [Google Scholar]
- Ni TC, Savageau MA (1996b) Model assessment and refinement using strategies from biochemical systems theory: application to metabolism in human red blood cells. J Theor Biol 179: 329–368 [DOI] [PubMed] [Google Scholar]
- Rapoport TA, Heinrich R, Rapoport SM (1976) The regulatory principles of glycolysis in erythrocytes in vivo and in vitro. A minimal comprehensive model describing steady states, quasi-steady states and time-dependent processes. Biochem J 154: 449–469 [DOI] [PMC free article] [PubMed] [Google Scholar]
- Sauer U (2004) High-throughput phenomics: experimental methods for mapping fluxomes. Curr Opin Biotechnol 15: 58–63 [DOI] [PubMed] [Google Scholar]
- Schuster R, Holzhütter HG (1995) Use of mathematical models for predicting the metabolic effect of large-scale enzyme activity alterations. Application to enzyme deficiencies of red blood cells. Eur J Biochem 229: 403–418 [PubMed] [Google Scholar]
- Schuster S, Dandekar T, Fell DA (1999) Detection of elementary flux modes in biochemical networks: a promising tool for pathway analysis and metabolic engineering. Trends Biotechnol 17: 53–60 [DOI] [PubMed] [Google Scholar]
- Shannon CE (1948) A mathematical theory of communication. Bell System Technical J 27: 379–423, 623–656 [Google Scholar]
- Stelling J, Klamt S, Bettenbrock K, Schuster S, Gilles ED (2002) Metabolic network structure determines key aspects of functionality and regulation. Nature 420: 190–193 [DOI] [PubMed] [Google Scholar]
- Steuer R, Gross T, Selbig J, Blasius B (2006) Structural kinetic modeling of metabolic networks. Proc Natl Acad Sci USA 103: 11868–11873 [DOI] [PMC free article] [PubMed] [Google Scholar]
- Steuer R, Kurths J, Daub CO, Weise J, Selbig J (2002) The mutual information: detecting and evaluating dependencies between variables. Bioinformatics 18: S231–S240 [DOI] [PubMed] [Google Scholar]
- Steuer R, Kurths J, Fiehn O, Weckwerth W (2003) Observing and interpreting correlations in metabolomic networks. Bioinformatics 19: 1019–1026 [DOI] [PubMed] [Google Scholar]
- Tekir SD, Cakir T, Ülgen KÖ (2006) Analysis of enzymopathies in the human red blood cells by constraint-based stoichiometric modeling approaches. Comput Biol Chem 30: 327–338 [DOI] [PubMed] [Google Scholar]
- Varma A, Palsson BO (1994) Metabolic flux balancing: basic concepts, scientific and practical use. Nat Biotechnol 12: 994–998 [Google Scholar]
- von Dassow G, Meir E, Munro EM, Odell GM (2000) The segment polarity network is a robust developmental module. Nature 406: 188–192 [DOI] [PubMed] [Google Scholar]
- Wang L, Birol I, Hatzimanikatis V (2004) Metabolic control analysis under uncertainty: framework development and case studies. Biophys J 87: 3750–3763 [DOI] [PMC free article] [PubMed] [Google Scholar]
Associated Data
This section collects any data citations, data availability statements, or supplementary materials included in this article.
Supplementary Materials
Supplementary Information


