

Abstract
Recently we described a new method for in situ localization of specific DNA sequences, based on lac operator/repressor recognition (Robinett, C.C., A. Straight, G. Li, C. Willhelm, G. Sudlow, A. Murray, and A.S. Belmont. 1996. J. Cell Biol. 135:1685–1700). We have applied this methodology to visualize the cell cycle dynamics of an ∼90 Mbp, late-replicating, heterochromatic homogeneously staining region (HSR) in CHO cells, combining immunostaining with direct in vivo observations. Between anaphase and early G1, the HSR extends approximately twofold to a linear, ∼0.3-μm-diam chromatid, and then recondenses to a compact mass adjacent to the nuclear envelope. No further changes in HSR conformation or position are seen through mid-S phase. However, HSR DNA replication is preceded by a decondensation and movement of the HSR into the nuclear interior 4–6 h into S phase. During DNA replication the HSR resolves into linear chromatids and then recondenses into a compact mass; this is followed by a third extension of the HSR during G2/ prophase. Surprisingly, compaction of the HSR is extremely high at all stages of interphase. Preliminary ultrastructural analysis of the HSR suggests at least three levels of large-scale chromatin organization above the 30-nm fiber.
In mammalian cells, DNA is compacted linearly >15,000:1 within metaphase chromosomes (Becker et al., 1996). For interphase chromosomes, fluorescence in situ hybridization studies suggests a linear packing ratio of ∼200–1,000:1 (Lawrence et al., 1990), whereas the compaction of DNA within 30-nm chromatin fibers yields a linear packing ratio of ∼40:1 (Suau et al., 1979). The additional folding of these chromatin fibers into interphase and mitotic chromosomes, which we refer to as the large-scale chromatin structure, is poorly characterized at this time. Still unclear are very basic questions, including whether defined higher order folding motifs beyond the 30-nm fiber even exist, particularly within interphase nuclei, and to what degree the large-scale chromatin structure of specific chromosome regions fold reproducibly in different cells at specific cell cycle and developmental stages.
Our general approach to understanding the hierarchy of folding motifs underlying higher-order chromosome structure has been to focus on intermediates of folding and unfolding during progression into and out of mitosis and during progression through interphase (Belmont, 1997). This work has led to the description of ∼100-nm diam large-scale “chromonema” fibers, formed by the folding of 10- and 30-nm chromatin fibers, as basic units of mitotic and interphase chromosome structure (Belmont et al., 1987, 1989; Belmont and Bruce, 1994; Robinett et al., 1996; Belmont, 1997).
However, this experimental strategy of dissecting folding motifs underlying chromosome architecture through the analysis of cell cycle folding intermediates has been severely handicapped by two serious experimental difficulties. First, is the problem that in most experimental systems methods for cell cycle synchronization are imperfect and after synchronization there is a relatively rapid, inherent loss of synchronization obvious even between daughter cells. This means that analysis of structural changes in fixed cell populations will be statistical in nature. More specifically, this implies that only slow modulations in structure can be described adequately; structural changes occurring over a time scale less than or comparable to the variability in synchrony are not easily observed or interpreted, particularly in terms of establishing a temporal sequence of structural changes. Especially difficult is distinguishing a statistical variability in structure within the cell population from a defined temporal sequence of structural changes experienced by every cell in the population.
The second difficulty is the tremendous heterogeneity in large-scale chromatin organization observed even within the same nucleus. For example, within late telophase nuclei we have observed decondensation of chromosomes to an ∼100–130 “chromonema” fiber adjacent to a still condensed, telophase chromosome ∼200–500-nm in diameter (Belmont and Bruce, 1994). This heterogeneity in large-scale chromatin packing persists through middle to late prophase (Li, G., K. Bruce, and A.S. Belmont, unpublished observations). Again it is difficult to distinguish to what degree this heterogeneity reflects a different large-scale chromatin organization for different genomic regions, versus a similar hierarchical chromatin organization but different cell cycle timing of decondensation and condensation for different genomic regions, versus a statistical variation in chromatin organization for the same genomic region observed within a cell population. Again, assuming that a defined hierarchical folding pathway does exist, this heterogeneity makes it very difficult to recognize distinct intermediates of this pathway, and to determine the exact temporal sequence for transitions between these intermediates during chromosome condensation/decondensation.
To overcome these experimental difficulties, we have recently developed a novel methodology for in situ visualization of the cell cycle condensation/decondensation of a specific chromosome region produced by gene amplification (Robinett, C., C. Willhelm, G. Li, and A.S. Belmont. 1994. Mol. Biol. Cell. 5(Suppl.):3a; Robinett et al., 1996). With respect to the problems outlined above, this methodology has two important components. First, by using a large, tandem array of lac operators in conjunction with expression of a green fluorescent protein (GFP)1–lac repressor–nuclear localization signal (NLS) fusion protein we are able to visualize the location of specific DNA sequences within living cells. Moreover, we are able to visualize the locations of these operator sequences within fixed specimens at both light and electron microscopy resolution using lac repressor staining in conjunction with immunostaining; this allows us to minimize perturbation of large-scale chromatin organization by substitution of DNA denaturation protocols required by in situ hybridization with the less harsh staining conditions used for immunostaining.
Second, by combining this lac operator/repressor–tagged system with gene amplification we are able to selectively visualize the cell cycle dynamics of a specific chromosome arm region. Typically, gene amplification produces amplicon repeats consisting of a several hundred to one thousand kb of genomic DNA flanking the selectable marker. Tens to hundreds of these amplicons typically produce a large chromosome region, tens to hundreds of Mbp in size, with uniform staining using typical chromosome banding protocols; this homogeneously staining region is called an HSR. Because chromosome bands often delineate blocks of DNA that show similar timing of replication, or blocks of heterochromatin or euchromatin, we may expect these HSRs also to show a more uniform pattern of chromosome condensation and decondensation than normal chromosome regions of comparable size.
In this paper we have now applied this methodology to describe the cell cycle dynamics of a late-replicating, heterochromatic HSR. In contrast to the tremendous heterogeneity in large-scale chromatin organization observed within and between nuclei from cell cycle–synchronized populations, we show that this HSR follows a precise choreography of condensation and decondensation events throughout the interphase cell cycle that is the same for all cells in the population and very different from that observed for the bulk chromatin. Moreover this pattern of condensation and decondensation is accompanied by similarly reproducible changes in intranuclear positioning of the HSR. Both the conformational and intranuclear positioning changes of the HSR are tightly correlated with the timing of HSR DNA replication.
Materials and Methods
Cell Culture and Synchronization
CHO DG44 cells (Urlaub et al., 1986) were grown in F-12 media supplemented with 10% FBS (Hyclone Labs, Logan, UT). pSV2-DHFR-8.32– transfected DG44 cells (Robinett et al., 1996) were grown in selective media (F-12 media without thymidine and hypoxanthine) supplemented with dialyzed FBS (Hyclone Labs). Gene amplification of the transfected DHFR gene was carried out by stepwise increments in methotrexate (MTX) (Sigma Chemical Co., St. Louis, MI) concentration. A03 cells were initially cloned from cells grown at 0.3 μm MTX; a further subcloning yielded the A03_1 cell line, which showed higher stability of the chromosome HSR than the original A03 clone. A03_1 cells were maintained in selective media supplemented with 0.3 μm MTX. A03_1 cultures were frozen in aliquots, and approximately every month new vials were thawed for use to ensure that the HSR studied in this paper did not change during course of these experiments. A03_1 cells were transfected with p3′SS dimer (Robinett et al., 1996), which contained a dimer form of lac repressor–nuclear localization signal fusion protein, and stable clones were selected in 0.2 mM hygromycin. Incubation was at 37°C with 5% CO2.
An early S phase synchronization protocol (Tobey and Crissman, 1972; Tobey et al., 1990) was applied that used a G1 block induced by isoleucine-deficient media, this was followed by release and a hydroxyurea (HU) S phase block. This early S phase block was completely reversible as demonstrated by flow cytometry (data not shown). After a 6-h release from HU block, 75% of the cells were enriched in late S and G2 phase. Mitotic cells were collected by mechanical shake-off (98–100% cells in M phase) after a 2-h nocodazole (600 ng/ml) treatment, which was added 7 h after the release from early S phase block. After washing off the nocodazole, the cells progressed into G1 phase in synchrony.
Immunofluorescence Staining
In Vitro Repressor Staining.
Cells grown on glass coverslips were rinsed, permeabilized in 0.1% Triton X-100 for 30 s, and then fixed with 1.6% formaldehyde for 15 min in PBS* (Ca-, Mg-free PBS with 5 mM MgCl2, and 0.1 mM EDTA). After three 5-min washes in PBS*, excess aldehyde groups were quenched by washing three times for 5 min with 20 mM glycine in PBS*, followed by washing three times for 5 min in PBS*. The cells were then washed 5 min in repressor-binding solution (PBS*, 0.1% Triton X-100, 0.1 mM DTT, and 50 μg/ml BSA) before incubation with 0.45 μg/ml purified lac repressor for 2 h at 4°C. After another 5-min wash with repressor-binding solution, the cells were fixed a second time with 1.6% formaldehyde for 15 min, and washed as described above after the first fixation. The cells were then blocked in 5% normal goat serum (NGS) in PBS* for 1 h. After washing three times for 5 min with PBS*, the cells were incubated with rabbit anti-repressor antibody (Stratagene, La Jolla, CA) (diluted at 1/1,000 in PBS* with 0.1 Triton X-100) for 4 h at 4°C. After washing three times for 5 min in PBS* with 0.1% Triton X-100, the cells were stained with Texas red–conjugated goat anti–rabbit antibody (Jackson Laboratories, Bar Harbor, ME) (diluted at 1/1,000) overnight at 4°C. The cells were then washed with PBS* with 0.1% Triton X-100, followed by PBS*, each three times for 5 min. The cells were stained with 0.2 μg/ml 4,6-diamidino-2-phenylindole (DAPI) (Molecular Probes, Eugene, OR) for 5 min before mounting. Samples used for optical sectioning were stepped through a glycerol/buffer series ending with 90% glycerol containing 3.5% N-propyl-gallate as an antifading agent (Giloh and Sedat, 1983).
Bromodeoxyuridine Labeling and lac Repressor Double Staining.
Cells grown on coverslips were labeled with 10 μm bromodeoxyuridine (BrdU) in F-12 selective media for 15 min at 37°C. After washing three times for 5 min with PBS at 37°C, the cells were permeabilized, fixed with 1.6% formaldehyde, stained with purified lac repressor, fixed a second time, and then washed as described above. The cells were then treated with 4N HCl for 30 min at room temperature to denature the DNA. After washing four to five times with PBS*, the cells were incubated with FITC-conjugated monoclonal mouse anti-BrdU antibody (Boehringer Mannheim Corp., Indianapolis, IN) (diluted at 1/20 in PBS* with 1% BSA and 0.5% Tween-20) and rabbit anti-repressor antibody (diluted at 1/1,000) for 1 h at room temperature. After three 5-min washes in PBS*, the cells were further stained with Texas red–conjugated goat anti–rabbit antibody.
Immunogold Staining
In Vitro Repressor Staining.
A different staining protocol was developed to improve the preservation of large-scale chromatin ultrastructure during immunostaining. Cells grown on Aclar film (Pro-Plastic, Linden, NJ) were rinsed with buffer C (0.25 M sucrose, 10 mM Pipes, pH 7.0, 1.5 MgCl2, 1.0 mM CaCl2, 10 μg/ml turkey egg white protease inhibitor), permeablized in buffer C with 0.1% Triton X-100 for 5 min on ice, and then fixed with 1.6% formaldehyde in buffer C for 15 min at room temperature. After washing three times for 5 min with buffer C, the buffer was changed to buffer A (80 mM KCl, 20 mM NaCl, 2 mM EDTA, 0.5 mM EGTA, 0.5 mM spermidine, 0.2 mM spermine, 15 mM β-mercaptoethanol, 10 μg/ml turkey egg white protease inhibitor (Sigma Chemical Co.), adjusted to pH 7.0) to carry out repressor staining, using the procedures as described for immunofluorescence staining. Before the second fixation, the buffer was changed back to buffer C, and the cells were fixed with 1.6% formaldehyde in buffer C for 15 min at room temperature. After washing three times for 5 min with buffer C, the buffer was changed to buffer A without β-mercaptoethanol. Primary (rabbit anti-repressor) and secondary antibody (1.4-nm Nanogold cluster–labeled, goat anti–rabbit antibody, used at 1/50 dilution [Nanogold, Stony Brook, NY]) staining was carried out as described for immunofluorescence staining. After silver enhancement (Dancher, 1981), dehydration, embedding in Epon, sectioning, and uranyl acetate and lead staining were carried out as described previously (Belmont et al., 1993).
Staining of Cells Expressing Repressor.
After rinsing in calcium- and magnesium-free (CMF)-PBS, cells were fixed in 1.6% formaldehyde for 1 h at room temperature. The remaining steps were essentially the same as above except that the repressor staining, the second fixation, and all the washing steps after the second fixation were eliminated.
GFP–lac Repressor Construction and Live Cell Observation
The S65T “improved” GFP (Helm et al., 1995) and dimer form of lac repressor (Chen et al., 1992) were constructed as a fusion protein in the p3′SS eukaryotic expression vector (Robinett et al., 1996). A03_1 cells were transfected with the fusion construct by LipofectAmine (GIBCO BRL, Gaithersburg, MD) and stable transformants were selected with 0.2 mM hygromycin. For live cell observations, a FCS2 (Bioptics, Butler, PA) system was used on an inverted Olympus (Tokyo, Japan) fluorescent microscope equipped with a CCD camera (Hiraoka et al., 1991). The cells were grown to log phase or synchronized at early S phase before transfer to the chamber. Conditioned F12 selective media was used to replace media in the cell chamber every 4 h. The pH was maintained by continuous flow of 5% CO2 over the media in the reservoir. The FITC filters were used to visualize the GFP and the exposure time was controlled carefully (total exposure time under 30 s) to minimize phototoxicity.
Mitotic Spreads
Mitotic cells were collected by mitotic shake-off after a 1-h colchicine treatment. For BrdU pulse-chase experiments, mitotic cells were collected by mitotic shake-off without use of colchicine. The harvested cells were incubated in 75 mM KCl at 37°C for 20 min, fixed for 10 min three times in fresh 3:1 methanol/acetic acid, and then dropped onto cleaned glass coverslips. The coverslips were air dried, stored at −20°C with desiccant, and used within 2–3 wk. Immunofluoresence staining was done as described above with the following modifications. The air-dried sample was rehydrated in PBS* with 0.1% Triton X-100 for 30 min. Additional blocking with 5% NGS in PBS* for 30 min was carried out to reduce the background staining. The first formaldehyde fixation was eliminated.
DNA Stretching
Stretched DNA from A03_1 cells was prepared on coverslips as described elsewhere (Parra and Windle, 1993). Immunofluorescence staining was done as described for staining of mitotic spreads.
Microscopy
Light microscopy images were collected on a inverted light microscope (IMT-2; Olympus) equipped with a cooled, slow-scan CCD camera (Photometrics, Tucson, AZ). Optical sectioning and deconvolution were carried out as described previously (Hiraoka et al., 1991).
Thin and semi-thick Epon sections were examined at 120–200 V on a transmission electron microscope (CM200; Phillips Electron Optics, Mahwah, NJ). A camera (1412; Eikonix), capable of 12 bit gray scale readout of a 4096 pixel linear detector array, was used with a Plannar light source (model 5x5; Gordon Instruments, Orchard Park, New York) to digitize negatives (Belmont et al., 1993). A “mass normalization” procedure, to convert film optical density values to values proportional to the integrated scattering cross section, or electron optical density, was carried out as described previously (Belmont et al., 1987). Image “intensity” values then reflect the density of heavy metal staining, with brighter regions corresponding to higher electron density as in a negative.
The display program, NEWVISION (Pixton and Belmont, 1996), was used to display images and view results. Selected images or montages were then assembled into figures using Photoshop (Adobe Systems, Inc., Mountain View, CA). Figures were printed using a dye sublimation printer.
Results
Isolation and Characterization of a Stable, Late-replicating HSR
A03_1 Is a Stable HSR.
The system for lac operator/repressor localization of DNA sequences described previously (Robinett et al., 1996) uses a 256 copy lac operator direct repeat located within pSV2-DHFR (Subramani et al., 1981), an expression vector for dihydrofolate reductase (DHFR). CHO DG44 cells (Urlaub et al., 1986) containing a double DHFR deletion were transformed and a pool of stable transformants stepped collectively through increasing MTX concentrations. Cells growing at 0.3 μm MTX were cloned. Out of approximately six clones, only one contained a single, stable HSR. A03_1, a subclone of A03, showed increased stability with 98% of A03_1 cells containing a single HSR, with the remainder containing two HSRs.
All mitotic banding methods explored produced a homogeneous staining pattern for the A03_1 amplified chromosome region (data not shown). By Giemsa banding, the amplified chromosome region stained as a light, R band; by Hoescht staining, however, the HSR appeared to be a brightly staining, AT rich band. After HCl treatment the HSR showed a DAPI fluorescence roughly twofold greater than the rest of the genome (Fig. 1 A, bottom inset). An alternative, NaOH treatment used for DNA denaturation allowed good BrdU staining for the entire chromosome spread, with only the HSR chromosome arm unlabeled. We interpret these last results as indicative of an atypical chromatin structure for the A03_1 HSR such that it is more resistant to denaturation than most chromosome regions.
Figure 1.


A03_1 HSR characterization: (A) HSR (arrow) is on a distinctive, late-replicating chromosome, present in the parental DG44 cell line (top inset) and is itself late replicating. Log phase cells were labeled continuously for 2–3 h with BrdU and mitotic spreads prepared and triple stained with anti-BrdU (green), anti– lac repressor (red), and DAPI (blue). Lower inset shows selected examples from 2 h (first two panels) or 3 h (last three panels) BrdU labeling. HSR replication finishes before the adjacent arm completes replication. (B) Organization of vector repeats visualized within stretched A03_1 DNA, stained with DAPI (blue) and lac repressor (red). (a) Example of flanking DNA between lac repressor staining regions. (b) Several examples of lac repressor– staining regions. (C) Southern blot shows size of vector repeat. A03_1 genomic DNA was digested with Bsu36I, which does not cut the pSV2–DHFR–8.32 vector. The major band (a doublet) is at ∼400 kb with minor bands at 500 and 700 kb. (D) HSR finishes replication 0.5–1 h before the end of S phase. Percentage of mitotic spreads or HSRs incorporating BrdU versus time of BrdU continuous labeling. (E) HSR replication peaks at ∼6 h after beginning of S phase (∼11 h chase time). Percentage of mitotic spreads or HSR incorporating BrdU versus chase time after 15 min BrdU pulse labeling. (D and E) Squares correspond to labeling of mitotic spreads, and diamonds to labeling of HSR (at least 100 cells per data point). Bars: (A) 2 μm; (B) 20 μm.
After methanol/acetic acid or prolonged methanol fixation, lac repressor staining produced three very small, paired chromosomal spots in addition to the HSR staining, including one pair on the long chromosome arm opposite the HSR (data not shown). This spot allowed unambiguous identification of the HSR containing chromosome from 4 to 5 chromosomes of comparable size in a typical spread. An identical set of three spots was visualized in mitotic spreads from the parental DG44 CHO cells. Therefore these spots are unrelated to the lac operator sites introduced by transformation and are seen only with alcohol fixation and not formaldehyde fixation or in vivo expression of GFP repressor.
Mitotic spreads (Fig. 1 A) show that the HSR occupies most of a short chromosome arm; this arm appears to have been added onto a small, telocentric chromosome present in the original DG44 cells (Fig. 1 A, top inset). 16–18 spreads showed a single HSR located on the same distinctive chromosome (one showed an additional, smaller HSR on a different chromosome, and the second a similar size HSR but on a different chromosome). Measurements of the HSR length versus the total chromosome lengths in the spread and the length of the arm opposite to the HSR from these 16 mitotic spreads are summarized in Table I.
Table I.
Calculation of A03_1 HSR Size
| Mean | SD | |||
|---|---|---|---|---|
| R 1 = L hsr/L total | 1.55% | 0.33% | ||
| R 2 = L hsr_ch/L total | 4.70% | 0.76% | ||
| R norm = R 1 × R 2 /R 2 | 1.55% | 0.17% | ||
| HSR size (Mbp) | 93.0 | 10.2 |
Statistics from 22 mitotic spreads from three separate experiments. L hsr, L hsr_ch, and L total represent the HSR length, HSR containing chromosome length, and sum of all chromosome lengths in a mitotic spread, respectively. R 1 is normalized to R norm by the mean of R 2 (R 2) to correct for variations in the aneuploid state of cells. The HSR size is calculated by R norm × estimated, diploid CHO genome size (6 × 10⁹ bp).
Based on this analysis, the A03_1 HSR length was 1.55 ± 0.17% of the total chromosome lengths. Assuming a metaphase compaction of the HSR comparable to the average metaphase compaction, and a CHO genome size of 6 × 10⁹ bp per diploid genome, this corresponds to a HSR size of 93 Mbp ± 10 Mbp.
Molecular Characterization of the A03_1 HSR.
To analyze the spacing of vector DNA and flanking genomic DNA, we used a DNA stretching protocol (Parra and Windle, 1993), which extends genomic DNA by fluid flow; the stretched DNA length is normally 50–200% of duplex relaxed B form DNA. The maximum fragment length using this technique is ∼1 Mbp. Lac repressor staining to visualize the vector sequence was combined with DAPI counterstaining for staining of flanking DNA (see Fig. 1 B). The average length of repressor-stained regions, 86 ± 3 μm, implied a size of ∼250 kb assuming DNA was stretched to 100% of B form DNA. Unlabeled DNA, at least equal to the length of repressor stained regions, was observed flanking the repressor labeled regions. In one example, a long segment of unstained DNA was flanked by two repressor stained regions, implying an intravening DNA length of ∼700 kb, again assuming 100% stretching.
We used pulse field gel electrophoresis and Southern blot analysis to estimate the vector copy number within the units of amplification (Fig. 1 C). A03_1 genomic DNA was digested with Bsu36I and MluI, two 6-bp frequent cutters, which do not cut the original vector sequence. Assuming normal sequence variation within the flanking DNA, the length of the restriction fragments visualized by Southern blotting should closely approximate the actual length of the large vector repeat. There was a major, doublet band at ∼400 and 425 kb after Bsu36I digestion as well as several minor bands at ∼500, 700, and 1,000 kb. Similar bands were observed after MluI digestion.
Recalibration of the size of the lac repressor staining region in the stretched DNA experiments would then suggest that the flanking genomic DNA is equal or larger on average to the ∼400-kb size of the vector array, and estimate a distance between the two vector arrays in the example shown in Fig. 1 B of ∼1,100 kb. To estimate the average amount of flanking DNA per amplicon, we quantitated the total lac operator DNA contained within the A03_1 cell line by monitoring the 292-bp EcoRI fragment corresponding to the 8-mer lac operator repeat within the larger 256 copy operator array. The lac operator repeat was estimated as 0.43% of the total genomic DNA, ∼28% of the estimated HSR DNA. Assuming the average amplicon contains 400 kb of vector repeat, this leads to an estimate of ∼1,000 kb of flanking coamplified genomic DNA per amplicon.
A03_1 HSR Is Late Replicating.
BrdU was added to a logarithmically growing population of A03_1 cells and mitotic cells harvested afterwards at 1-h intervals for preparation of mitotic spreads. The time required for the first appearance of BrdU label within the mitotic spreads then corresponds to the G2 duration. BrdU/lac repressor double staining of a mitotic spread from such a continuous labeling experiment is shown in Fig. 1 A. The chromosome arm opposite to the HSR is very late replicating. Similar experiments done using the parental DG44 cell line revealed a similar very late replication pattern for the original chromosome without the HSR (Fig. 1 A, top inset). This late-replicating chromosome arm, together with the increased DAPI fluorescence of the HSR after HCl treatment, made it possible to distinguish the HSR by only BrdU staining. HSR replication is seen to occur between 2 and 3 h before mitosis, while replication of the adjacent, late-replicating chromosome arm is still ongoing at the very end of S phase, 2 h before mitosis (Fig. 1 A, bottom inset). We estimate the HSR completes its replication ∼30 min before the end of S phase (Fig. 1 D).
To estimate the length and starting time of the HSR replication, a 15-min BrdU pulse was followed by a variable chase. The start of S phase, estimated as when 50% of mitotic spreads were labeled, was 11–12 h before mitosis (Fig. 1 E). The beginning of HSR replication, when 50% of the HSRs were BrdU positive, was ∼5.5 h before mitosis, or 6.5 h after the beginning of S phase. The average S phase duration in these log phase populations was estimated as ∼8–9 h.
Early G1 Uncoiling of HSR Is Followed by a Recondensation and Movement to the Nuclear Periphery
Mitotic Conformation.
In mitotic spreads the mean HSR length was 1.76 ± 0.15 μm (n = 16), yielding a 18,000:1 compaction ratio for the metaphase chromosome, within the 15,000–20,000 textbook range for human chromosomes (Becker et al., 1996), which is also based on length measurements from mitotic spreads. Here, we are defining the packing ratio as the ratio of the predicted length of the chromosomal DNA to the actual chromosome length. A variability in chromosome lengths in mitotic spreads arises from several causes including variations in mitotic stage, variations in metaphase chromosome condensation related to drug arrest, and variations in stretching accompanying fixation and spreading.
The actual, in situ metaphase chromosome length was more difficult to measure because of inherent resolution limits of optical microscopy, particularly along the optical axis. However, based on measurements from individual optical sections from several metaphase cells, selecting examples in which the HSR chromosome arm was oriented roughly perpendicular to the optical axis, the mitotic chromosome length varied between 1.2 and 1.5 μm with a mean of 1.3 μm. Chromosome diameter was estimated as ∼1 μm, implying an ∼0.5-μm diam for each daughter chromatid. These measurements were made from metaphase cells grown on coverslips, fixed in formaldehyde, and stained with lac repressor using immunofluorescence detection. An example is shown in Fig. 2 A. These measurements indicate a significantly higher compaction ratio of ∼24,000:1 for these more native, metaphase chromosomes.
Figure 2.

HSR changes during telophase/early G1. A03_1 cells were stained with lac repressor different times after release from mitotic block (t = 0). Deconvolved lac repressor (Texas red) and DNA (DAPI) staining images are superimposed in A–E; bright regions (arrows) correspond to lac staining. (A) Metaphase HSR, ∼1 μm in length. Staining is concentrated on periphery. (B) Initial uncoiling of HSR (40 min). (C) Extension of HSR to ∼0.3-μm diam, ∼2-μm-long fiber (80 min). (D) Intermediate, possibly irregularly coiled (see text) structure leading towards condensed chromatin mass (180 min). (E) Uniform, condensed mass with no substructure evident at light microscopy resolution (4 h). (F) HSRs in A–E at higher magnification. Bars, 2 μm.
Telophase to Early G1 Transition.
Mitotic cells harvested by selective detachment were released from a mitotic block and plated onto coverslips. At 40, 80, 120, 180, and 240 min after release, cells were fixed and stained with lac repressor. Deconvolved optical sections from nuclei at different stages of chromosome decondensation were examined (Fig. 2). In telophase and early G1 nuclei, where condensed chromosomes could still be recognized, the HSR varied in length between 1.1 and 1.4 μm with a mean of 1.26 μm, based on measurements from five deconvolved data sets in which the HSR arm was perpendicular to the optical axis. The width of these telophase chromatids was increased from metaphase from ∼0.5 to 0.8 μm and a large fraction of these HSRs showed substructure suggestive of irregular uncoiling of an ∼0.3–0.4-μm-diam fiber as seen by light microscopy (Fig. 2 B).
We attribute the increased telophase chromatid width, relative to metaphase chromatids, to the loosening and beginning of uncoiling of this 0.3–0.4 μm fiber. Uncoiling of the chromatid during the telophase to early G1 transition is further suggested by optical sections of several examples (Fig. 3). A closer look is provided by individual, serial optical sections (Fig. 3 D) and stereopairs generated by projection of deconvolved, three-dimensional data sets (Fig. 3 E).
Figure 3.

Chromosome uncoiling during telophase/early G1. A03_1 cells were stained with lac repressor 40 min after release from nocodazole. (A–C) Deconvolved optical sectioning data from selected examples. HSR staining is merged with DAPI staining as in Fig. 2. (D) Serial optical sections, separated by 0.2 μm, showing uncoiling of HSR (same HSR as A). (E) Stereo pairs from projection of three-dimensional data set (same HSR as in Fig. 2 B): top, −32°, and −18°; middle, −10°, and 4°; and bottom, 8°, and 22°. (F–G) Immunogold EM of synchronized cells, 0.2-μm-thick sections. (F) Condensed telophase HSR before uncoiling (image suggests coiling with arrows bracketing ∼0.3-μm apparent fibers or striations). (G) Extended ∼0.3-μm-wide fiber. Bars: (A–C) 2 μm; (D and E) 1 μm; (F and G) 0.5 μm.
Chromatid uncoiling is further suggested by the appearance of many HSRs, between 80 and 120 min after mitotic release, as thinner, 2–3-μm extended fibers (2.2 μm mean), approximately twice the earlier telophase length (Fig. 2 C). By light microscopy the width of these fibers was ∼0.3 μm. To better visualize this chromatid extension, EM immunogold staining was carried out on cells stably expressing the lac repressor using an anti-repressor primary antibody and a Nanogold-labeled secondary. Internal substructure (Fig. 3 F) is consistent with the coiling of a ∼0.3–0.4-μm smaller fiber, as suggested further by stereopairs (data not shown). Supporting this interpretation, Fig. 3 G shows an extended, linear chromatid with a width of ∼0.3 μm.
At later times, the HSR begins to recondense, as indicated by an increasing fraction of cells between 2 and 3 h after release with a loose, irregular folding of the HSR chromatid (Fig. 2 D). Further condensation of the HSR occurred such that by 4 h nearly all nuclei showed a highly condensed, oval mass with no visible substructure by light microscopy (Fig. 2 E). Typical diameters for the axes of this oval mass ranged from 0.5 to 1.0 μm.
The overall level of chromatin decondensation, revealed by DAPI staining, provided a rough temporal ordering of nuclei during progression through telophase and early G1. This ordering suggested an uncoiling of the mitotic HSR chromatid to the linear, ∼2.2-μm telophase chromatid, followed by a refolding of this chromatid. The high degree of condensation into a compact mass with an absence of substructure at later times in G1 is consistent either with a further, tight folding of the original, linear, ∼0.3-μm chromatid, or a complete remodeling of the chromatin into a different, higher order conformation. Preliminary electron microscopy of immunogold-stained samples, however, is more suggestive of the tight folding, chromatid hypothesis, as described below.
In Vivo Confirmation.
The above temporal sequence of structural changes was confirmed by direct in vivo observations using a GFP–lac repressor–NLS fusion protein stably expressed in A03_1 cells. We selected late anaphase/telophase cells from a log phase population and limited total exposure time to <10 s, a time which permitted passage of cells through one cell cycle without abnormal cell division (see below). Time-lapse observations revealed a relatively abrupt, linear extension of the HSR occurring nonsynchronously in daughter cells. In the example shown in Fig. 7 (top), both the linearization and recondensation events occur in <20 min. An intermediate time point at 7 min (data not shown) showed a partial chromatid extension to 1.5 μm in length increasing to 1.9 μm at 20 min. In other examples, chromatid extension occurred within 5–10 min with recondensation occurring in as short as 8 min. Both HSRs remained condensed over the next 3 h of observations. By the end of the GFP observation period, the cells had moved apart and flattened as expected for normal cell cycle progression (see Fig. 7, top right). The cells were maintained on the microscope for another 24 h and observed to have divided over this time period.
Figure 7.

In vivo dynamics of A03_1 HSR. Top left, linear extension of HSR is followed by condensation in early G1 nuclei. Two daughter cells in late telophase—20 or 40 min after beginning observation, HSR linearizes in each daughter cell. Recondensation occurs within 20 min and HSR remains condensed for several hours afterwards. Top right, corresponding transmitted light images at 0 and 240 min. Bottom left, Progression of HSR from late S through mitosis, with t = 0 corresponding to release from early S phase block. HSR decondensation of HSR begins at 5 h, with “C” shaped appearance, followed by transition to larger, ball-shaped HSR with internal fibrillar structure (7 h). Suggestion of possible linear stage at 7.5 h is followed by a compaction at 8 h and a regaining of a linear, curled conformation at 8.5 h with chromosome segregation at 9 h. (Transmitted light pictures shown below.) Bottom right, transition of compact HSR in late S or G2 to linear, extended chromosome axis in prophase. −120 and −30 refer to minutes before cell division. Fluorescent (top) and transmitted images (bottom). Bars: (fluorescence) 2 μm; (transmitted) 4 μm.
A similar sequence of events was observed in 12 independent observations of late telophase/early G1 cells. Seven examples clearly show the early extension of the chromatid, and nine examples show the recondensation after linearization. The complete sequence of linearization and recondensation was observed in four cases. In most cases where the complete sequence was not observed, this was either because the first time point showed an extended chromatid or because it was not possible to capture the HSRs of both daughter cells in the same focal plane for the entire sequence. In two cases, the cells were followed for only 2 h and the HSR extended but did not recondense over this period.
The HSR extension and recondensation in these cells occurred earlier than that observed in the synchronized, fixed populations. This was rationalized to be because of effects related to recovery of cells from the mitotic block in the experiments with synchronized cells, as well as beginning observations for the live cell experiments after cell division.
Intranuclear Repositioning of the HSR.
Accompanying these structural changes was a change in nuclear positioning. Table II summarizes data from three-dimensional optical sectioning of lac repressor–stained nuclei from synchronized populations. The HSR was defined as nuclear envelope (NE) associated if the nearest region of the HSR was <0.5 μm from the NE for middle optical sections, or if the HSR was near the top or bottom nuclear sections. HSRs were classified as within the nuclear interior if the distance from the nuclear envelope was >0.5 μm, and as extended from the NE if one end of a linear HSR was within 0.5 μm of the NE.
Table II.
A03_1 HSR Conformation Versus Nuclear Location during G1 Phase
| HSR conformation | Nuclear location | Subtotal | ||||||
|---|---|---|---|---|---|---|---|---|
| NE | Extend from NE | Nuclear interior | ||||||
| Uncoiling | 9 | 0 | 0 | 9 | ||||
| Linear | 0 | 4 | 4 | 8 | ||||
| Loose | 14 | 0 | 7 | 21 | ||||
Deconvolved, three-dimensional optical sectioning data were collected from lac repressor–stained synchronized early G1 cells. The HSR conformations were categorized as “uncoiling,” “linear,” and “loose,” as shown in Fig. 2, B, C, and D, respectively. The location of the nuclear envelope was defined according to the DAPI staining and/or lac repressor nuclear background staining. The distance between the nuclear envelope and the closest HSR region was measured and used to define three HSR nuclear locations: “NE” when the HSR was within 0.5 μm from the nuclear envelope for middle sections, or near the top or bottom nuclear optical sections; “Extend from NE” when one end of a linear HSR was located within 0.5 μm from the nuclear envelope and the other end pointed towards the nuclear interior; and “Nuclear Interior” when the HSR was >0.5 μm from the nuclear envelope.
During the initial uncoiling stage (Fig. 2 B), when chromosomes were still highly condensed and HSRs showed a nonuniform substructure suggestive of uncoiling, the HSRs were predominately on the NE (9/9). After chromatid extension (Fig. 2 C), HSRs were predominately located inside nuclei (4/8 in nuclear interior, 4 extended from NE). During recondensation, with the HSR showing a compact but “loose” conformation with significant substructure visible (Fig. 2 D), roughly one-third of HSRs were located within the nuclear interior. In contrast, in the fully recondensed stage in which HSRs showed no substructure, the HSRs are again predominately at the nuclear periphery (Table III; 7/7).
Table III.
Statistics Relating A03_1 HSR Conformation, Intranuclear Position, and HSR DNA Replication
| Condense conformation | Open conformation | |||||||||||||||||||||
|---|---|---|---|---|---|---|---|---|---|---|---|---|---|---|---|---|---|---|---|---|---|---|
| Nuclear location | BrdU pattern | Subtotal | Nuclear location | BrdU pattern | Subtotal | |||||||||||||||||
| I and II | III | IV | V | I and II | III | IV | V | |||||||||||||||
| NE | 8 (0) | 1 (0) | 0 | 0 | 9 (0) | NE | 3 (0) | 6 (1) | 1 (1) | 0 | 10 (2) | |||||||||||
| Extend from NE | 0 | 0 | 0 | 0 | 0 | Extend from NE | 0 | 0 | 0 | 0 | 0 | |||||||||||
| Nuclear interior | 1 (0) | 0 | 0 | 0 | 1 (0) | Nuclear interior | 0 | 8 (8) | 0 | 0 | 8 (8) | |||||||||||
| Subtotal | 9 (0) | 1 (0) | 0 | 0 | 10 (0) | Subtotal | 3 (0) | 14 (9) | 1 (1) | 0 | 18 (10) | |||||||||||
| Linear conformation | Open-2 conformation | |||||||||||||||||||||
| BrdU pattern | BrdU pattern | |||||||||||||||||||||
| Nuclear location | I and II | III | IV | V | Subtotal | Nuclear location | I and II | III | IV (late) | V | Subtotal | |||||||||||
| NE | 0 | 0 | 0 | 0 | 0 | NE | 0 | 0 | 1 (0) | 8 (1) | 9 (1) | |||||||||||
| Extend from NE | 2 (0) | 4 (4) | 4 (4) | 0 | 10 (8) | Extend from NE | 0 | 0 | 0 | 0 | 0 | |||||||||||
| Nuclear interior | 5 (5) | 2 (2) | 0 | 7 (7) | Nuclear interior | 0 | 0 | 3 (0) | 4 (0) | 7 (0) | ||||||||||||
| Subtotal | 2 (0) | 9 (9) | 6 (6) | 0 | 17 (15) | Subtotal | 0 | 0 | 4 (0) | 12 (1) | 16 (1) | |||||||||||
Deconvolved three-dimensional optical sectioning data sets were used for these statistics. Lac repressor and BrdU double staining was done on BrdU pulse-labeled cells from log phase or synchronized populations. The HSR conformations were categorized as “condensed,” “open,” “linear,” or “open-2,” as described in the text and illustrated in Fig. 6. The nuclear locations (NE, Extend from NE, and Nuclear Interior) were defined as in Table II. BrdU patterns define the temporal sequence from early to late S phase, as described in text. “Late pattern 4” refers to a replication pattern similar to pattern 5 but with more, but smaller, BrdU labeling foci, suggestive of a transition stage between patterns 4 and 5. For each HSR conformation and nuclear location combination, the number of nuclei showing colocalization of BrdU and lac repressor staining is shown within parentheses.
No Changes During Mid-G1 through Mid-S Phase
After condensing in G1, the HSR remains condensed and associated near the NE through mid-S phase. We estimate this period lasts ∼6–8 h. This conclusion is based on lac repressor staining of cells synchronized in G1 or in S phase (see below), as well as direct, in vivo observations. For instance the percentage of nuclei showing a condensed, peripherally located HSR in early S phase is ∼90%, comparable to the level of cell synchronization as assayed by flow cytometry. During live observations beginning at late telophase/early G1, we observed a number of cells at this condensed stage for several additional hours; none showed any change in morphology. With log phase cells we usually have to wait many hours to see any structural changes. Finally, in our in vivo observations of cells released from an early S phase, no change in the condensed state is seen for the first several h, as described below. These results are consistent with the condensed conformation being present in >80% of log phase cells.
Decondensation and Nuclear Repositioning during HSR Replication
Survey of HSR Changes during S–G2 Progression.
Cells were examined at various times after release from an early S phase block. Cell cycle synchronization was verified by flow cytometry (data not shown). For the first 4 h, the HSR remained in its initial, highly condensed state, appearing as a compact spot <1 μm in diam (pattern A; see Fig. 5). In contrast, most chromatin at this stage in early S phase is maximally decondensed, as described earlier (Belmont and Bruce, 1994). The condensed HSR is easily recognized within the DAPI image (Fig. 4 A), due to the dispersed state of the surrounding chromatin.
Figure 5.

Percentage of different HSR conformations in late S phase and G2 nuclei at different times after release from early S phase block. HSR remains condensed (pattern A) first 4 h, then decondenses between 4 and 6 h after release. Patterns are defined as (see also Fig. 4): (A) condensed, compact HSR <1-μm diam; (B) larger, decondensed, ball-shaped HSR with internal fibrillar structure and 1.5–3-μm in diam; (C) extended, linear HSR, 3–4 μm in length, with appearance of intertwined fibers in some regions; and (D) HSR with two obvious parallel fibers, 1–3 μm in length. Data points represent statistics from >100 nuclei.
Figure 4.

A03_1 HSR changes during S through G2. Cells were stained with lac repressor at various times after release from early S phase block. Top rows, DAPI; bottom rows, lac repressor staining (top and bottom panels are aligned precisely). Arrows in DAPI images point to HSR location. (A) 0 h, pattern A: compact, featureless, HSR near NE; (B) 6 h, pattern B: decondensed, ball-shaped HSR with internal fibrillar appearance; (C) 6 h, pattern C: linear HSR suggestive of intertwined chromatids; (D) 9 h, pattern D: linear HSR with parallel chromatids; (E) 9 h, showing larger condensed mass in late G2/early prophase nucleus; and (F) 9 h, prophase HSR with extended, parallel chromatids. Bar, 2 μm.
Starting at 5 h, more decondensed HSR conformations appear. Three major distinct conformations were dominant. An “open” structure, pattern B, was defined as “loosened” spots of 1.5–3-μm diam (typically ∼2 μm) containing obvious fibrillar substructure. Frequently this ball-shaped HSR had a doughnut-like appearance with a clear central region, and its location was often within the nuclear interior (Fig. 4 B). An “intertwined” structure, pattern C, was defined as extended fibers 3–4 μm in length. These HSRs showed an extended, linear conformation that over part of their length appeared to consist of two intertwined fibers, but over other regions appeared as a single, thicker fiber (Fig. 4 C). Presumably this conformation represents a stage at which the HSR has replicated either partially or completely and has partially resolved into two daughter chromatids. A “parallel fibers” structure (Fig. 4 D), pattern D, was defined as an extended, linear HSR conformation with two obvious, parallel fibers, 1–3 μm in length, over the entire HSR length; this stage presumably represents a still later stage at which daughter chromatids have resolved into separate structures. Fig. 4 E shows an example in which the HSR appears as a condensed mass, although the DAPI staining pattern suggests this nucleus is in late G2 or early stages of prophase condensation. These examples were also grouped into pattern A. Pattern A therefore likely also includes cells with condensed HSRs that are at a late stage in S–G2 progression but do not fall into patterns B–D.
Pattern A drops from 90 to 15% between 4 and 6 h after release from the early S phase block; in parallel, patterns B–D increase in frequency beginning at 5–6 h (Fig. 5). The statistics at later times are consistent with a suggested temporal sequence from pattern A through B, C, and then D, which also would agree with the interpretation of patterns C and D corresponding to the appearance of daughter chromatids. The higher percentage reached by pattern B suggests either a larger percentage of cells go through changes in HSR morphology such as to produce this pattern and/or that this pattern persists for a longer time period than patterns C and D.
HSR Decondensation Begins Before HSR DNA Replication.
A striking correlation exists between the timing of the HSR's DNA replication and its decondensation during middle to late S phase (Figs. 1 E, and 5). The exact timing of these structural transitions relative to HSR DNA replication was determined using double BrdU incorporation and lac repressor staining. A03_1 cells were released from an early S block and at various times pulse labeled with BrdU for 15 min before fixation. The observed, general BrdU incorporation patterns were consistent with the five patterns previously described (O'Keefe et al., 1992) and correlated with stages of S phase progression. Consistent with the S–G2 survey described above, the HSR showed different conformations according to the stages of S phase that were associated with different intranuclear locations and timing of HSR replication (Table III; Fig. 6). None of the 14 cells examined with BrdU incorporation patterns 1 and 2 showed replication of the HSR. Most cells with patterns 1 and 2 had condensed HSR morphologies (9/14) with the HSR predominately associated with the nuclear envelope (8/9) (Fig. 6 A).
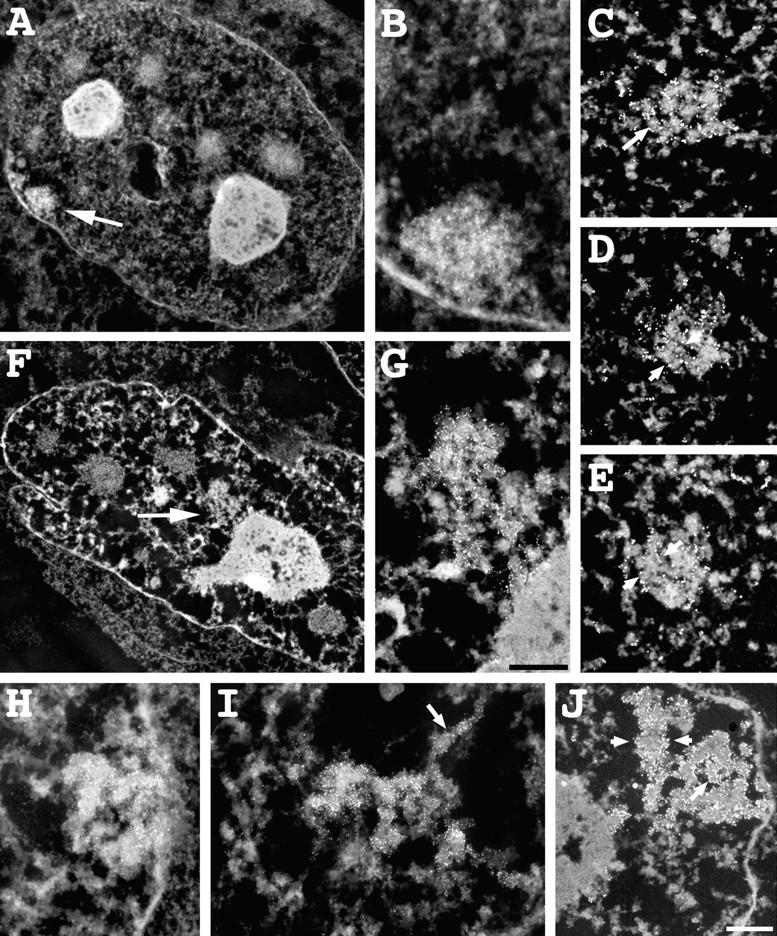
Figure 6.

HSR replication correlates with changes in HSR conformation and intranuclear positioning. (A–F) Merged lac repressor (red) and BrdU pulse label (green) images. (A) Grazing optical section shows early S phase DNA replication pattern 2 with peripheral, condensed, and unlabeled HSR; (B–E) middle S phase DNA replication pattern 3 with small peripheral BrdU incorporation sites. Grazing (B) and mid-nuclear (C) sections of same nucleus. Peripheral HSR has decondensed into ball-shaped, open conformation, but has not yet begun DNA replication. (D) Different nucleus, HSR is similarly decondensed but now shows extensive repressor and BrdU colocalization and is located within nuclear interior. (E) Linear HSR conformation with interior location, at this conformational stage all HSRs show BrdU colocalization. (F) Very late S DNA replication pattern 5, with HSR now in “open-2” conformation (see text); HSR has completed replication and is adjacent to large replication focus with partial association (arrow) to nuclear periphery; this is most likely the late-replicating chromosome arm opposite the HSR. (G) Enlarged HSR images, A–F. Bars: (A–F) 1 μm; (G) 2 μm.
The “open” HSR pattern, statistically correlated with the approximate timing of HSR replication (Fig. 5), is now shown by colocalization with BrdU incorporation to precede and accompany initiation of HSR replication during the BrdU pattern 3 period of S phase. BrdU incorporation pattern 3 is a distinctive stage defined by many small foci located predominately adjacent to the nuclear envelope. Open HSRs that are still associated with the nuclear envelope usually do not show significant BrdU incorporation, as shown in Fig. 6, B and C. The internal, linear staining region seen in the mid-nuclear section is the only internal region showing BrdU incorporation and optical sectioning suggests that it corresponds to an invagination of the nuclear envelope, common in these cells (Fricker et al., 1997). The HSR shows little overlap with BrdU labeling. Given the resolution limits of light microscopy and the high density of replication foci distributed uniformly over the nuclear periphery, it is very likely that the small number of BrdU-staining foci in the HSR vicinity in this example correspond to foci separate from the HSR.
In contrast, Fig. 6 D shows a similar, open HSR located within the interior of a BrdU pattern 3 nucleus that now shows extensive colocalization with BrdU incorporation. There is a striking correlation between intranuclear positioning of these open HSRs and HSR replication, with 8/8 of the interior located HSRs replicating. Only 1/9 nuclei in which the open HSR was peripherally located showed significant colocalization of the HSR with BrdU incorporation; in this case the colocalization covered less than half of the HSR region (data not shown). Most HSRs (14/18) with this open conformation are in cells with BrdU pattern 3; nine of these show HSR replication. 8/18 open HSRs are unlabeled with BrdU, with all of these in nuclei with BrdU incorporation patterns 1 and 2 (3/3) or pattern 3 (5/14).
Further Changes in HSR Morphology and Intranuclear Positioning during Progression through S and G2.
A “linear” HSR conformation (Fig. 6 E) in nuclei with BrdU incorporation patterns 3 and 4 appears to represent a later stage of HSR replication. The average length of these linear, extended HSRs was ∼4 μm, yielding a compaction ratio of roughly 7,200:1, only three- to fourfold reduced relative to metaphase. This linear HSR conformation corresponds to patterns C and D in Fig. 5. Because of the reduced structural preservation after the HCl-induced DNA denaturation used for BrdU staining, the intertwined versus parallel fiber appearance is not as readily distinguishable, leading us to group patterns C and D into this single category. In nuclei with BrdU incorporation patterns 3 and 4, all linear HSRs (15/15) showed BrdU colocalization in nuclei, as compared to only ∼50% of open (8/17) HSRs. Moreover, there is also a shift from predominately BrdU incorporation pattern 3 in nuclei with open HSRs to a near even mixture of patterns 3 and 4 for linear HSRs (Table III). These results are consistent with our interpretation of the intertwined appearance of the HSR pattern C (Fig. 5) as corresponding to partially resolved, daughter chromatids.
After completion of HSR replication, the HSR assumes an enlarged but compact spot-like conformation, classified as an “open-2” conformation (Table III); this was seen in nuclei containing a late BrdU incorporation distribution (Fig. 6 F). BrdU incorporation pattern 5 is very distinctive and is characterized by a small number of very large, interiorly located replication foci, similar in number and relative size to mitotic replication bands arising from labeling during the last 0.5–1 h of S phase (see Fig. 1 A). We also observed a small number of nuclei with an open HSR morphology in which the BrdU labeling pattern was similar to pattern 5 but with an increased number of large spots, which was still significantly less than that described for pattern 4 (O'Keefe et al., 1992). These nuclei may represent a transitional stage between patterns 4 and 5 and in Table III we have labeled these nuclei as pattern 4 (late).
15/16 nuclei with this open-2 HSR conformation clearly showed HSRs that did not overlap with these late replication foci. This is consistent with our mitotic replication banding experiments in which the HSR was observed to have already completed replication during the last 30–60 min of S phase when the chromosome arm opposite to the HSR was replicating. Many examples showed the HSR adjacent to or surrounded by a large spot of BrdU labeling. Presumably this adjacent region incorporating BrdU corresponds to the late replicating chromosome arm opposite to the HSR. In Fig. 6 F the adjacent, BrdU-labeled region is partially associated with the NE, but near the HSR it extends into the nuclear interior. A number of the HSRs at this time were located in the nuclear interior together with the adjacent BrdU-labeling region.
In Fig. 5, this open conformation would have been grouped within the single category B. The double BrdU, lac repressor staining now allows us to divide this grouping into an initial decondensation stage, preceding and accompanying DNA replication, with a second open-2 HSR conformation with comparable size to the open HSR morphology. This second open-2 conformation represents HSRs after replication; its increased size represents HSR duplication rather than decondensation. The grouping of these two categories may explain why the HSR morphology pattern B in Fig. 5 did not show a clearly defined peak.
Our results suggest the following temporal sequence. The HSR remains condensed and near the nuclear envelope through the first 4 h of S phase. 4–6 h into S phase the HSR begins to decondense and move toward the nuclear interior. During this decondensation and intranuclear movement, HSR DNA replication initiates. Continued replication of the HSR leads to an extended, linear morphology, ∼4 μm in length, with partially resolved daughter chromatids. During HSR DNA replication the HSR remains within the nuclear interior or, in the linear, extended conformation, either within or extending into the nuclear interior. HSR replication is followed by recondensation of the daughter chromatids such that the linear, extended HSR morphology is transformed into a ball-shaped conformation, with a movement of the majority of HSRs back to the NE. This may reflect either a refolding of the underlying linear chromatids or a remodeling of the large-scale chromatin organization.
Finally, during the transition into prophase, the HSR again extends into linear, parallel daughter chromatids, ∼2-μm long (Fig. 4 F). Both the length and width of the chromatids at this stage are very close to that observed during the linear extension stage observed in late telophase/early G1. This is consistent with the transition into and out of mitosis being associated with the coiling and uncoiling of this ∼2-μm chromatid.
In Vivo Confirmation of S–G2 Events
The temporal ordering described above was further substantiated by direct, in vivo observations. Cells expressing a GFP–lac repressor–NLS fusion protein were blocked in early S phase and we typically began our observations several hours after release. As the total exposure was increased above ∼10 s, an increasing percentage of cells showed chromatid bridging with nondysjunction during anaphase. Further exposure increases to ∼30 s, while not preventing the decondensation events associated with HSR replication, did prevent an increasing fraction of cells from entering mitosis; these cells arrested in a rounded state, possibly because of a DNA-damage G2 checkpoint arrest. Therefore we kept our total exposure to <10 s, and only considered data sets in which the observed cells entered and completed mitosis normally.
Fig. 7 (bottom, left) shows one such time series. The times indicated correspond to elapsed time after release from the S phase block. Between 5 and 6 h the HSR has nearly doubled in diameter. Because of phototoxicity concerns, only single optical sections were acquired, preventing deconvolution. The images displayed are therefore the unprocessed CCD data. At 7 h the HSR has enlarged further, showing an apparent fibrillar substructure as seen in the immunostaining results (Fig. 5 B). At 8 h the HSR has recondensed, whereas at 8.5 h the HSR appears formed by a linear structure folded into a “C” shape. The contour length of this “C” is ∼2 μm, matching that observed for prophase in the fixed specimens (Fig. 4 F). 0.5 h later daughter chromatids have separated. A second example of this transition from a condensed HSR in late S/G2 to an extended, linear chromosome is shown in Fig. 7 (bottom, right).
Not all of the stages defined from the immunofluorescence results were observed in each time series. This was expected considering our 30-min sampling. From Fig. 5, we would predict the linearized stages after HSR decondensation would be maintained over significantly shorter times than the open conformation, which persists for 1–2 h. Some of the stages also may be concealed by the combination of HSR orientation and the less clear, nondeconvolved images. For instance, we suspect that in Fig. 7 (bottom, left), the 7.5-h image represents a linear conformation folded into a curved, “C” shape.
However, the combined in vivo data sets show all of the previously described stages, supporting the overall temporal sequence derived in the previous sections. Specifically, the longer duration, open conformation is observed in every example, with the subsequent linearization and recondensation observed in several other data sets.
We note that the changes in HSR morphology we have described during S–G2 have followed cell synchronization procedures using drug-induced S phase arrest, raising questions relating to possible drug-related side effects. However, examination of HSR morphology in log phase cells that had been pulse labeled with BrdU before fixation showed very similar HSR morphologies to what was observed for the synchronized cells; specifically, we observed indistinguishable HSR morphologies in nuclei with specific BrdU incorporation patterns for both the synchronized and log phase cells (data not shown). Moreover, changes in HSR conformation during G1–S were the same for both synchronized and log phase cells.
Visualization of HSRs by Pre-embedding Immunogold Staining
A closer examination of the HSR conformational changes observed during progression through S phase was provided by EM, using immunogold lac repressor staining on fixed, permeabilized cells that did not express the repressor (Fig. 8). Images are presented as in the EM negative, with electron dense staining corresponding to whiter regions. In early S phase, the HSR is condensed and close to the nuclear envelope, although only parts of the HSR appear to be in actual contact (Fig. 8, A and B). The density of chromatin packing within the HSR is quite high, although stereopairs of semi-thick sections (data not shown) suggest an underlying fibrillar substructure with diameters well above the 30-nm diam of chromatin fibers. This is supported by serial thin sections (Fig. 8, C–E). Arrows and arrowheads point to features suggesting a hierarchy of fiber folding motifs. Specifically, features with ∼100- and 200-nm widths are seen. The ∼100-nm-diam features are consistent with the chromonema fibers we have described previously (Belmont et al., 1994). Several serial section data sets to date consistently show apparent 200-nm fibers at this stage, and initial impressions are suggestive of folding an ∼200-nm fiber to form an ∼400-nm-diam fiber whose folding then forms the compact HSR.
Figure 8.
Changes in HSR ultrastructure during S–G2 progression. (A and B) Condensed, peripherally located HSR (arrow), 0 h after release from early S phase block. (Section thickness 0.5 μm). HSR is condensed and adjacent to nuclear envelope. (C–E) 60-nm-thick serial sections of early S phase HSR. Several levels of chromatin condensation are suggested. Immunogold staining is confined to exterior HSR surfaces. Small arrow points to ∼100-nm fibers, compacted within HSR, similar to chromonema fibers seen throughout nucleus. Arrowheads bracket larger, ∼200-nm-diam features. Several serial section data sets to date consistently show apparent 200-nm fibers at this 0 h stage. (F and G) Decondensed, ball-shaped HSR, 6 h after release from early S phase. HSR (arrow) is adjacent to nucleolus with regions closely apposed to nucleolar surface. (H–J) Different examples of HSR conformation, 6 h after release from early S phase. (H) 0.5-μm section with HSR adjacent to nuclear envelope suggestive of a 0.3–0.4-μm chromatid curled into “C” shape. (I) decondensed HSR with extended chromonema fiber (arrow) (0.2-μm section). (J) Linear HSR (60-nm section). Arrowheads bracket an ∼0.2–0.25-μm-diam segment, bottom right suggests parallel chromatids, with arrowhead pointing to chromonema fiber outlined by peripheral gold staining. Bars: (A–J) 0.5 μm.
A range of HSR morphologies is observed 6 h after release from the early S phase block (Fig. 8, F–J), as expected (Fig. 5). An HSR matching the open, internally located pattern associated with HSR DNA replication (Fig. 8, F and G) can be recognized by its size, ∼1.8 × 1 μm, and dispersed, loosened substructure (see Fig. 4 B). Part of the HSR is closely associated with the surface of a nucleolus, which has also been observed in a significant number of other examples of this HSR stage by both electron and light microscopy, including in vivo observations. An ∼100-nm-diam substructure, consistent with folding of chromonema fibers, is more obvious at this less condensed stage. Based on the BrdU–lac repressor double staining results (Table III), 9/9 of HSRs with this conformation were undergoing DNA replication. There is no indication of a specialized replication factory or subnuclear organelle, rather the large-scale chromatin packing appears similar to that seen at other stages.
Additional examples from this 6 h time point (Fig. 8, H–J) are suggestive of other HSR conformations assigned by light microscopy, but unambiguous assignments are not possible without serial sectioning. An early stage of HSR decondensation is suggested in Fig. 8 H. The HSR is closely associated with the nuclear envelope and compact. Interestingly, it appears to be formed by the tight curvature of an ∼0.4-μm-diam fiber, with hints in the stereo pair of internal ∼0.2–0.3-μm fibers (data not shown), with an overall contour length of ∼2.5 μm. A similar, curved fiber appearance was seen in the in vivo light microscopy sequence Fig. 7 (bottom, left, 5 h) at the beginning of HSR decondensation.
Extended, ∼100-nm chromonema fibers are seen in decondensed HSRs (Fig. 8 I, arrow), demonstrating the similarity of large-scale substructure found within the HSR and the surrounding chromatin. A highly condensed HSR, most likely corresponding to a linear HSR conformation, is suggestive of paired daughter chromatids, ∼0.4-μm diam (Fig. 8 J, right); a linear segment to the left and above is ∼0.25 μm in width. An arrow marks an ∼100-nm segment, outlined by immunogold labeling, within the HSR.
Discussion
Summary
Previous work has described a large degree of heterogeneity when comparing large-scale chromatin structure within a single nucleus or between nuclei in a population of log phase cells. Although changes in overall chromatin structure as a function of the interphase cell cycle have been described, it has never been clear how tightly correlated these structural transitions are to cell cycle progression. Using a new methodology for selectively staining specific chromosome regions, we now have demonstrated a precise choreography of changes in large-scale chromatin organization occurring with each cell cycle for a late replicating, heterochromatic amplified chromosome region, or HSR. Dramatic reorganization and changes in intranuclear positioning of this HSR occur at specific times during the interphase cell cycle, as summarized in Fig. 9.
Figure 9.

Summary of changes in A03_1 HSR conformation and intranuclear position as a function of cell cycle progression. (A) shows a sequence of different conformations and intranuclear positions seen for the HSR during interphase; gray color of HSR denotes DNA replication; (B) the approximate cell cycle timing for each of the stages in this sequence.
Biological Implications and Connections
Chromatid Coiling.
Evidence for the coiling, possibly helical, of a prophase-like chromatid to form the final metaphase chromosome has accumulated over several decades. Most of this work has been derived either from in vitro manipulation of metaphase chromosomes or by partial inhibition of chromosome condensation in vivo (Ohnuki, 1968; Rattner and Lin, 1985; Boy de la Tour and Laemmli, 1988). A possible objection to all of these studies is that by altering normal chromosome structure by various manipulations a coiled conformation could be induced that is unrelated to the actual physiological folding process leading to metaphase chromosome condensation.
Through direct observation of the normal, physiological chromosome decondensation associated with late telophase/ early G1 chromosome, we now present data supporting the concept of the uncoiling of metaphase chromosomes into an underlying, ∼0.3–0.4-μm chromatid decondensation. Chromosomes after mitosis showed an extension, often abrupt, occurring nonsynchronously in daughter cells during late telophase/early G1 with a roughly twofold extension in length. The telophase HSR width was increased relative to metaphase, suggestive of a partial unwinding, and both three-dimensional light microscopy optical sectioning and EM stereopairs were suggestive of a coiled fiber forming these loosened telophase chromatids. In further support of the coiled model for metaphase chromosome structure, the length of the HSR in early prophase nuclei was the same as that seen for the extended late telophase/ early G1 HSR, suggesting a similar ultrastructure just before condensation into metaphase chromosomes.
Whereas our results support a model in which an ∼0.3– 0.4-μm-diam fiber folds to form the final metaphase chromatid, it remains unclear whether this folding process occurs through a helical versus irregular coiling. Future three- dimensional reconstructions of the A03_1 HSR by EM serial section and tomographic reconstructions should resolve this question.
Chromosome Axis Formation and Hierarchical Models of Chromosome Folding
Surprisingly, we observed a distinct chromosome axis and condensed chromatid for the A03_1 HSR in early G1, middle to late S phase, and G2 nuclei, with the compaction ratio of the linear HSR during late S phase only several-fold lower than during metaphase. In vitro chromosome assembly experiments have suggested a requirement for the XCAP C and E condensin complex for both initiation and maintenance of chromosome condensation (Hirano and Mitchison, 1994; Hirano et al., 1997). Based on initial in vitro and in vivo studies, the XCAP complex is targeted to chromosomes during mitosis (Hirano and Mitchison, 1994; Saitoh et al., 1994; Hirano et al., 1997) and it has been suggested that XCAP function may involve the coiling of a prophase chromatid and/or the formation of a distinct chromosome axis (Peterson, 1994; Gasser, 1995; Saitoh et al., 1995). Our observation of a distinct chromosome axis during interphase for the A03_1 HSR therefore raises interesting questions regarding the structural motifs and biochemical components underlying chromatid axis formation.
One current proposal for mitotic chromosome structure is the coiled/radial loop model in which radial loops of 30-nm chromatin fibers are organized by a chromosome scaffold that itself is helically coiled (Rattner and Lin, 1985; Boy de la Tour and Laemmli, 1988). In contrast, we have visualized large-scale chromatin fibers ∼100 nm in diameter and this has led us to propose a hierarchical model of chromosome structure (Belmont and Bruce, 1994; Belmont, 1997). Although the highly condensed conformation of the A03_1 HSR does not facilitate investigation into these lower levels of large-scale chromatin structure, our results presented in this paper further support a hierarchical model of chromosome architecture.
The highest level of condensation would correspond to the uncoiling of the ∼1.3-μm metaphase chromatid into the ∼2.2-μm extended, early G1 chromatid. The visualization of ∼4-μm chromatids during late stages of HSR replication suggests an additional unfolding step corresponding to a still lower level of organization. In fact, a small percentage of light microscopy images of early G1 nuclei, including one in vivo data set, show portions of the extended late telophase/early G1 HSR conformation further uncoiling into thinner, and longer linear fibers (data not shown). This additional uncoiling may be related to the ∼0.2-μm-wide features seen in the thin EM serial sections of condensed HSRs shown in Fig. 8. Finally, a third level of uncoiling is implied by the fibrillar substructure of the decondensed, open HSR conformation, with organization of the HSR into the ∼100-nm chromonema fibers we have described previously, as illustrated in Fig. 8. Recently, we have targeted a lac repressor protein, fused with the VP16 acidic activation domain, to the A03_1 HSR. Localization of this transcriptional activator to the A03_1 HSR leads to a striking decondensation of the HSR into long, extended fibers, ∼100 nm in diameter (Tumbar, T., G. Li, G. Sudlow, and A.S. Belmont. 1996. Mol. Biol. Cell. 7:100a; Tumbar, T., G. Li, G. Sudlow, and A.S. Belmont, manuscript in preparation).
Intranuclear Chromosome Movements and DNA Replication
Previous work has demonstrated cell cycle changes in centromere intranuclear positioning (Ferguson and Ward, 1992; Vourc'h et al., 1993). We now extend these previous observations by describing a specific example of chromosome motion in which the A03_1 HSR moves from the nuclear periphery to the nuclear interior during a 1–2-h period during middle to late S phase; both the motion and accompanying HSR decondensation precede initiation of DNA replication.
This change in HSR position could be a result of its decondensation into the nuclear interior from its NE attachment point. However, the interiorly located, decondensed HSRs show no apparent connections of lac repressor staining to the nuclear periphery. Moreover, in several examples the late replicating arm of the HSR-containing chromosome can be visualized as attached at the distal end to the nuclear envelope with its proximal end extending inwards towards the interiorly located HSR. We must conclude therefore that the HSR does in fact show a movement within the nucleus. A second possibility is that the same chromatin modifications driving HSR decondensation might also eliminate HSR NE binding. The HSR might then show random diffusion away from the nuclear envelope. A third possibility is that there is a directed motion of the HSR within the nucleus through unknown mechanisms.
The discrete nature and characteristic sizes and nuclear location of replication foci during S phase have led to the concept of motion of chromosome regions to specific intranuclear locations for replication (Jackson and Cook, 1995). The A03_1 HSR intranuclear repositioning is correlated with HSR replication. However, the HSR initiates replication at an S phase stage in which most of the replicating DNA is peripherally located, decreasing the attractiveness of a model in which the HSR moves to a preexisting replication body. Alternatively, this HSR movement may be associated with changes in transcriptional activity accompanying the HSR decondensation. Preliminary results, including limited in vivo observations, suggest a large fraction of the decondensed, interiorly located HSRs appear attached to the nucleolus. More extensive in vivo observations are now beginning that will focus on the dynamics of this motion.
Possible Links to Heterochromatin Behavior
The highly condensed conformation of the A03_1 HSR, its peripheral location adjacent to the NE, and its replication in middle to late S phase suggests it has heterochromatin-like properties. The origin of these heterochromatin-like properties is currently unclear. They might result from the large number of lac operator repeats and vector copies within the A03_1 HSR (Csink and Henikoff, 1996). Alternatively, they may result from coamplification of heterochromatin. Whatever their origin, certain correlations of the A03_1 cell cycle behavior with observations from other systems involving heterochromatin behavior are intriguing.
For instance, insertion of an ∼1-Mbp repetitive, heterochromatic sequence into the brown locus leads to a repositioning of this locus to the chromocenter (Csink and Henikoff, 1996; Dernburg et al., 1996). This association with the chromocenter occurs in G1 nuclei and early S phase, while in late S and G2 the locus is not associated with the chromocenter (Csink, A.K., and S. Henikoff, unpublished results). This timing is strikingly similar to that observed for association of the A03_1 HSR with the nuclear envelope. We speculate that similar cell cycle modulations in heterochromatin structure are occurring in both systems, leading to the modulated association of heterochromatin with either the chromocenter in Drosophila or the nuclear periphery in CHO cells.
A second interesting observation involves heterochromatin induced gene silencing. β Globin genes linked to an incomplete locus control region (LCR) are partially silenced when integrated into centromeric heterochromatin regions. In one pattern of silencing, a small but characteristic percentage of cells within a given cell clone escape silencing; this has been proposed to be due to an escape from silencing during a specific cell cycle stage (Milot et al., 1996). We have shown a pronounced decondensation of the A03_1 HSR occurring during middle to late S phase. We speculate that a similar, cell cycle–dependent change in large-scale chromatin organization of centromere regions may allow restricted expression of the globin transgenes during middle to late S phase, accounting for the escape from silencing of the globin gene in these cell clones.
The A03_1 HSR provides an excellent cytological system to investigate issues related to nuclear positioning of chromosomal loci, formation of condensed large-scale chromatin structure, and the relationship between transcription and heterochromatin formation.
Acknowledgments
This work was supported by National Institutes of Health grant GM42516 to A. Belmont. Electron microscopy was carried out at the Beckman Visualization laboratory at UIUC.
Abbreviations used in this paper
- BrdU
bromodeoxyuridine
- DAPI
4,6-diamidino-2-phenylindole
- GFP
green fluorescent protein
- HSR
homogeneously staining region
- NE
nuclear envelope
- NLS
nuclear localization signal
Footnotes
Address all correspondence to Dr. Andrew S. Belmont, Department of Cell and Structural Biology, B107 Chemical and Life Sciences Building, 601 South Goodwin Avenue, University of Illinois, Urbana-Champaign, Urbana, IL 61801. Tel.: (217) 244-2311. Fax: (217) 244-1648. E-mail: asbel@uiuc.edu
References
- Becker, W.M., J.B. Reece, and M.F. Poenie. 1996. The World of the Cell. The Benjamin/Cummings Publishing Co., Menlo Park. 434–435.
- Belmont, A.S. 1997. Large–scale chromatin organization. In Genome Structure and Function. Kluwer Academic Publishers, Dordrecht, Germany. 261–276.
- Belmont AS, Bruce K. Visualization of G1 chromosomes—a folded, twisted, supercoiled chromonema model of interphase chromatid structure. J Cell Biol. 1994;127:287–302. doi: 10.1083/jcb.127.2.287. [DOI] [PMC free article] [PubMed] [Google Scholar]
- Belmont AS, Sedat JW, Agard DA. A three-dimensional approach to mitotic chromosome structure: evidence for a complex hierarchical organization. J Cell Biol. 1987;105:77–92. doi: 10.1083/jcb.105.1.77. [DOI] [PMC free article] [PubMed] [Google Scholar]
- Belmont AS, Braunfeld MB, Sedat JW, Agard DA. Large-scale chromatin structural domains within mitotic and interphase chromosomes in vivo and in vitro. Chromosoma. 1989;98:129–143. doi: 10.1007/BF00291049. [DOI] [PubMed] [Google Scholar]
- Belmont AS, Zhai Y, Thilenius A. Lamin B distribution and association with peripheral chromatin revealed by optical sectioning and electron microscopy tomography. J Cell Biol. 1993;123:1671–1685. doi: 10.1083/jcb.123.6.1671. [DOI] [PMC free article] [PubMed] [Google Scholar]
- Boy de la Tour E, Laemmli UK. The metaphase scaffold is helically folded: sister chromatids have predominately opposite helical handedness. Cell. 1988;55:937–944. doi: 10.1016/0092-8674(88)90239-5. [DOI] [PubMed] [Google Scholar]
- Chen J, Kanai Y, Cowan NJ, Hirokawa N. Projection domains of MAP2 and tau determine spacings between microtubules in dendrites and axons. Nature. 1992;360:674–677. doi: 10.1038/360674a0. [DOI] [PubMed] [Google Scholar]
- Csink AK, Henikoff S. Genetic modification of heterochromatin association and nuclear organization in Drosophila. . Nature. 1996;381:529–531. doi: 10.1038/381529a0. [DOI] [PubMed] [Google Scholar]
- Dancher G. Localization of gold in biological tissue. A photochemical method for light and electron microscopy. Histochemistry. 1981;71:81–88. doi: 10.1007/BF00592572. [DOI] [PubMed] [Google Scholar]
- Dernburg AF, Broman KW, Fung JC, Marshall WF, Philips J, Agard DA, Sedat JW. Perturbation of nuclear architecture by long-distance chromosome interactions. Cell. 1996;85:745–759. doi: 10.1016/s0092-8674(00)81240-4. [DOI] [PubMed] [Google Scholar]
- Ferguson M, Ward DC. Cell cycle dependent chromosomal movement in pre-mitotic human T-lymphocyte nuclei. Chromosoma. 1992;101:557–565. doi: 10.1007/BF00660315. [DOI] [PubMed] [Google Scholar]
- Fricker M, Hollinshead M, White N, Vaux D. Interphase nuclei of many mammalian cell types contain deep, dynamic, tubular membrane-bound invaginations of the nuclear envelope. J Cell Biol. 1997;136:531–544. doi: 10.1083/jcb.136.3.531. [DOI] [PMC free article] [PubMed] [Google Scholar]
- Gasser SM. Chromosome structure-coiling up chromosomes. Curr Biol. 1995;5:357–360. doi: 10.1016/s0960-9822(95)00071-6. [DOI] [PubMed] [Google Scholar]
- Giloh H, Sedat JW. Fluorescence microscopy: reduced photobleaching of rhodamine and fluorescein protein conjugates by n-propylgallate. Science. 1983;217:1252–1255. doi: 10.1126/science.7112126. [DOI] [PubMed] [Google Scholar]
- Helm R, Cubitt AB, Tsien RY. Improved Green Fluorescence. Nature. 1995;373:663–664. doi: 10.1038/373663b0. [DOI] [PubMed] [Google Scholar]
- Hirano T, Mitchison TJ. A heterodimeric coiled–coil protein required for mitotic chromosome condensation in vitro. Cell. 1994;79:449–458. doi: 10.1016/0092-8674(94)90254-2. [DOI] [PubMed] [Google Scholar]
- Hirano T, Kobayashi R, Hirano M. Condensins, Chromosome condensation protein complexes containing XCAP-C, XCAP-E and a Xenopus homolog of the Drosophila Barren protein. Cell. 1997;89:511–521. doi: 10.1016/s0092-8674(00)80233-0. [DOI] [PubMed] [Google Scholar]
- Hiraoka Y, Swedlow JR, Paddy MR, Agard DA, Sedat JW. Three-dimensional multiple-wavelength fluorescence microscopy for the structural analysis of biological phenomena. Semin Cell Biol. 1991;2:153–165. [PubMed] [Google Scholar]
- Jackson DA, Cook PR. The structural basis of nuclear function. Int Rev Cytol. 1995;162:125–149. doi: 10.1016/s0074-7696(08)61230-9. [DOI] [PubMed] [Google Scholar]
- Lawrence JB, Singer RH, McNeil JA. Interphase and metaphase resolution of different distances within the human dystrophin gene. Science. 1990;249:928–932. doi: 10.1126/science.2203143. [DOI] [PubMed] [Google Scholar]
- Milot E, Strouboulis J, Trimborn T, Wijgerde M, de Boer E, Langeveld A, Tan-Un K, Vergeer W, Yannoutsos N, Grosveld F, Fraser P. Heterochromatin effects on the frequency and duration of LCR-mediated gene transcription. Cell. 1996;87:105–114. doi: 10.1016/s0092-8674(00)81327-6. [DOI] [PubMed] [Google Scholar]
- O'Keefe RT, Henderson SC, Spector DL. Dynamic organization of DNA replication in mammalian cell nuclei: Spatially and temporally defined replication of chromosome-specific α-satellite DNA sequences. J Cell Biol. 1992;116:1095–1110. doi: 10.1083/jcb.116.5.1095. [DOI] [PMC free article] [PubMed] [Google Scholar]
- Ohnuki Y. Structure of chromosomes: 1. Morphological studies of the spiral structure of human somatic chromosomes. Chromosoma. 1968;25:402–428. doi: 10.1007/BF02327721. [DOI] [PubMed] [Google Scholar]
- Parra I, Windle B. High resolution visual mapping of stretched DNA by fluorescent hybridization. Nat Genet. 1993;5:17–21. doi: 10.1038/ng0993-17. [DOI] [PubMed] [Google Scholar]
- Peterson CL. The SMC family: novel motor proteins for chromosome condensation? . Cell. 1994;79:389–392. doi: 10.1016/0092-8674(94)90247-x. [DOI] [PubMed] [Google Scholar]
- Pixton J, Belmont AS. NewVision: a program for interactive navigation and analysis of muliple 3-D data sets using coordinated virtual cameras. J Struct Biol. 1996;116:77–85. doi: 10.1006/jsbi.1996.0014. [DOI] [PubMed] [Google Scholar]
- Rattner JB, Lin CC. Radial loops and helical coils coexist in metaphase chromosomes. Cell. 1985;42:291–296. doi: 10.1016/s0092-8674(85)80124-0. [DOI] [PubMed] [Google Scholar]
- Robinett CC, Straight A, Li G, Willhelm C, Sudlow G, Murray A, Belmont AS. In vivo localization of DNA sequences and visualization of large-scale chromatin organization using lac operator/repressor recognition. J Cell Biol. 1996;135:1685–1700. doi: 10.1083/jcb.135.6.1685. [DOI] [PMC free article] [PubMed] [Google Scholar]
- Saitoh N, Goldberg IG, Wood ER, Earnshaw WC. ScII: An abundant chromosome scaffold protein is a member of a family of putative ATPases with an unusual predicted tertiary structure. J Cell Biol. 1994;127:303–318. doi: 10.1083/jcb.127.2.303. [DOI] [PMC free article] [PubMed] [Google Scholar]
- Saitoh N, Goldberg I, Earnshaw WC. The SMC proteins and the coming of age of the chromosome scaffold hypothesis. Bioessays. 1995;17:759–766. doi: 10.1002/bies.950170905. [DOI] [PubMed] [Google Scholar]
- Suau P, Bradbury EM, Baldwin JP. Higher–order structures of chromatin in solution. Eur J Biochem. 1979;97:593–602. doi: 10.1111/j.1432-1033.1979.tb13148.x. [DOI] [PubMed] [Google Scholar]
- Subramani S, Mulligan R, Berg P. Expression of the mouse dihydrofolate reductase complementary deoxyribonucleic acid in simian virus 40 vectors. Mol Cell Biol. 1981;1:854–864. doi: 10.1128/mcb.1.9.854. [DOI] [PMC free article] [PubMed] [Google Scholar]
- Tobey RA, Crissman HA. Preparation of large quantities of synchronized mammalian cells in late G1 in the pre-DNA replicative phase of the cell cycle. Exp Cell Res. 1972;75:460–464. doi: 10.1016/0014-4827(72)90453-3. [DOI] [PubMed] [Google Scholar]
- Tobey RA, Oishi N, Crissman HA. Cell cycle synchronization: reversible induction of G2 synchrony in cultured rodent and human diploid fibroblasts. Proc Natl Acad Sci USA. 1990;87:5104–5108. doi: 10.1073/pnas.87.13.5104. [DOI] [PMC free article] [PubMed] [Google Scholar]
- Urlaub G, Mitchell PG, Kas E, Chasin LA, Funanage VL, Myoda TT, Hamlin J. Effect of gamma rays at the dihydrofolate reductase locus: deletions and inversions. Somatic Cell Molec Genet. 1986;12:555–566. doi: 10.1007/BF01671941. [DOI] [PubMed] [Google Scholar]
- Vourc'h C, Taruscio D, Boyle AL, Ward DC. Cell cycle-dependent distribution of telomeres, centromeres, and chromosome-specific subsatellite domains in the interphase nucleus of mouse lymphocytes. Exp Cell Res. 1993;205:142–151. doi: 10.1006/excr.1993.1068. [DOI] [PubMed] [Google Scholar]