

Abstract
Thymus development depends on a complex series of interactions between thymocytes and the stromal component of the organ. To identify regulated genes during this codependent developmental relationship, we have applied an RNA fingerprinting technique to the analysis of thymus expansion and maturation induced in recombinase-deficient mice injected with anti-CD3 antibodies. This approach led us to the identification of a gene encoding a new member of the immunoglobulin superfamily, named epithelial V-like antigen (EVA), which is expressed in thymus epithelium and strongly downregulated by thymocyte developmental progression. This gene is expressed in the thymus and in several epithelial structures early in embryogenesis. EVA is highly homologous to the myelin protein zero and, in thymus-derived epithelial cell lines, is poorly soluble in nonionic detergents, strongly suggesting an association to the cytoskeleton. Its capacity to mediate cell adhesion through a homophilic interaction and its selective regulation by T cell maturation might imply the participation of EVA in the earliest phases of thymus organogenesis.
Thymus organogenesis depends upon a complex series of interactions among cells of different embryonic origin. The alymphoid epithelial thymic primordium originates from the third pharyngeal pouch and requires the inductive effect of mesenchyme for appropriate morphogenesis (Auerbach, 1960). Subsequently, the advent of hemopoietic precursors at day 10.5 of fetal life initiates the multiple thymocyte–stroma interactions that critically settle the architectural and functional organization of the mature organ (van Ewijk, 1991; Boyd et al., 1993).
The potential role of various cell adhesion molecules in governing early stages of thymocyte development, as well as thymic epithelium organization, has been described. LFA-1/ICAM-1 interactions have been shown to play a role in thymocyte maturation and proliferation (Fine and Kruisbeek, 1991). Thy-1 supports adhesion of thymocyte to thymic epithelial cells through a heterophilic interaction that can be inhibited by sulfated glycans (Hueber et al., 1992). The α6β4 (Wadsworth et al., 1992) and VLA-4 (Sawada et al., 1992) integrins display a developmentally regulated pattern of expression with the highest level in thymocyte before TCR rearrangement, suggesting a role for these molecules in mediating adhesion of early thymocyte to stroma. Extracellular matrix proteins have been detected in the thymus; it has been shown that early thymocytes adhere to thymus epithelium through fibronectin expressed by the stromal cell and that blockade of this interaction has an impact on T cell maturation (Utsumi et al., 1991). Additionally, merosin–thymocyte interaction has been suggested to play a role in T cell development (Chang et al., 1993). Recently, homophilic E-cadherin interactions have been shown to be critically involved in the generation of a functional thymic environment and in cellular interactions occurring in the early phases of T cell development (Muller et al., 1997).
Maturation of αβ T cells is characterized by the progression of double negative (DN)1 precursors expressing neither CD4 nor CD8, to a double positive (DP) CD4+8+ stage after low-level CD8 expression. As defined by interleukin-2 (IL-2) receptor (CD25) and CD44 expression, the DN stage can be ordered in the following developmental sequence of phenotypes: DN CD44+25− > DN CD44+25+ > DN CD44−25+ (Godfrey and Zlotnik, 1993). The attainment of DP stage is defined β selection, because it is mainly controlled by TCRβ gene rearrangement and expression in association with pre-TCR-α (von Boehmer and Fehling, 1997). Cells that have succeeded in β selection expand and undergo a further recombination event allowing TCR-α rearrangements to occur (Petrie et al., 1993), followed by major histocompatibility complex–driven clonotypic αβ selection (von Boehmer, 1994). Recombinase– activating-2 gene deficient (RAG-2−/−) mice, in which TCR-β gene cannot rearrange, display a block at the CD44−CD25+ stage (Shinkai et al., 1992). A scarcely populated cortex is apparent and there is absence of the medullary compartment (Holländer et al., 1995), consistent with the observed requirement for a functionally “mature” TCR–CD3 complex for the development of the medulla (Negishi et al., 1995). In vivo treatment of RAG-2−/− mice with anti-CD3ε mAb induces transition of DN into DP thymocytes with cell proliferation, cell size reduction, and other phenotypic modifications characteristic of this transition (Jacobs et al., 1994; Shinkai and Alt, 1994). In this respect, the RAG-deficient thymus offers a unique opportunity to obtain the earliest lymphoid precursors uncontaminated with later-stage cells, and an organ phenotypically arrested at 14 or 15 d of embryonic life that can be induced to expand and differentiate.
To identify genes whose expression is selectively regulated during thymus development, we applied a PCR-based differential screening approach (RNA fingerprinting) (Malgaretti et al., 1997), comparing thymus RNAs extracted from untreated RAG-2−/− mice and from the same mutants treated in vivo with anti-CD3ε antibodies. Among other genes displaying differential expression identified in this way, we have isolated a new member of the immunoglobulin gene superfamily. The gene, named epithelial V-like antigen (Eva), encodes a putative transmembrane type 1 glycoprotein, bearing an immunoglobulin V-type domain. The gene is expressed at high levels in the thymic epithelium of RAG-2−/− mice and is almost completely downregulated by in vivo treatment with anti-CD3ε mAbs. The gene is expressed in thymus-derived epithelial cell lines and in various epithelia in development and adulthood. Here, we present the cloning, sequence, and initial genetic, biochemical, and functional characterization of this new protein of potential relevance as homotypic adhesion molecule in development, specifically in the early stages of thymus organogenesis.
Materials and Methods
General Procedures
Standard molecular techniques, including nucleic acid purification, restriction analysis, gel electrophoresis, cloning, subcloning, dideoxy-sequencing, probe radiolabeling, Northern and Southern analysis, and library screening were performed according to established protocols (Sambrook et al., 1989).
Animals
4-wk-old C57BL/6 and CD-1 mice were purchased from Charles River Laboratories (Calco, Italy) and RAG-2−/−mice were purchased from Bomholtgard (Ry, Denmark). All mice were bred and maintained in a specific pathogen-free facility at DIBIT-HSR Scientific Institute. RAG-2−/− mice were i.v. injected with 50 μg of anti-CD3ε mAb.
Cell Lines, Antibodies, and Primers
The following cell lines were used in this study: thymus epithelium– derived A89A, A2T (Hiai et al., 1985), TEC (Glimcher et al., 1983), MTE (Lepesant et al., 1990), 24B6 (Yanagihara et al., 1981), and TNC.R3.1 (Nishimura et al., 1990); thymocyte-derived BW5147 (Hyman and Stallings, 1974), M15T, and M14T (Primi et al., 1988); thymic fibroblast 1D4 (Izon et al., 1994); NIH3T3 (CRL-1658; American Type Culture Collection, Rockville, MD); bone marrow stroma–derived BMS2 (Pietrangeli et al., 1988), M210 (provided by A. Aiuti, San Raffaele Scientific Institute, Milan, Italy), and MS-5 (Itoh et al., 1989); multipotent hemopoietic stem cell FDCP mix (Spooncer et al., 1986); fetal skin–derived dendritic cell FSDC (Girolomoni et al., 1995); macrophage cell line MT2 (Lutz et al., 1994); mature T cell line M15S (Primi et al., 1988); monkey COS7 fibroblasts (Gluzman, 1981); and CHO cells (provided by R. Sitia, San Raffaele Scientific Institute). All cell lines were maintained in DME (GIBCO BRL, Gaithersburg, MD) supplemented with 2 mM l-glutamine, 1 mM sodium pyruvate, 5 × 10⁻⁵ M β-mercaptoethanol, 50 U/ml streptomycin, and 10% FCS.
The following mAbs were used in this study: 145-2C11 (anti-CD3ε) (Leo et al., 1987); H129.19 (anti-CD4), 53-6.7 (anti-CD8), AMT-13 (anti-CD25), and AC-40 (anti-actin) (Sigma Chemical Co., St. Louis, MO); 9.3.4.HL.2 (anti-murine CD45) (TIB-122; American Type Culture Collection); G7 (anti-CD90/Thy-1), RA3-6B2 (anti-CD45R/B220) (PharMingen, San Diego, CA); F4/80 (anti-macrophage) (Austyn and Gordon, 1981); 9E10 (anti-myc, CRL-1279; American Type Culture Collection); 327 (anti-v-src) (Oncogene Science, Inc., Manhasset, NY). Rabbit antiserum specific for EVA was obtained by immunizing rabbit 833 with a peptide corresponding to the 21 NH2-terminal residues of the predicted mature protein. The immune serum was affinity purified on EAH Sepharose 48 (Pharmacia Biotech, Inc., Piscataway, NJ) coupled to the relevant peptide. Rabbit complement was purchased from Cedarlane Labs, Ltd. (Hornby, Ontario, Canada).
The following primers were used in this study: DR122 5′-GGGACGTCTACG; Eva forward G1.F 5′-CACGACTGGTTGGCTCCGCT, G1.RT 5′-GGGTGGTCTGGGACGGAAAC; Eva reverse G1.A5 5′-GTGTGCACAACGCTGAGCCGG, G1.T3ON 5′-GGGGTGCTGATGGTGTCCTC; β actin forward 5′-TGACGGGGTCACCCACACTGTGCCCATCTA, β actin reverse 5′-CTAGAAGCATTTGCGGTGGACGATGGAGG.
Gene Isolation and Sequence Analysis
PCR-based differential screening (RNA fingerprinting) (Welsh et al., 1995) was conducted as previously described (Corradi et al., 1996; Malgaretti et al., 1997) to compare mRNAs of thymi from untreated C57BL/6, RAG-2−/− mice and RAG-2−/− mice i.v. injected with 50 μg of 145-2C11 mAb. In the case of treated animals, thymi were dissected 2, 6, and 48 h after antibody injection. DR122 was the arbitrary 12 mer primer used. Thymus RNA extracted from adult RAG-2−/−mice was used to construct a cDNA library cloned into Lambda Zap II (Stratagene, La Jolla, CA). The cDNA isolated by RNA display (G1) was used as a probe to screen library filters containing 106 plaques. Four positive clones were sequenced automatically through a sequencer (model 373; Applied Biosystems, Inc., Foster City, CA) and manually by dideoxy sequencing (Sequenase 2.0, USB, Cleveland, Ohio). Sequences were analyzed through the MacVector software (Oxford Molecular Group) and a contig was assembled through the Sequencher software (DNA Codes). The putative transcription initiation was mapped through the RACE protocol (Frohman et al., 1989). The resulting nucleotide and peptide sequences were aligned to databases of existing sequences through the BLAST network server (Altschul et al., 1990) and through a local Genetics Computer Group (GCG, Madison, WI) package (Devereux et al., 1984). Sequence searches were run against the GenBank, Swissprot, and dbEST databases.
Genetic Mapping
Genetic mapping was achieved using a ([C57BL/6j × SPRET/Ei]F1 × SPRET/Ei) backcross (BSS) generated and distributed by The Jackson Laboratory (Bar Harbor, ME) (Rowe et al., 1994). A 596-bp G1.F/G1.A5 PCR fragment corresponding to the 5′ of the Eva cDNA was used as a probe to identify a Taq1 restriction fragment length polymorphism (RFLP) by Southern hybridization. Its segregation was followed on 96 DNAs, corresponding to the parentals and 94 N2 progeny, and then linkage analysis was performed with the MapManager 2.6 program (Manly and Elliott, 1991).
The human Eva orthologue was mapped in the human genome by Southern blot analysis on nine different YAC clones from the CEPH library (Albertsen et al., 1990) (735-C-9, 742-F-9, 785-C-6, 822-G-8, 828-G-11, 886-D-9, 901-A-11, 936-D-9, and 969-D-7). DNAs were digested with EcoRI and then hybridized with a radiolabeled Eva probe spanning the complete coding region. YAC clones were chosen based on sinteny with the mouse mapping position.
RNase Protection Assay
An antisense riboprobe was generated by in vitro transcription of the G1 fragment subcloned into pBluescript with T3 RNA polymerase and incorporation of [α32P]UTP (800 Ci/mmol) (Promega Corp., Madison, WI). 50 μg RNA from each of different adult mouse tissues were hybridized, treated, and then PAGE separated as described (Ausubel et al., 1995). A densitometer and the ImageQuant software (both from Molecular Dynamics, Inc., Sunnyvale, CA) were used for quantitative analysis of autoradiographs. Value normalization was achieved through a mouse β-actin riboprobe.
Reverse Transcriptase-PCR
B cells were isolated from a C57BL/6 spleen. After organ disruption, T cells were eliminated by complement-mediated cell lysis after incubation with anti-CD4, anti-CD8, and anti-Thy-1 mAbs (Coligan, et al., 1994). Then, B cells were positively selected with anti-B220 magnetic microbeads according to miniMACS cell sorting protocol (Miltenyi Biotec, Sunnyvale, CA). Mature T lymphocytes were positively selected with anti-Thy 1.2 magnetic microbeads from C57BL/6 mesenteric lymphonodes after B-cell depletion with anti-B220 magnetic microbeads. DN thymocytes were isolated from C57BL/6 thymi by positive selection with anti-CD25 mAb and goat anti–rat IgG magnetic microbeads. DP, single positive (SP) thymocytes, and macrophages were previously eliminated by complement-mediated lysis after incubation with anti-CD4, anti-CD8, and anti-macrophage mAbs. Macrophages were isolated from the peritoneal cavity (Coligan et al., 1994). Freshly drawn dendritic cells were obtained as described (provided by F. Galbiati, Hoffmann-La Roche, Milan, Italy) (Guery et al., 1996). Embryos at different days of gestation were separated from extraembryonic tissues under a dissection microscope. RNAs were isolated as described (Chomczynski and Sacchi, 1987). cDNA was generated from 1 μg of RNA by using murine Moloney leukemia virus reverse transcriptase (RT) and oligo-dT (16 mer). G1-RT and G1-T3ON primer pair was used. The size of the amplified fragment on cDNA is 412 bp, whereas no amplified fragment is obtained from genomic DNA.
In Situ Hybridization
Mouse embryos of outbred CD-1 strain and thymi from RAG-2−/− mice were embedded in paraffin, sectioned at 6 μm, and then treated for in situ hybridization as described previously (Teesalu et al., 1996). The putative complete Eva coding sequence, subcloned into pBluescript II SK (Stratagene), termed Eva.cds was used to generate sense and antisense 35S-labeled probes. After hybridization and washes, slides were dipped into Kodak NTB2 emulsion (Eastman-Kodak, Rochester, NY), exposed at 4°C for 1–3 wk and, after standard development, stained with toluidine blue and mounted in DPX mountant (BDH Chemicals Ltd., Dagenham, Essex, UK). Slides were observed and photographs were taken using an Axiophot microscope (Carl Zeiss, Inc., Thornwood, NY).
In Vitro Translation and Transfectants
The Eva.cds construct was used for in vitro transcription and translation experiments in the presence of [35S]methionine, with or without microsomal membranes, as specified by the manufacturer (Promega Corp.). In some experiments, 10 μl of translation mix were treated with the enzyme endo-β-N-acetyl-glucosaminidase H (endo-H) (Boehringer Mannheim Corp., Indianapolis, IN) as described (Ceriotti et al., 1995). Samples were analyzed by SDS-PAGE under reducing conditions and the resolved products were detected by fluorography.
A construct encoding the putative complete EVA protein tagged at the COOH terminus with a c-myc–derived epitope (Wong and Cleveland, 1990) was subcloned into pcDNA3 (Invitrogen, Carlsbad, CA) and introduced in monkey COS7 fibroblasts by DEAE-dextran–mediated transfection. 48 h after transfection, cells were trypsinized, plated on poly-l-lysine–coated glass coverslips (105 cells), fixed with 3% paraformaldehyde, permeabilized with 0.15% Triton X-100 in PBS for 5 min, and immunolabeled with 9E10 anti-myc mAb followed by FITC-conjugated F(ab′)2 fragments of goat anti–mouse IgG (Protos Immunoresearch, San Francisco, CA). Stable transfectants were obtained by introducing the same Eva.myc construct in CHO cells with the calcium-phosphate precipitation protocol and maintaining the cells in medium supplemented with G418 (600 μg/ml).
Biochemical Analysis
A89A and TNC.R3.1 cells were washed three times with cold PBS, resuspended in ice-cold nuclease buffer (50 μg/ml Staphylococcal nuclease, 2mM CaCl2, 20 mM Tris-HCl, pH 8.8) for detachment with a cell scraper. The same nuclease buffer solution was used to harvest multiple plates to reach the final concentration of 50 × 106 cells/ml. The following antiproteases were added: 100 mM PMSF, 10 μg/ml leupeptin, and 10 μg/ml aprotinin; then 0.3% SDS and 10% β-mercaptoethanol were added and mixed on ice. Finally, 100 μg/ml DNase I and 50 μg/ml RNase A were added. Lysates were homogenized by passage through a 23-gauge syringe and were centrifuged in a microfuge for 10 min. COS7 and CHO transfectants were lysed in Triton X-100 lysis buffer (1% Triton X-100, 5 mM EDTA, 1 mM iodoacetamide, 1 mg/ml BSA, 10 mM Tris, pH 8.8, 0.15 M NaCl). Samples were subjected to SDS-PAGE under reducing conditions followed by transfer to nitrocellulose membranes and immunoblotted with 9E10 mAb and anti-EVA rabbit serum. Bound antibodies were revealed by peroxidase-conjugated goat anti–mouse (Dako Corp., Carpinteria, CA) or –rabbit (Sigma Chemical Co.) Ig sera, using the enhanced chemiluminescence detection system (Amersham Pharmacia Biotech, Inc., Piscataway, NJ).
Cell Fractionation
A89A and TNC.R3.1 cells were detached by incubation at 37°C for 10 min in 1 mM PBS-EDTA (10 ml for 50 ml of culture). After two washes in ice-cold PBS, cells were resuspended at 5 × 10⁶/300 μl in hypotonic buffer (20 mM Tris-HCl, pH 7.5, 1 mM EGTA, 1 mM MgCl2, 0.5 mM DTT, and protease inhibitors) and incubated for 10 min on ice. Cells were then disrupted by homogenization on ice with a Dounce homogenizer (30 strokes at low speed and 10 strokes at maximum speed). Salt concentration was adjusted to 150 mM NaCl and intact cells, nuclei, and cytoskeleton were pelleted by centrifugation at 5,000 rpm for 5 min in a microfuge (Eppendorf Scientific Inc., Hamburg, Germany) at 4°C. After two washes in hypotonic buffer, the pellet (P1) was resuspended in Laemmli sample buffer. The low-speed supernatant was centrifuged at 100,000 g for 30 min and the resulting pellet (P100) was considered the membrane fraction, whereas the supernatant (S100) was considered the soluble proteins fraction. Equivalent amounts of all samples were resolved by SDS-PAGE in a 5–15% gradient gel and then immunoblotted with the indicated antibodies.
Cell Aggregation Assay
CHO cells, both pcDNA3- and Eva.myc-transfected, were detached by incubation at 37°C for 10 min in 1mM PBS-EDTA. After two washes in low-Ca Krebs–Ringer–Hepes (KRH) buffer (125 mM NaCl, 5 mM KCl, 1 mM MgSO4, 1 mM KH2PO4, 0.1 mM CaCl2, 33 mM glucose, 25 mM Hepes), cells were resuspended in low-Ca KRH-2% FCS (predialyzed against low-Ca KRH) to a final concentration of 2 × 10⁶ cells/ml by three passages through an 18-gauge syringe. Single-cell suspensions were incubated in 2.5-ml polypropylene tubes with gentle rotation for 60 min at 37°C. Cells were finally plated on glass coverslips, treated, and then immunolabeled as described above. In similar experiments, cells were labeled with different fluorescent lipophilic dyes (Sigma Chemical Co.) before aggregation assay (Litvinov et al., 1994): either PKH2 (green fluorochrome) for Eva.myc-transfectants, or PKH26 (red fluorochrome) for vector-transfected CHO cells, were used. Aggregation index was calculated as D = (N 0 − N t)/N 0, where N 0 is the initial number of particles corresponding to the total number of cells, and N t is the number of remaining particles at the incubation time point t (Shimoyama et al., 1992).
Results
Identification and Cloning of Eva
To identify regulated genes during thymus development, we applied a modified RNA fingerprinting protocol (Malgaretti et al., 1997) to thymi from RAG-2−/− mice at different intervals after the injection of anti-CD3ε mAb (2, 6, and 48 h). We identified a 436-nucleotide band (G1) that was selectively amplified in the thymus cDNA from untreated RAG-2−/− mice. The same band was also detected in cDNA from RAG-2−/− mice 2 and 6 h after treatment, but was almost absent at 48 h (Fig. 1). The band was gel-excised, reamplified, and then cloned into pBluescript II SK. Clones were screened as described (Consalez et al., 1996) and the plasmid G1.A2 was sequenced manually. A database search was run with BLASTN and BLASTX, using the GCG interface (Devereux et al., 1984). One mouse expressed sequence tag (EST) sequence (GenBank/EMBL/ DDBJ accession number AA288427), and several human ESTs (AA336903, H77296, W61215, H48606, AA088807, and N70439) displayed clear similarities to the G1 cDNA (from 99 to 84% identity). cDNA G1.A2 showed an open reading frame of 286 nucleotides, preceded by an in-frame stop codon. G1.A2 was used as a probe to screen a custom-made RAG-2−/− thymus cDNA library. Sequence analysis and assembly of four positive clones revealed a 645-bp open reading frame encoding a deduced 215-amino acid (aa)-long sequence. Analysis of the predicted aa sequence with PROSITE, BLOCKS, and TMAP indicates that G1 encodes a type 1 transmembrane glycoprotein (Fig. 2 A), with a presumptive cleavable 20-aa-long signal peptide and a putative 25-aa-long transmembrane region (residues 151–175). Sequence comparison and alignments done with the PILEUP program showed a putative extracellular region containing a V-like domain: two cysteines (positions 47 and 123), corresponding to the invariant cysteines that form the intrachain disulfide bond in the Ig domain, are located 76 residues apart. The tryptophan at position 63, as well as other residues, such as glycine 40, arginine 90, leucine 109, and tyrosine 121 are typical features of V domains (Carayannopoulos and Capra, 1993). In addition, two potential glycosylation sites and a putative serine phosphorylation site were observed (Fig. 2, A and B). Based on database search results, we also sequenced the human cDNA clone containing H48606 EST, derived from a fetal liver/spleen expression library (I.M.A.G.E. clone N°202065). The human-derived sequence revealed the same features of G1 (Fig. 2 A), with an identity of 79 and 85% at the nucleotide and aa level, respectively. Moreover, database search results and sequence alignment revealed 33% identity and 45% homology with the myelin protein zero (Po), the predominant myelin protein in the peripheral nervous system (Fig. 2 C) (Lemke and Axel, 1985). The G1 nucleotide sequence did not match any known gene and protein (GenBank, EMBL, Swissprot, PIR), and thus represents a new gene, encoding a likely new member of the immunoglobulin superfamily. Based on the sequence and expression data (see below) we named this new gene Eva, for epithelial V-like antigen.
Figure 1.

RNA fingerprinting experiment comparing cDNAs of thymi from C57BL/6, untreated RAG-2−/− mice and RAG-2−/− mice at different times (2, 6, and 48 h) after i.v. injection of anti-CD3ε mAb. RNA fingerprinting RT-PCR reactions were conducted in duplicate at each stage examined. Arrowhead; band corresponding to the Eva transcript.
Figure 2.
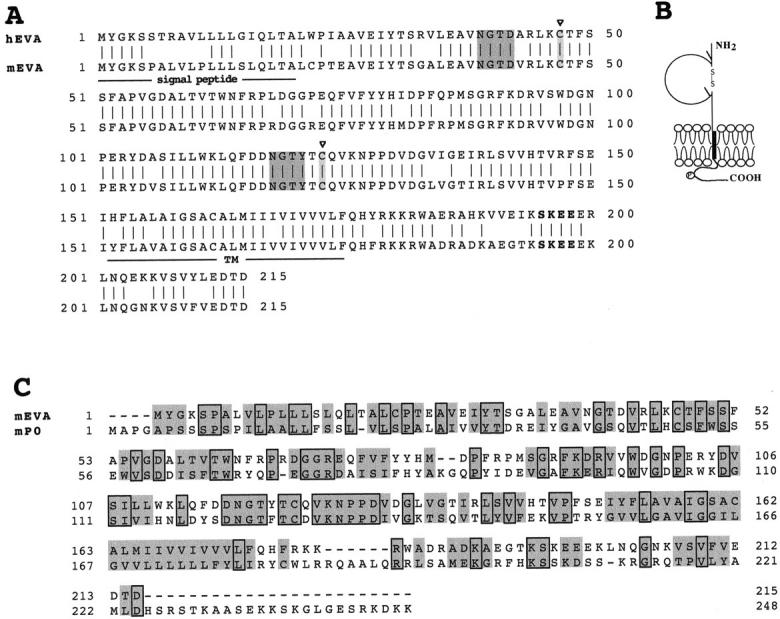
(A) Alignment of the aa sequences encoded by human and murine Eva cDNAs. Left, aa numbering. The predicted leader (signal peptide) and transmembrane sequences are labeled together with the following features: dark-shaded boxes, potential N-linked glycosylation sites; light-shaded boxes, cysteine residues (47 and 123) found in conserved positions within the V-type domain; bold residues, potential protein casein kinase 2 phosphorylation site. These sequence data are available under GenBank/ EMBL/DDBJ accession numbers AF030455 (for human Eva) and AF030454 (for mouse Eva). (B) Model of EVA protein according to prediction results. \\, N-linked glycosylation sites; P, putative protein CK2 phosphorylation site in the cytoplasmic tail. (C) Sequence alignment of mouse EVA and myelin Po proteins. Boxed residues are identical in the two proteins (33%); homologous residues are shaded (45%).
Chromosomal Localization of the Mouse and Human Eva Genes
A TaqI polymorphism was used to type the segregation of Eva alleles in the 94 individual N2 progeny of the BSS backcross by RFLP analysis. 90 out of 94 progeny were successfully typed. Linkage analysis unequivocally localized Eva to mouse chromosome (chr.) 9, 2.25 cM distal to Xmv16 (LOD score 22.6), and 1.12 cM proximal to Cyp1a2 (logarithm of the odds [LOD] score 24.4). The data are summarized in Fig. 3.
Figure 3.

Mapping of Eva in the mouse genome. Top: haplotype and linkage analysis of Eva and flanking loci on mouse chromosome 9 through the analysis of the BSS backcross (The Jackson Laboratory). Empty squares, Mus spretus allele; solid squares, C57BL/6J allele; stippled squares, genotype not determined. Numbers to the right, between rows, indicate recombination fractions ± standard error, and LOD scores. Columns represent different haplotypes observed on chromosome 9. Numbers below columns define the number of individuals sharing each haplotype. Bottom: position of Eva on chromosome 9 with respect to nearby markers independently mapped by others on the BSS backcross. Numbers on the left represent approximate genetic distances (cM) from the most centromeric chromosome 9 marker in this cross. Chromosomal locations of three syntenic human genes, including EVA, are also indicated.
The human Eva orthologue was localized to chr. 11q24 by Southern blot analysis of YAC clones from the CEPH library. The YACs had been identified based on data bank information; in fact, some of the human ESTs homologous to Eva (namely H77296 and H48606, 84% identical to Eva) had been localized on chromosome 11q, between D11S1341 and D11S924, to the human genomic region syntenic to the mouse map position. DNA from nine YAC clones spanning that region were analyzed by Southern hybridization with a probe containing the complete Eva coding region. Of all YACs tested, Eva hybridizes YACs 822-G-8 and 828-G-11. YAC 828-G-11 has been mapped cytogenetically to 11q24 (Rocchi, M., see data available at http://bioserver.uniba.it/fish/rocchi/webbari/2_YAC/800-899/828G11.html).
Regulated Expression of the Eva Gene in RAG-2−/− Thymus
To confirm the expression data obtained by RNA fingerprinting, we performed Northern analysis on total RNAs extracted from thymi of C57BL/6 and RAG-2−/− mice at different intervals after the injection of anti-CD3ε mAb (2, 6, and 48 h). Hybridization was carried out with radiolabeled G1.A2 cDNA. As shown in Fig. 4 A, a 3.4-kb transcript in untreated RAG-2−/− thymi as well as in RAG-2−/− thymi at 2 and 6 h after injection was revealed. As predicted from the RNA fingerprinting pattern, no expression was detectable in wild-type and in RAG-2−/− thymi 48 h after treatment. RNase protection assay (RPA) performed on the same samples (Fig. 4 B) revealed that Eva was also detectable in wild-type and RAG-2−/− thymi 48 h after treatment upon a long gel exposure. Densitometric analysis after normalization with actin showed that Eva expression levels decrease at least 20-fold in RAG-2−/− thymi 48 h after the treatment (data not shown). Furthermore, to confirm downregulation of the Eva transcript in this experimental model, we performed radioactive mRNA in situ hybridization experiments. The RAG-2−/− thymus displayed a strong and uniform signal for the Eva transcript (Figs. 5 and 6), reminiscent of the embryonic thymus pattern (see below), whereas RAG-2−/− thymus 48 h after injection failed to show any signal above background (Fig. 5, C and D); an analogous result was also obtained with wild-type thymus (data not shown).
Figure 4.


(A) Eva mRNA expression in wild-type and RAG-2−/− thymi. Northern analysis on total RNA isolated from thymi of C57BL/6, untreated RAG-2−/− mice and RAG-2−/− mice at different times (2, 6, and 48 h) after anti-CD3ε mAb injection. After hybridization with a labeled cDNA specific for Eva, the filter was stripped and again hybridized with a labeled β-actin probe. The apparent size of the transcript is indicated. (B) Eva mRNA expression in various adult mouse tissues. RNase protection assay with a 437-bp Eva-specific antisense riboprobe on seven adult mouse tissues and thymi of C57BL/6, untreated RAG-2−/− mice, and RAG-2−/− mice i.v. injected with anti-CD3ε mAb. Results obtained with mouse β-actin riboprobe are also shown. (C) Eva mRNA expression in different thymic epithelial cell lines. RT-PCR on mRNA of four thymic epithelial cell lines (A2T, A89A, TEC, and TNC.R3.1). Gene expression on RAG-2−/− thymus was used as control. cDNA-amplified fragment is 412-bp long.
Figure 5.

mRNA in situ hybridization of RAG-2−/− thymi. Eva expression by RAG-2−/−thymi from untreated mice (A and B) and treated animals at 48 h after injection of antibody (C and D). Bright-field views (A and C) and dark-field images (B and D). Note strong, homogeneous labeling of RAG-2−/− thymus, and absence of Eva expression in the thymus from injected mice.
Figure 6.

Eva mRNA in situ hybridization at 13.5 d p.c. (A and B) and 14.5 d p.c. (C and D) embryonic tissue sections. Bright-field images (A and C) and dark-field microphotographs (B and D). (A and B) High levels of Eva transcripts are found in the emerging thymus (A, arrows). Specific labeling can also be seen in epithelia lining the respiratory and gastrointestinal tracts: trachea, esophagus, gut and alveoli are indicated by arrowheads. (C and D) Note labeling of surface ectoderm and submandibulary salivary glands (arrowheads). Bars: (A and B), 165 μm; (C and D), 330 μm.
Eva Distribution in Mouse Tissues and Cell Lines
Total RNA purified from adult mouse organs was used in RPA to characterize the tissue distribution of the Eva transcript. As shown in Fig. 4 B, high expression levels of Eva were observed in the liver and gut, lower levels in the kidney, and very low ones in the lung and brain. No expression was observed by RPA in the spleen and heart. High levels of expression were also found in gut and liver from RAG-2−/− mice (data not shown). Eva expression was also detected in the skin and testis by RT-PCR (Table I). Furthermore, we could detect the Eva transcript in wild-type fetal thymus and liver at day 13.5 post coitum (p.c.) and in whole embryos at the early primitive streak stage (day 7.5 p.c.) (Table I).
Table I.
Expression of Eva Assessed by RT-PCR
| Ex vivo | Cell line | |||||
|---|---|---|---|---|---|---|
| Tissue | ||||||
| Skin | + | T lymphocyte | ||||
| Testis | + | M15S | − | |||
| Cells | Macrophage | |||||
| CD25+ thymocyte | − | MT2 | − | |||
| B lymphocyte | − | Dendritic | ||||
| T lymphocyte | − | FSDC | − | |||
| Macrophage | − | Fibroblast | ||||
| Dendritic | − | NIH3T3 | − | |||
| Bone marrow | − | Bone marrow | ||||
| Fetal thymus | Stroma | |||||
| (day p.c.) | MS-5 | − | ||||
| 13.5 | + | M210 | − | |||
| 14.5 | + | BMS2 | − | |||
| 16.5 | + | Multipotent HSC | ||||
| Fetal liver | FDCP mix | − | ||||
| (day p.c.) | Thymus | |||||
| 13.5 | + | Epithelium | ||||
| 14.5 | + | A89A | − | |||
| 16.5 | + | A2T | − | |||
| Embryo | TEC | + | ||||
| (day p.c.) | MTE | + | ||||
| 7.5 | + | 24B6 | + | |||
| 8.5 | + | TNC.R3.1 | + | |||
| 9.5 | + | Thymocyte | ||||
| 10.5 | + | BW5147 | − | |||
| 11.5 | + | M15T | − | |||
| 11.5* | + | M14T | − | |||
| Fibroblast | ||||||
| 1D4 | − | |||||
Extraembryonic tissue.
To assess the cellular specificity of the Eva transcript, we performed RT-PCR on purified cell populations. Table I summarizes the results that define the non-T cell nature of the transcript. In fact, Eva was neither expressed in purified DN/CD25+ thymocytes that constitute the most abundant cell population in RAG-2−/− thymus, nor in mature T cells. Similarly, no expression was observed in mature B lymphocytes, macrophages, dendritic cells, and bone marrow. To define the histological identity of Eva-expressing cells, we tested various cell lines by RT-PCR. No expression was observed either in MS-5, M210, and BMS2 cells (bone marrow stroma-derived), or in FDCP mix (representing multipotent hemopoietic precursor). Negative results on M15S, NIH3T3, MT2, and FSDC confirmed that Eva is not expressed in T lymphocytes, fibroblasts, macrophages, and dendritic cells. Interestingly, Eva transcript is clearly expressed in four (TEC, MTE, 24B6, and TNC.R3.1) out of six thymic epithelial cell lines (Table I and Fig. 4 C).
Localization of Eva Transcript during Mouse Development
We used radioactive in situ hybridization to localize Eva transcripts in mouse 8.5- and 9.5-d p.c. embryo implantation sites and in 12.5–16.5 d p.c. embryos. At 8.5-d p.c., abundant Eva expression was found in the extraembryonic ectoplacental cone and giant trophoblasts (Teeslau, T., manuscript in preparation), which are trophoectoderm- derived cells important for embryo implantation and placenta formation. In mouse embryos, Eva expression was found in a number of epithelial structures: surface ectoderm, and epithelia lining gastrointestinal and respiratory tracts as well as salivary glands (Fig. 6). At 13.5-d p.c., a prominent signal is evident in the developing thymus (Fig. 6, A and B), and persists through the later embryonic stages analyzed (data not shown).
Characterization of the EVA Protein
To validate sequence analysis data and assess the size of the peptide translated from Eva cDNA corresponding to the open reading frame, we performed in vitro transcription and translation, the latter in the presence or absence of microsomal membranes (Fig. 7 A). The translation product was subjected to SDS-PAGE analysis and two peptide bands, the more abundant migrating with a molecular mass of 32 kD and a weaker one of 30 kD, were obtained only in the presence of microsomal membranes (Fig. 7 A, lane 6). Lack of protein product in Fig. 7 A, lane 5, at this exposure time, represented the transitional arrest by the excess of signal recognition particles described for secretory proteins in reticulocyte lysate system (Wolin and Walter, 1989). This observation suggested that EVA is a membrane-bound protein. The observed protein size was greater than the predicted one (24.5 kD), suggesting posttranslational modifications of the peptide product. Consistently, treatment of the translated polypeptide with endo-H enzyme resulted in the appearance of two additional smaller bands of 30 and 24 kD, respectively, likely to be deglycosylation products (Fig. 7 A, lane 8).
Figure 7.

(A) In vitro translation of mouse Eva transcript. In vitro translation was performed in the absence (lanes 1, 3, and 5) or in the presence (lanes 2, 4, and 6) of canine pancreatic microsomal membranes. Translated polypeptides were fractionated through a 12% SDS-PAGE gel and then analyzed by fluorography. Lanes 1 and 2: no RNA as negative control. Lanes 3 and 4: Saccharomyces cerevisiae α-factor mRNA, used as positive control for both translation and glycosylation. The α-factor and the core-glycosylated precursor have molecular weights of 18.6 and 32 kD, respectively. Lanes 5 and 6, Eva mRNA. Lanes 7 and 8: Eva mRNA as in lane 6 or treated with the enzyme endo-H. Positions of molecular mass markers (in kDs) are indicated on the right. (B) Cellular localization and immunoblot of chimeric EVA. Left, anti-myc immunofluorescence on CHO cells transfected with either pcDNA.3 vector (top) or Eva.myc vector (bottom). Right, anti-myc immunoblot on Triton X-100 lysates from the same cells. (C) Anti-EVA immunoblot. Western analysis with rabbit anti-EVA serum of Triton X-100 lysates from CHO cells transfected with either pcDNA.3 vector or Eva.myc vector and lysates in SDS of thymic epithelial cell lines A89A and TNC.R3.1. (D) EVA recovery in insoluble cell fraction. TNC.R3.1 and A89A cells were lysed in hypotonic buffer and separated into three fractions: P1, pellet of low-speed centrifugation; P100, pellet recovered after 100,000 g centrifugation, S100, soluble fraction. Equivalent amounts of all samples were resolved by SDS-PAGE in a 5–15% gradient gel and immunoblotted with rabbit anti-EVA antiserum, anti-actin and anti-src mAbs. EVA is exclusively present in the P1 fraction of TNC.R3.1 cells.
To further substantiate EVA expression at the cell surface, a construct encoding EVA in frame with a COOH-terminal myc epitope tag (Eva.myc) was generated and transfected into cultured COS cells. A cellular immunofluorescence experiment run on permeabilized transfectants revealed that EVA is clearly present at the cell plasma membrane (Fig. 7 B).
An anti-myc immunoblot on Triton X-100 lysates of CHO cells transfected with the Eva.myc construct revealed a band with a molecular weight of 31–33 kD (Fig. 7 B). The predicted size of the recombinant protein is 25.7 kD, thus the difference between the predicted and the observed size (i.e., 6–8 kD) is in agreement with the one observed among the differently glycosylated products obtained in the in vitro translation experiments. Furthermore, both the recombinant proteins, Eva.cds and Eva.myc, were recognized in immunoblotting by a rabbit antiserum raised against an NH2-terminal peptide of EVA (data not shown and Fig. 7 C). The same antiserum was tested in Western blot analysis on SDS lysates of TNC.R3.1 and A89A cells. Three bands with molecular weights of 32, 30, and 24 kD, respectively, likely corresponding to different glycoforms of EVA, were revealed in the TNC.R3.1 sample and were absent in A89A lysate. The same results were obtained under nonreducing conditions (data not shown), implying that EVA is expressed at the cell surface, and is devoid of interchain disulfide bridges.
Cell Separation and Homotypic Adhesiveness of EVA
The poor recovery of EVA in the soluble fraction of Triton X-100 cell lysates of thymic epithelial cell lines (data not shown) prompted us to separate cells into soluble and particulate fractions to determine the solubility of EVA and assess its association with the cytoskeleton, as it has been proposed for the Po protein (Wong and Filbin, 1994). TNC.R3.1 and A89A cells were lysed in hypotonic buffer and then separated in P1 (containing nuclei and cytoskeleton), P100 (membranes), and S100 (soluble proteins) fractions, as detailed in Materials and Methods. Immunoblots of these fractions with anti-EVA rabbit serum 833 revealed the almost exclusive presence of EVA in the P1 fraction of TNC.R3.1 cells at this exposure time (Fig. 7 D). Only long exposures of the membrane revealed the presence of EVA in the P100 fraction, implying that EVA is predominantly insoluble in hypotonic buffer. The same membranes were stripped and hybridized with anti-actin and anti-Src mouse mAbs. Fig. 7 D shows the presence of actin in the P1 and S100 fractions, as expected, and of Src exclusively in the P100 fraction, demonstrating the effectiveness of the lysis and the efficient isolation of cell membranes. The same result was obtained using TEC cells (data not shown). Whether the insolubility of EVA is due to formation of large homotypic aggregates (see below) or to association with cytoskeleton is under investigation.
To evaluate the adhesive properties of EVA-expressing cells, we performed an aggregation assay in which EVA. myc.transfected CHO and mock-transfected CHO cells were labeled with different lipophilic fluorochromes. Single-cell suspensions were allowed to aggregate and the presence of cell clusters was monitored by microscopic examination. As shown in Fig. 8 A, nonrecombinant pcDNA3-transfected CHO cells were scattered as a single-cell suspension, whereas EVA-expressing CHO cells formed large cell clusters after 60 min of incubation (Fig. 8 B). Large aggregates (> 10 cells) were observed only in the case of Eva-transfected cells and the aggregation index appeared to be fourfold higher than the one observed with parental cells (Fig. 8 C). Same results were obtained also when the aggregation assay was performed with unlabeled cells (data not shown). When monocellular suspensions of the two cell lines were mixed in a 1:1 ratio, EVA-expressing cells aggregated on their own (Fig. 8 D) in a 90-min assay, but not at 30 min, and random incorporation of parental CHO into aggregates was observed within a range between 10 and 20% (data not shown). Furthermore, when the two unlabeled cell lines were mixed at a 1:1 ratio and stained with FITC-labeled 9E10 anti-myc mAb, the obtained cell clusters were selectively fluorescent, whereas scattered cells were detected only by phase-contrast analysis (Fig. 8, E and F). These results demonstrate that EVA expression can mediate cell aggregation, most likely through an homotypic interaction.
Figure 8.

EVA-mediated cell aggregation. Nonrecombinant pcDNA.3-transfected CHO and Eva.myc-transfected CHO were detached and labeled, either with PKH26 or PKH2, respectively. After dissociation, the two cell lines were allowed to aggregate in suspension culture, either alone or mixed in a 1:1 ratio, and then analyzed 90 min after incubation in low Ca buffer. Vector-transfected cells are scattered as a single cell suspension (A), whereas large cell clusters are formed by Eva.myc- expressing cells (B). Extent of aggregation is expressed by aggregation index, calculated as D = (N0 - N90)/N0. Large aggregates (>5 cells) represented the 8.5% of the total events in mock-transfected cells and 60% in Eva-myc cells (C). In the coculture, EVA-expressing cells aggregate on their own; random incorporation of parental CHO into aggregates never exceeded 10–20% (D). Coaggregation experiments with unlabeled cells were done as described above. Immunofluorescence staining with anti-myc mAb shows selective labeling of cells forming aggregates (E), when compared with phase-contrast analysis of the same field (F). Bars: (A and B) 50 μm; (D–F) 25 μm.
Discussion
Recombinase-deficient mice display a T cell maturation arrest at an early lymphoid precursor stage (DN CD25+ CD44−) (Shinkai et al., 1992). Since organogenesis depends on thymocyte–stroma cross-talk, this thymocyte defect also has an impact on the stromal component of the thymus, which fails to develop a medullary compartment (Holländer et al., 1995). Moreover, it is clear from various experimental systems that thymocytes at different maturation stages exert a distinct influence on stromal epithelial cells (Boyd et al., 1993; Ritter and Boyd, 1993). In RAG-2−/− mice, massive transition to the thymocyte DP stage can be induced by in vivo cross-linking of CD3, which is expressed at low level on the membrane of RAG-2−/− thymocytes (Jacobs et al., 1994; Shinkai and Alt, 1994). This treatment induces the characteristic phenotypic modifications occurring in thymocytes during the physiological transition (Nikolic-Zugic, 1991) and determines the expansion of the cortex that becomes histologically indistinguishable from the wild-type counterpart (data not shown).
We have exploited the possibility to time a synchronous T cell maturation event offered by this experimental system, with the aim of identifying regulated genes in the course of thymus development. RNA fingerprinting at different intervals after the injection of anti-CD3ε mAb allowed us to isolate a new member of the immunoglobulin gene superfamily named Eva, whose expression is markedly downregulated at 48 h after the treatment, when thymocytes have completely downregulated the IL-2 receptor (CD25) and are in the CD4–8lo stage, immediately preceding the acquisition of the DP phenotype. EVA is expressed in the epithelial component of the organ, thus is apparently downregulated by a signal, or extinction of a signal, coming from maturing thymocytes. Considering cytokines as potential inducers of EVA expression in the thymus epithelium, it is interesting to note that acquisition of DP phenotype, which constitutes the bulk population in wild-type thymus, is accompanied by the loss of cytokines' production (Zlotnik and Moore, 1995). This phenomenon was also observed in RAG-2−/− mice for IFNγ and TNFα 48 h after anti-CD3 injection (our unpublished observations).
EVA bears a characteristic V-type domain and two potential N-glycosylation sites in the extracellular domain; a putative serine phosphorylation site for casein kinase 2 is also present in the cytoplasmic tail; those sites could account for posttranslational modification of the molecule. It shows a high degree of homology (45%) with the myelin Po protein, which is critically involved in compaction of peripheral nervous system myelin via interactions through both its extracellular and cytoplasmic domains (Lemke and Axel, 1985). It has been shown that the immunoglobulin-like domain of Po mediates homophilic interactions of the molecule (Filbin et al., 1990); moreover, it has been proposed that the association of the cytoplasmic tail of Po with the cytoskeleton strengthens the homophilic adhesive interaction by inducing conformational changes and clustering of the extracellular domain (Wong and Filbin, 1996). The reported homology between Po and EVA prompted us to investigate functional similarities between the two molecules. Analogous to that observed with Po, we could show that EVA is largely insoluble in thymus- derived epithelial cell lines and that, after transfection of CHO cells, is able to mediate homophilic cell–cell adhesion.
In the thymus, the importance of epithelial interactions for appropriate organ histogenesis has been recently underlined by a study describing the absence of thymus organogenesis in vitro, in a reaggregated organ culture system, by blocking a homophilic interaction of E-cadherin (Muller et al., 1997). Various other cell adhesion molecules have been hypothesized to play a role in thymus morphogenesis (Patel and Haynes, 1993); the structural and functional properties of EVA are particularly attractive in this respect, offering a likely new candidate for such a role. The strong downregulation of Eva expression induced by thymocyte maturation and expansion might suggest a role for EVA in compaction of the thymic epithelial framework during early thymus organogenesis, a situation that is aberrantly procrastinated in RAG-deficient mice. The EVA-dependent adhesiveness of epithelium would not be needed once the thymocyte compartment has sufficiently expanded. Suggestively, in the embryonic thymus, we could detect the highest level of Eva expression at 14-d p.c., which can be considered a developmental stage analogous to the one at which RAG-2−/− mice are arrested, immediately preceding the expression of a rearranged TCRβ chain.
At present, we cannot rule out the possibility that EVA binds through a lectin-like interaction, as hypothesized for Po (Filbin and Tennekoon, 1991) and/or with an heterophilic ligand expressed on thymocyte, as it has been shown for E-cadherin (Karecla et al., 1995). If this were the case, EVA downregulation by DP transition would reflect the need of thymocytes to move to a more appropriate stage-specific niche in the organ. Accordingly, it has been shown that the progress of thymocyte maturation renders the cells less adhesive to stroma (Nishimura et al., 1990).
Finally, Eva expression in several epithelia suggests other potential roles for EVA in addition to the putative ones envisaged during thymus organogenesis. The early expression of Eva during embryogenesis and its selective epithelial localizations are particularly significant in this respect.
Acknowledgments
We thank A. Kruisbeck (Netherlands Cancer Institute, Amsterdam, The Netherlands) and P. Castagnoli (University of Milan, Milan, Italy) for cell lines; E. Barbier (Pateur Institute, Paris, France) for skillful advice in biochemistry; C. Sala (San Raffaele Scientific Institute) for YAC clones; K. Servis (University of Lausanne, Lausanne, Switzerland), P. Cordioli (Istituto Zooprofilattico, Brescia, Italy), S. Fabbrini, S. Levi (both from San Raffaele Scientific Institute), P. Panina (Hoffmann-LaRoche, Milan, Italy), and A. Ceriotti (Consiglio Nazionale delle Ricerche, Milan) for reagents and experimental advice; and L. Adorini (Hoffman-LaRoche, Milan), F. Blasi (University of Milan), and R. Pardi (San Raffaele Scientific Institute) for critically reading the manuscript. We are especially grateful to A.G. Siccardi (University of Milan) for constant support and encouragement.
Abbreviations used in this paper
- aa
amino acid
- DN
double negative
- DP
double positive
- endo-H
endo-β-N-acetyl-glucosaminidase H
- EST
expressed sequence tag
- Eva
epithelial V-like antigen
- KRH
Krebs– Ringer–Hepes
- p.c.
post coitum
- Po
myelin protein zero
- RAG-2−/−
recombinase–activating-2 gene deficient
- RPA
RNase protection assay
- RT
reverse transcriptase
Footnotes
T. Teesalu's present address is Department of Virology, Haartman Institute, University of Helsinki, 00014 Helsinki, Finland.
References
- Albertsen HM, Abderrahim H, Cann HM, Dausset J, Le Paslier D, Cohen D. Construction and characterization of a yeast artificial chromosome library containing seven haploid human genome equivalents. Proc Natl Acad Sci USA. 1990;87:4256–4260. doi: 10.1073/pnas.87.11.4256. [DOI] [PMC free article] [PubMed] [Google Scholar]
- Altschul S, Gish W, Miller W, Myers E, Lipman D. Basic local alignment search tool. J Mol Biol. 1990;215:403–410. doi: 10.1016/S0022-2836(05)80360-2. [DOI] [PubMed] [Google Scholar]
- Auerbach R. Morphogenetic interactions in the development of the mouse thymus gland. Dev Biol. 1960;2:271–285. doi: 10.1016/0012-1606(60)90009-9. [DOI] [PubMed] [Google Scholar]
- Austyn JM, Gordon S. F4/80, a monoclonal antibody directed specifically against the mouse macrophage. Eur J Immunol. 1981;11:805–815. doi: 10.1002/eji.1830111013. [DOI] [PubMed] [Google Scholar]
- Ausubel, F.M., R. Brent, R.E. Kingstone, D.D. Moore, J.A. Smith, and K.R. Struhl. 1995. Current Protocols in Molecular Biology. John Wiley and Sons, New York.
- Boyd RL, Tucek CL, Godfrey DI, Izon DJ, Wilson TJ, Davidson NJ, Bean AG, Ladyman HM, Ritter MA, Hugo P. The thymic microenvironment. Immunol Today. 1993;14:445–459. doi: 10.1016/0167-5699(93)90248-J. [DOI] [PubMed] [Google Scholar]
- Carayannopoulos, L., and J.D. Capra. 1993. Immunoglobulins. Structure and function. In Fundamental Immunology. 3rd edition. W.E. Paul, editor. Raven Press, New York. 283–314.
- Ceriotti, A., E. Pedrazzini, M. De Silvestris, and A. Vitale. 1995. Import into the endoplasmic reticulum. Methods Cell Biol. 50:295–308. San Diego Academic Press. [DOI] [PubMed]
- Chang AC, Wadsworth S, Coligan JE. Expression of merosin in the thymus and its interaction with thymocytes. J Immunol. 1993;151:1789–1801. [PubMed] [Google Scholar]
- Chomczynski P, Sacchi N. Single-step method of RNA isolation by acid guanidinium thiocyanate-phenol-chloroform extraction. Anal Biochem. 1987;162:156–159. doi: 10.1006/abio.1987.9999. [DOI] [PubMed] [Google Scholar]
- Coligan, J.E., A.M. Kruisbeek, D.H. Margulies, E.M. Shevach, and W. Strober. 1994. Current Protocols in Immunology. E.R. Coico, editor. John Wiley and Sons, New York. 3.1.2–3.4.2
- Consalez GG, Corradi A, Ciarmatori S, Bossolasco M, Malgaretti N, Stayton CL. A new method to screen clones from differential display experiments prior to RNA studies. Trends Genet. 1996;12:455–456. doi: 10.1016/0168-9525(96)99993-x. [DOI] [PubMed] [Google Scholar]
- Corradi A, Croci L, Stayton CL, Gulisano M, Boncinelli E, Consalez GG. cDNA sequence, map, and expression of the murine homolog of GTBP, a DNA mismatch repair gene. Genomics. 1996;36:288–295. doi: 10.1006/geno.1996.0464. [DOI] [PubMed] [Google Scholar]
- Devereux J, Haeberli P, Smithies O. A comprehensive set of sequence analysis programs for the VAX. Nucleic Acids Res. 1984;12:387–395. doi: 10.1093/nar/12.1part1.387. [DOI] [PMC free article] [PubMed] [Google Scholar]
- Filbin M, Walsh FS, Trapp BD, Pizzey JA, Tennekoon GI. Role of myelin Po protein as a homophilic adhesion molecule. Nature. 1990;344:871–872. doi: 10.1038/344871a0. [DOI] [PubMed] [Google Scholar]
- Filbin MT, Tennekoon GI. The role of complex carbohydrates in adhesion of the myelin protein Po. Neuron. 1991;7:845–855. doi: 10.1016/0896-6273(91)90286-9. [DOI] [PubMed] [Google Scholar]
- Fine JS, Kruisbeek AM. The role of LFA-1/ICAM-1 interactions during murine T lymphocyte development. JImmunol. 1991;147:2852–2859. [PubMed] [Google Scholar]
- Frohman MA, Downs TR, Chomczynski P, Frohman LA. Cloning and characterization of mouse growth hormone-releasing hormone (GRH) complementary DNA: Increased GRH messenger RNA levels in the growth hormone-deficient lit/lit mouse. Mol Endocrinol. 1989;3:1529–1536. doi: 10.1210/mend-3-10-1529. [DOI] [PubMed] [Google Scholar]
- Girolomoni G, Lutz MB, Pastore S, Assmann CU, Cavani A, Ricciardi-Castagnoli P. Establishment of a cell line with features of early dendritic cell precursors from fetal mouse skin. Eur J Immunol. 1995;25:2163–2169. doi: 10.1002/eji.1830250807. [DOI] [PubMed] [Google Scholar]
- Glimcher LH, Kruisbeek AM, Paul WE, Green I. Functional activity of a transformed thymic epithelial cell line. J Immunol. 1983;17:1–11. doi: 10.1111/j.1365-3083.1983.tb00759.x. [DOI] [PubMed] [Google Scholar]
- Gluzman Y. SV40-transformed simian cells support the replication of early SV40 mutants. Cell. 1981;23:175–182. doi: 10.1016/0092-8674(81)90282-8. [DOI] [PubMed] [Google Scholar]
- Godfrey DI, Zlotnik A. Control points in early T-cell development. Immunol Today. 1993;14:547–553. doi: 10.1016/0167-5699(93)90186-O. [DOI] [PubMed] [Google Scholar]
- Guery JC, Ria F, Adorini L. Dendritic cells but not B cells present antigen complexes to class II-restricted T cells after administration of protein in adjuvant. J Exp Med. 1996;183:751–757. doi: 10.1084/jem.183.3.751. [DOI] [PMC free article] [PubMed] [Google Scholar]
- Hiai H, Nishi Y, Kaneshima H, Buma YO, Nishizuka Y. Thymic lymphoid-stromal cell complexes in mice: In vitro assay and mechanism of the complex formation. Exp Hematol. 1985;13:215–220. [PubMed] [Google Scholar]
- Holländer GA, Wang B, Nichogiannopoulou A, Platenburg PP, van Ewijk W, Burakoff SJ, Gutierrez-Ramos JC, Terhorst C. Developmental control point in induction of thymic cortex regulated by a subpopulation of prothymocytes. Nature. 1995;373:350–353. doi: 10.1038/373350a0. [DOI] [PubMed] [Google Scholar]
- Hueber AO, Pierres M, He HT. Sulfated glycans directly interact with mouse Thy-1 and negatively regulate Thy-1-mediated adhesion of thymocytes to thymic epithelial cells. J Immunol. 1992;148:3692–3699. [PubMed] [Google Scholar]
- Hyman R, Stallings V. Complementation patterns of Thy-1 variants and evidence that antigen loss variants “pre-exist” in the parental population. J Natl Cancer Inst. 1974;52:429–436. doi: 10.1093/jnci/52.2.429. [DOI] [PubMed] [Google Scholar]
- Itoh K, Tezuka H, Sakoda H, Konno M, Nagata K, Uchiyama T, Uchino H, Mori KJ. Reproducible establishment of hemopoietic supportive stromal cell lines from murine bone marrow. Exp Hematol. 1989;17:145–153. [PubMed] [Google Scholar]
- Izon DJ, Jones LA, Eynon EE, Kruisbeek AM. A molecule expressed on accessory cells, activated T cells, and thymic epithelium is a marker and promoter of T cell activation. J Immunol. 1994;153:2939–2950. [PubMed] [Google Scholar]
- Jacobs H, Vandeputte D, Tolkamp L, de Vries E, Borst J, Berns A. CD3 components at the surface of pro-T cells can mediate pre-T cell development in vivo. Eur J Immunol. 1994;24:934–939. doi: 10.1002/eji.1830240423. [DOI] [PubMed] [Google Scholar]
- Karecla PI, Bowden SJ, Green SJ, Kilshaw PJ. Recognition of E-cadherin on epithelial cells by the mucosal T cell integrin αM290β7 (αEβ7) Eur J Immunol. 1995;25:852–856. doi: 10.1002/eji.1830250333. [DOI] [PubMed] [Google Scholar]
- Lemke G, Axel R. Isolation and sequence of a cDNA encoding the major structural protein of peripheral myelin. Cell. 1985;40:501–508. doi: 10.1016/0092-8674(85)90198-9. [DOI] [PubMed] [Google Scholar]
- Leo O, Foo M, Sachs DH, Samelson LE, Bluestone JA. Identification of a monoclonal antibody specific for a murine T3 polypeptide. Proc Natl Acad Sci USA. 1987;84:1374–1378. doi: 10.1073/pnas.84.5.1374. [DOI] [PMC free article] [PubMed] [Google Scholar]
- Lepesant H, Reggio H, Pierres M, Naquet P. Mouse thymic epithelial cell lines interact with and select a CD31lowCD4+CD8+thymocyte subset through an LFA-1-dependent adhesion-de-adhesion mechanism. Int Immunol. 1990;2:1021–1032. doi: 10.1093/intimm/2.11.1021. [DOI] [PubMed] [Google Scholar]
- Litvinov SV, Velders MP, Bakker HAM, Fleuren GJ, Warnaar SO. Ep-CAM: A human epithelial antigen is a homophilic cell–cell adhesion molecule. J Cell Biol. 1994;125:437–446. doi: 10.1083/jcb.125.2.437. [DOI] [PMC free article] [PubMed] [Google Scholar]
- Lutz MB, Granucci F, Winzler C, Marconi G, Paglia P, Foti M, Assmann CU, Cairns L, Rescigno M, Ricciardi-Castagnoli P. Retroviral immortalization of phagocytic and dendritic cell clones as a tool to investigate functional heterogeneity. J Immunol Meth. 1994;174:269–279. doi: 10.1016/0022-1759(94)90031-0. [DOI] [PubMed] [Google Scholar]
- Malgaretti N, Pozzoli O, Bosetti A, Corradi A, Ciarmatori S, Panigada M, Bianchi ME, Martinez S, Consalez GG. Mmotl, a new helix-loop-helix transcription factor gene displaying a sharp expression boundary in the embryonic mouse brain. J Biol Chem. 1997;272:17632–17639. doi: 10.1074/jbc.272.28.17632. [DOI] [PubMed] [Google Scholar]
- Manly KF, Elliott RW. RI Manager, a microcomputer program for analysis of data from recombinant inbred strains. Mamm Genome. 1991;1:123–126. doi: 10.1007/BF02443789. [DOI] [PubMed] [Google Scholar]
- Muller KM, Luedecker CJ, Udey MC, Farr AG. Involvement of E-cadherin in thymus organogenesis and thymocyte maturation. Immunity. 1997;6:257–264. doi: 10.1016/s1074-7613(00)80328-3. [DOI] [PubMed] [Google Scholar]
- Negishi I, Motoyama N, Nakayama K, Senju S, Hatakeyama S, Zhang Q, Chan AC, Loh DY. Essential role for ZAP-70 in both positive and negative selection of thymocytes. Nature. 1995;376:435–438. doi: 10.1038/376435a0. [DOI] [PubMed] [Google Scholar]
- Nikolic-Zugic J. Phenotypic and functional stages in the intrathymic development of αβ T cells. Immunol Today. 1991;12:65–70. doi: 10.1016/0167-5699(91)90160-u. [DOI] [PubMed] [Google Scholar]
- Nishimura T, Takeuchi Y, Ichimura Y, Gao XH, Akatsuka A, Tamaoki N, Yagita H, Okumura K, Habu S. Thymic stromal cell clone with nursing activity supports the growth and differentiation of murine CD4+8+thymocytes in vitro. J Immunol. 1990;145:4012–4017. [PubMed] [Google Scholar]
- Patel DD, Haynes BF. Cell adhesion molecules involved in intrathymic T cell development. Sem Immunol. 1993;5:283–292. doi: 10.1006/smim.1993.1032. [DOI] [PubMed] [Google Scholar]
- Petrie T, Livak F, Schatz DG, Strasser A, Crispe IN, Shortman K. Multiple rearrangements in T cell receptor α chain genes maximize the production of useful thymocytes. J Exp Med. 1993;178:615–622. doi: 10.1084/jem.178.2.615. [DOI] [PMC free article] [PubMed] [Google Scholar]
- Pietrangeli CE, Hayashi S, Kincade PW. Stromal cell lines which support lymphocyte growth: Characterization, sensitivity to radiation and responsiveness to growth factors. Eur J Immunol. 1988;18:863–872. doi: 10.1002/eji.1830180606. [DOI] [PubMed] [Google Scholar]
- Primi D, Clynes B, Jouvin-Marche E, Marolleau JP, Barbier E, Cazenave PA, Marcu K B. Rearrangement and expression of T cell receptor and immunoglobulin loci in immortalized CD4−CD8−T cell lines. Eur J Immunol. 1988;18:1101–1109. doi: 10.1002/eji.1830180720. [DOI] [PubMed] [Google Scholar]
- Ritter M, Boyd RL. Development in the thymus: It takes two to tango. Immunol Today. 1993;14:462–469. doi: 10.1016/0167-5699(93)90250-O. [DOI] [PubMed] [Google Scholar]
- Rowe LB, Nadeau JH, Turner R, Frankel WN, Letts VA, Eppig JT, Ko MS, Thurston SJ, Birkenmeier EH. Maps from two interspecific backcross DNA panels available as a community genetic mapping resource. Mamm Genome. 1994;5:253–274. doi: 10.1007/BF00389540. [DOI] [PubMed] [Google Scholar]
- Sambrook, J., E.F. Fritsch, and T. Maniatis. 1989. Molecular Cloning: A Laboratory Manual. C. Nolan, editor. Cold Spring Harbor Laboratory Press, Cold Spring Harbor, NY. 545 pp.
- Sawada M, Nagamine J, Takeda K, Utsumi K, Kosugi A, Tatsumi Y, Hamaoka T, Miyake K, Nakajima K, Watanabe T, et al. Expression of VLA-4 on thymocytes. Maturation stage-associated transition and its correlation with their capacity to adhere to thymic stromal cells. J Immunol. 1992;149:3517–3524. [PubMed] [Google Scholar]
- Shinkai Y, Alt FW. CD3ε-mediated signals rescue the development of CD4+CD8+ thymocytes in RAG-2−/−mice in the absence of TCR β chain expression. Int Immunol. 1994;6:995–1001. doi: 10.1093/intimm/6.7.995. [DOI] [PubMed] [Google Scholar]
- Shinkai Y, Rathbun G, Lam KP, Oltz EM, Stewart V, Mendelshon M, Charron J, Datta M, Young F, Stall AM, Alt FW. RAG-2-deficient mice lack mature lymphocytes owing to inability to initiate V(D)J rearrangement. Cell. 1992;58:855–867. doi: 10.1016/0092-8674(92)90029-c. [DOI] [PubMed] [Google Scholar]
- Shimoyama Y, Nagafuchi A, Fujita S, Gotoh M, Takeichi M, Tsukita S, Hirohashi S. Cadherin disfunction in a human cancer cell line: possible involvement of loss of alpha-catenin expression in reduced cell-cell adhesiveness. Cancer Res. 1992;52:5770–5774. [PubMed] [Google Scholar]
- Spooncer E, Heyworth CM, Dunn A, Dexter TM. Self-renewal and differentiation of interleukin-3-dependent multipotent stem cells are modulated by stromal cells and serum factors. Differentiation. 1986;31:111–118. doi: 10.1111/j.1432-0436.1986.tb00391.x. [DOI] [PubMed] [Google Scholar]
- Teesalu T, Blasi F, Talarico D. Embryo implantation in mouse: Fetomaternal coordination in the pattern of expression of uPA, uPAE, PAI-1 and alpha 2MR/LRP genes. Mech Develop. 1996;56:103–116. doi: 10.1016/0925-4773(96)00515-1. [DOI] [PubMed] [Google Scholar]
- Utsumi K, Sawada M, Narumiya S, Nagamine J, Sakata T, Iwagami S, Kita Y, Teraoka H, Hirano H, Ogata M, et al. Adhesion of immature thymocytes to thymic stromal cells through fibronectin molecules and its significance for the induction of thymocyte differentiation. Proc Natl Acad Sci USA. 1991;88:5685–5689. doi: 10.1073/pnas.88.13.5685. [DOI] [PMC free article] [PubMed] [Google Scholar]
- van Ewijk W. T-cell differentiation is influenced by thymic microenvironments. Annu Rev Immunol. 1991;9:591–615. doi: 10.1146/annurev.iy.09.040191.003111. [DOI] [PubMed] [Google Scholar]
- von Boehmer H. Positive selection of lymphocytes. Cell. 1994;76:219–228. doi: 10.1016/0092-8674(94)90330-1. [DOI] [PubMed] [Google Scholar]
- von Boehmer H, Fehling HJ. Structure and function of the pre-T cell receptor. Annu Rev Immunol. 1997;15:433–452. doi: 10.1146/annurev.immunol.15.1.433. [DOI] [PubMed] [Google Scholar]
- Wadsworth S, Halvorson MJ, Coligan JE. Developmentally regulated expression of the β4 integrin on immature mouse thymocytes. J Immunol. 1992;149:421–428. [PubMed] [Google Scholar]
- Welsh J, Rampino N, McClelland M, Perucho M. Nucleic acid fingerprinting by PCR-based methods: applications to problems in aging and mutagenesis. Mutant Res. 1995;338:215–229. doi: 10.1016/0921-8734(95)00026-3. [DOI] [PubMed] [Google Scholar]
- Wolin SL, Walter P. Signal recognition particle mediates a transient elongation arrest of preprolactin in reticulocyte lysate. J Cell Biol. 1989;109:2617–2622. doi: 10.1083/jcb.109.6.2617. [DOI] [PMC free article] [PubMed] [Google Scholar]
- Wong MH, Filbin M. The cytoplasmic domain of the myelin Po protein influences the adhesive interactions of its extracellular domain. J Cell Biol. 1994;126:1089–1097. doi: 10.1083/jcb.126.4.1089. [DOI] [PMC free article] [PubMed] [Google Scholar]
- Wong MH, Filbin M. Dominant-negative effect on adhesion by myelin Po protein truncated in its cytoplasmic domain. J Cell Biol. 1996;134:1531–1541. doi: 10.1083/jcb.134.6.1531. [DOI] [PMC free article] [PubMed] [Google Scholar]
- Wong PC, Cleveland DW. Characterization of dominant and recessive assembly-defective mutations in mouse neurofilament NF-M. J Cell Biol. 1990;111:1987–2003. doi: 10.1083/jcb.111.5.1987. [DOI] [PMC free article] [PubMed] [Google Scholar]
- Yanagihara K, Kajitani T, Kamiya K, Yokoro K. In vitro studies on the mechanism of leukemogenesis. I. Establishment and characterization of cell lines derived from the thymic epithelial reticulum cell of the mouse. Leukemia Res. 1981;5:321–329. doi: 10.1016/0145-2126(81)90004-7. [DOI] [PubMed] [Google Scholar]
- Zlotnik A, Moore TA. Cytokine production and requirements during T-cell development. Curr Opin Immunol. 1995;7:206–213. doi: 10.1016/0952-7915(95)80005-0. [DOI] [PubMed] [Google Scholar]