Abstract
BRCA1-associated RING domain (BARD1) was identified as a protein interacting with the breast cancer gene product BRCA1. The identification of tumorigenic missense mutations within BRCA1 that impair the formation of BARD1–BRCA1 complexes, and of BARD1 mutations in breast carcinomas, sustain the view that BARD1 is involved in BRCA1-mediated tumor suppression. We have cloned the murine Bard1 gene and determined that its expression in different tissues correlates with the expression profile of Brca1. To investigate the function of Bard1, we have reduced Bard1 gene expression in TAC-2 cells, a murine mammary epithelial cell line that retains morphogenetic properties characteristic of normal breast epithelium. Partial repression of Bard1, achieved by the transfection of TAC-2 cells with plasmids constitutively expressing ribozymes or antisense RNAs, resulted in marked phenotypic changes, consisting of altered cell shape, increased cell size, high frequency of multinucleated cells, and aberrant cell cycle progression. Furthermore, Bard1-repressed cell clones overcame contact inhibition of cell proliferation when grown in monolayer cultures and lost the capacity to form luminal structures in three-dimensional collagen gels. These results demonstrate that Bard1 repression induces complex changes in mammary epithelial cell properties which are suggestive of a premalignant phenotype.
Keywords: Bard1, Brca1, breast cancer, cell cycle, morphogenesis
Despite increasing information on the breast and ovarian cancer susceptibility gene 1 (BRCA1),1 our understanding of its role in the initiation and progression of cancer remains limited. The predicted amino acid sequence of BRCA1 displays a RING finger domain in the amino-terminal and a presumed transcription activation domain in the carboxy-terminal region (Miki et al., 1994). Nuclear localization (Scully et al., 1997a ) and copurification with RNA polymerase II (Scully et al., 1997b ) suggest a role for BRCA1 in transcriptional regulation (Coene et al., 1997). The findings that the wild-type allele is frequently lost in tumors from individuals carrying BRCA1 mutations (Kelsell et al., 1993), that transfection of wild-type human BRCA1 into breast and ovarian cancer cells results in in vivo tumor suppression (Shao et al., 1996), and that inhibition of BRCA1 expression confers tumorigenic properties to NIH3T3 cells (Rao et al., 1996), support the notion that BRCA1 acts as a tumor suppressor gene.
Although most of the mutations in BRCA1, identified throughout the coding region, give rise to truncated proteins, missense mutations have been described in the structurally conserved cysteine residues within the RING finger of BRCA1, indicating the functional relevance of this domain (Castilla et al., 1994). The RING finger domain and its adjacent regions are essential for binding of BRCA1 to BARD1 (BRCA1-associated ring domain), which was discovered in a two-hybrid screen as a protein that specifically interacts with BRCA1 (Wu et al., 1996). BARD1, like BRCA1, encodes a RING finger protein homologous to BRCA1 within the amino-terminal RING and carboxy-terminal transcriptional transactivation domain. The carboxy-terminal domains of BRCA1 and BARD1 are homologous to a conserved domain present in proteins with cell cycle checkpoint functions and designated BRCT domain (Koonin et al., 1996; Bork et al., 1997). Overexpression of the complete BRCA1 gene or its BRCT domain in Saccharomyces cerevisiae inhibits growth (Humphrey et al., 1997), supporting the notion that the BRCT domain is involved in cell cycle control. In keeping with this finding, in response to DNA damage, BARD1 and BRCA1 colocalize with proliferating cell nuclear antigen (PCNA), a protein involved in DNA replication (Cox, 1997), and with Rad51 (Jin et al., 1997; Scully et al., 1997c ), a protein involved in eucaryotic double strand break repair (Shinohara et al., 1992). This dynamic localization is consistent with a role for BRCA1 and BARD1 complexes in DNA replication checkpoint response, as well as with recent reports indicating that BRCA1 is required for transcription-coupled repair of oxidative DNA damage (Gowen et al., 1998).
Adding to the proposed function of BRCA1, expression studies have shown that the murine Brca1 gene (Bennett et al., 1995) is expressed in diverse tissues, notably in those with a marked proliferative index including the breast tissue during development and pregnancy (Hakem et al., 1996; Rajan et al., 1997), a finding similar to that observed for the human BRCA1 gene (Lane et al., 1995).
Neither the function of BARD1 during development nor the mechanism and specific consequences of BARD1 interaction with the BRCA1 protein have been elucidated. Recently, BARD1 missense mutations, accompanied by loss of the wild-type allele, have been identified in human breast carcinoma (Thai et al., 1998), supporting the notion that BARD1 may participate in BRCA1 mediated tumor suppression.
The objective of this study was to characterize the murine Bard1 gene and to elucidate the functional properties of Bard1. In addition, by partially repressing Bard1 in the TAC-2 mammary gland epithelial cell line (Soriano et al., 1995), we found that Bard1 is required for S-phase progression, contact inhibition of growth, and formation of organized, lumen-containing structures. Altogether, these observations suggest a role of Bard1 as tumor suppressor along with Brca1.
Materials and Methods
Cloning of the Murine Bard1 Gene
Murine Bard1 sequences were amplified from total RNA extracted from normal murine breast tissue with primers directed against the RING finger region and the BRCT domain of the human BARD1 gene (corresponding to positions 268 and 1,914 of the human BARD1 cDNA). The 5′ end and 3′ end sequences of murine Bard1 were cloned with the 5′ race and the 3′ race method, respectively, using kits from Bio-Rad (Hercules, CA). The murine Bard1 cDNA was sequenced and is available under GenBank/EMBL/DDBJ accession number AFO57157.
RNase Protection Assays
RNase protection experiments were carried out with probes against the murine Bard1 cDNA sequence, comprising nucleotides (nt) 1,575–1,916 or 1,865–2,145, against Atm, comprising nt 8,494–8,668 of the murine Atm cDNA sequence, and against p21 corresponding to nt 381–722 of the murine p21 cDNA. The corresponding cDNA regions were amplified by reverse transcription (RT)-PCR from total RNA from normal murine breast tissue. Amplified fragments were cloned into pBSII-KS and antisense probes were transcribed with either T3 or T7 polymerase. Total RNA was extracted from different tissues or from different cell lines by Trizol (GIBCO, Grand Island, NY) extraction, and 10 μg of total RNA were incubated with antisense probes as described previously (Menoud et al., 1996).
Cell Culture
TAC-2 cells (Soriano et al., 1995), a clonally derived subpopulation of the NMuMG mammary gland epithelial cell line (CRL 1636; American Type Culture Collection, Rockville, MD) (Owens et al., 1974), were cultured in collagen-coated tissue culture flasks (Falcon, Becton Dickinson, San José, CA) in high glucose DME (GIBCO, Basel, Switzerland) supplemented with 10% fetal calf serum (FCS; GIBCO), penicillin (110 μg/ml) and streptomycin (110 μg/ml).
Generation of Antisense and Ribozyme Expression Clones
A Bard1 antisense expression clone was generated by cloning the DNA fragment comprising nt 789–1,773 of the murine Bard1 sequence and HindIII and NotI restriction sites (derived from pBS bluescript vector) into the HindIII and NotI sites of the PCDNA3 vector resulting in antisense orientation in respect to the cytomegalovirus (CMV) promoter. The corresponding sense construct was cloned into the EcoRI and XhoI sites. The inserted sense sequence (5′ AGTAACTGA TGTCATTGTTCCTGAT G AGGAAGCGCAGGAGTACTCTGA . . . 3′) contains an open reading frame (ORF) with translation initiation codons (boldface) followed by stop codons (underline).
Single strand ribozyme sequences and complementary DNA sequences were synthesized in vitro as oligomers containing two regions of 12 or 13 nucleotides complementary to the murine Bard1 coding sequence interrupted by the ribozyme loop. The two ribozyme target regions correspond to nt 1,864–1,890 and nt 1,963–1,988, respectively. Single strand ribozymes sequences were 5′-TCGAGCAGTAACTCATGTttcgtcctcacggactcatcag-ATTGTTCCTGATGGGTAC-3′ and 5′-TCGAGGTGAAAGCCTGT-ttcgtcctcacggactcatcagTGGACAGCAAAGGGTAC-3′ (uppercase, murine Bard1 sequences; lowercase, ribozyme loop), respectively. Ribozymes and their complementary DNA sequences were hybridized in vitro and were designed with overlapping ends creating sites suitable for oriented cloning into the KpnI and XhoI sites of the PCDNA3 vector.
Generation of Ribozyme and Antisense-expressing Cell Lines
TAC-2 cells were transfected with ribozyme or antisense constructs by the calcium phosphate transfection procedure and selected in neomycin (300 μg/ml). Stable clonal cell lines were generated by limiting dilution and subcultured in the presence of neomycin (300 μg/ml). 12 clonal cell lines were established, which we designated AB-A to AB-L. Two different ribozyme constructs were transfected and stable cell lines were generated and designated RB-18 and RB-21, respectively. As a control, TAC-2 cells were transfected with either PCDNA3 vector alone (PC3) or a Bard1 sense sequence (Bard1-sense) designed to abort protein translation after translation initiation codons. The AB-I clone was established by “droplet cloning,” a recently described limiting dilution procedure (Montesano et al., 1998), whereas the AB-K clone was obtained by manually removing a colony of defined morphology from a low cell density collagen gel culture, followed by its enzymatic dissociation into single cells, as previously described (Soriano et al., 1995; Montesano et al., 1998).
Western Blots
Synthetic peptides corresponding to amino acid residues 79–93, 101–114, and 141–155 of Bard1, were used to generate polyclonal antibodies designated PVC, WFS, and MIQ, respectively, in rabbits. Antibodies were affinity purified on peptide coupled Sepharose-CNBR (Pharmacia Biotech, Piscataway, NJ). Anti-p21 antibodies were murine polyclonal antibodies (Ab-9; NeoMarkers, Union City, CA) and were applied in a 1:50 dilution.
Protein extracts from TAC-2 cells expressing wild-type or repressed Bard1 protein levels were prepared by harvesting cells from subconfluent cultures. Cells were directly lysed in loading buffer and 100 μg of protein per lane were loaded on 7.5% SDS-PAGE and blotted onto nylon filters. Membranes were blocked with 10% milk powder in TBS. Antibody incubation with purified anti-Bard1 (WFS) or preimmune serum was in a 1:100 dilution. Secondary anti-rabbit peroxidase-coupled antibodies were applied in a 1:6,000 dilution. Signal detection was performed with the enhanced chemiluminescence kit (Amersham, Arlington Heights, IL).
FACS® Analyses
To study cell cycle in subconfluent monolayer cultures, cells were seeded at 4 × 10⁴ cells/ml in collagen-coated 35-mm Petri dishes and grown in complete medium (DME, 10% FCS) for 24–36 h. Cells were harvested with trypsin-EDTA, fixed with 70% ethanol, treated with RNase A (100 U/ml), and stained with propidium iodide (50 μg/μl). FACS® analyses were performed on a FACScan® flow cytometer (Becton Dickinson, Fullerton, CA).
To obtain synchronized cell cultures, cells were grown to form colonies from 20–200 cells. Cultures were then rinsed with PBS and incubated with serum-free medium for 36 h, at which time growth was reinduced by addition of complete medium. Cells were harvested at 4, 12, 18, 24, and 36 h after addition of complete medium, fixed in 70% ethanol, and then processed for FACS® analysis as described above.
To study cell cycle in postconfluent cultures, cells were seeded at saturating cell density (2 × 10⁵ cells/ml) in 16-mm wells and incubated at 37°C for 2 d, at which time medium was aspirated and replaced with fresh medium with or without the indicated treatment. Culture media and treatments were renewed every 2 d. After 5 d, cells were harvested with trypsin-EDTA, fixed in 70% ethanol, and processed for FACS® analysis, as described above. The mean percentage of cells in S-phase and G2/M phase for each experimental condition were compared with controls using Student's unpaired t test.
Collagen Gel Cultures and Quantification of Lumen Formation
Wild-type and transfected TAC-2 cell lines were harvested using trypsin-EDTA, centrifuged, and then embedded in three-dimensional collagen gels as described (Soriano et al., 1995). Media were changed every 2–3 d, and the cultures were incubated at 37°C for the times indicated.
To quantitatively assess lumen formation, TAC-2 cells were suspended at 104 cells/ml in collagen gels (1.5 ml) cast into 35-mm dishes and incubated with 1 μg/ml hydrocortisone and 10 μg/ml insulin. After 8 d, 150 randomly selected colonies per experimental condition were examined in each of at least three separate experiments, using the 10× objective of a Nikon Diaphot TMD inverted photomicroscope (Tokyo, Japan), and arbitrarily classified as cysts when containing a clearly discernible lumen. Values are expressed as mean percentage of cysts and compared with controls using the Student's unpaired t test.
Processing for Light and Electron Microscopy
Collagen gel cultures were fixed in situ overnight with 2.5% glutaraldehyde in 0.1 M sodium cacodylate buffer, pH 7.4. After extensive rinsing in the same buffer, the collagen gels were cut into 3 × 3-mm fragments. These were postfixed in 1% osmium tetroxide in veronal acetate buffer for 45 min and processed as described (Montesano et al., 1991). Semithin sections (1 μm) were cut with an LKB ultramicrotome, stained with 1% methylene blue, and then photographed under transmitted light using an Axiophot photomicroscope (Zeiss, Germany). Thin sections were stained with uranyl acetate and lead citrate, and examined with a Philips EM 300 electron microscope (Eindhoven, The Netherlands).
Immunofluorescence
Cells were seeded on collagen-coated coverslips at 5 × 10⁴ cells/ml and grown for 25 h, at which time they were fixed in methanol for 5 min, followed by acetone for 30 s. The coverslips were rinsed in PBS and stained for indirect immunofluorescence with either polyclonal anti-Bard1 antibodies (PVC, WFS, or MIQ) or polyclonal anti-p21 antibodies as described (Irminger-Finger et al., 1996). Anti-Bard1 antibodies were applied in a 1:100 dilution and anti-p21 antibodies in a 1:25 dilution. Rhodamine-conjugated secondary anti-rabbit IgGs (Oncogene Research, Cambridge, MA) were applied in a 1:200 dilution. Cells were incubated for DNA counterstaining in SYTOX Green Stain (Molecular Probes, Eugene, OR) for 15 min, mounted with PVA mounting medium (Sigma Chemical Co., St. Louis, MO), and then photographed with the 63× objective of a Zeiss Axiophot photomicroscope.
Results
Characterization of Murine Bard1
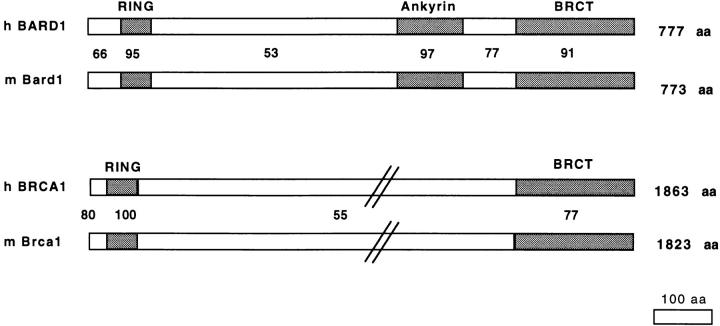
We have searched for and cloned the murine Bard1 gene by RT-PCR, with primers designed from the human BARD1 sequence, on total RNA extracted from normal adult murine breast tissue. Analysis of the murine Bard1 cDNA revealed an ORF coding for 774 amino acids, highly homologous to the human BARD1. Comparison of human and murine BARD1 protein sequences led to the identification of three regions of high homology comprising the amino-terminal RING finger (95% identity), the ankyrin repeats (97% identity), and the BRCT domain (91% identity). Interestingly, the ankyrin repeats represent an evolutionarily conserved region in addition to the RING finger and the BRCT domain (Fig. 1). The homology between the BARD1 sequences is strikingly higher than the homologies observed between the BRCA1 protein sequences from different species. Whereas the short RING finger regions (46 amino acids) of the different BRCA1 genes are 100% identical, their BRCT domains reveal 23% of nonconservative amino acid substitutions between the human and mouse sequences. Overall, the human and murine BARD1 sequences are more homologous than the human and murine BRCA1 sequences, which suggests that Bard1 might be evolutionarily more conserved that Brca1.
Figure 1.
Comparison of deduced amino acid sequences of BARD1 and BRCA1. Mouse and human BARD1 and BRCA1 sequences were aligned and percentages of homologies based on identical positions were calculated. The RING finger regions, the ankyrin repeats, and the BRCT domains, are indicated.
Expression Pattern of Bard1
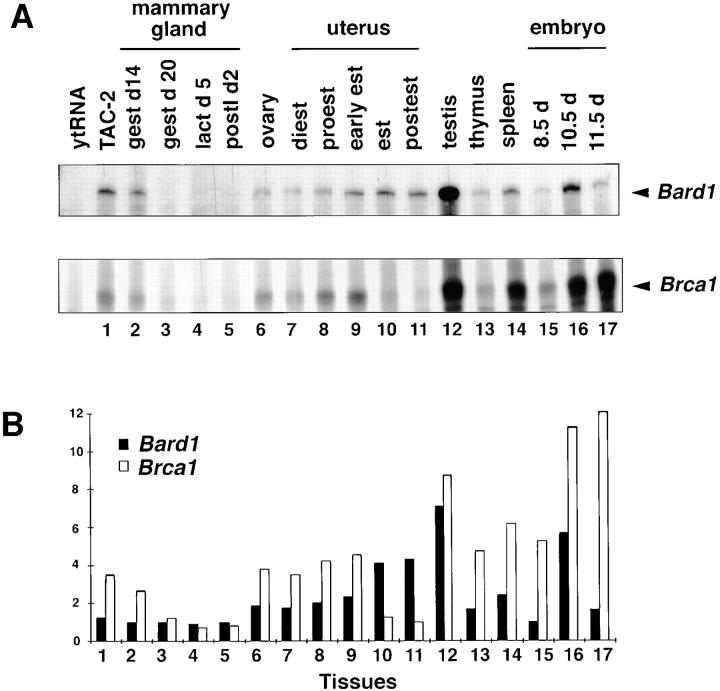
To determine the pattern of expression of Bard1 and its correlation with Brca1 expression, we performed RNase protection experiments. Bard1 expression was detected in a large variety of tissues examined (thymus, liver, spleen, lung, stomach, muscle, bone, and testis), a selection of which is presented in Fig. 2 A. High expression levels were found in testis and spleen. In most tissues Bard1 was found to correlate with the expression of the Brca1 gene. However, when transcript levels of both genes were measured, Brca1 levels exceeded Bard1 expression in most cases.
Figure 2.
Expression of Bard1 and Brca1 in different murine tissues. (A) Ribonuclease protection assay of Bard1 and Brca1 mRNA. RNase protection was performed using Bard1 and Brca1 probes in simultaneous hybridization with 10 μg of yeast tRNA, RNA from TAC-2 mammary epithelial cells, or with RNAs from different murine tissues. (B) Quantification of RNase protection assay. Bard1 and Brca1 signal intensities were measured and presented on a scale from 0 to 12 for each RNA. Numbers correspond to RNA samples in A. Black bars, Bard1 expression; white bars, Brca1 expression.
We next assessed the expression of Bard1 during development and in hormonally regulated organs, namely the mammary gland and the uterus. We found that during embryogenesis Bard1 is transiently expressed from day 8 to day 12, with a maximum expression at day 10 of embryogenesis, whereas the expression of Brca1 increases from embryonic day 8 through 12 (Fig. 2, A and B). In the ovary, as well as in the uterus and the mammary gland from virgin and pregnant mice, Bard1 is coexpressed with Brca1. However, Bard1 and Brca1 expression levels are modulated differently in hormonally controlled tissues during the ovulatory cycle. Specifically, in the uterus Bard1 expression is increasing from diestrus through postestrus, whereas Brca1 expression increases from diestrus to early estrus and decreases during estrus and postestrus (Fig. 2, A and B).
These results suggest that the expression levels of Bard1 could modulate the abundance of Bard1–Brca1 complexes during development and in hormonally regulated tissues.
Repression of Bard1 in Mammary Epithelial Cells
To obtain a functional in vitro model for the selective abrogation of Bard1 gene expression, we used TAC-2 cells (Soriano et al., 1995), a clonal population derived from the NMuMG normal murine mammary gland epithelial cell line (Owens et al., 1974). We initially determined that the BARD1 homologue Bard1 was expressed in TAC-2 cells by using RT-PCR on total RNA extracted from TAC-2 cells and by sequencing of the PCR products. We next cloned Bard1 antisense or ribozyme (Burke, 1996) sequences into the PCDNA3 expression vector under the transcriptional control of the CMV promoter, as described in Materials and Methods. Antisense or ribozyme encoding plasmids were stably transfected into TAC-2 cells.
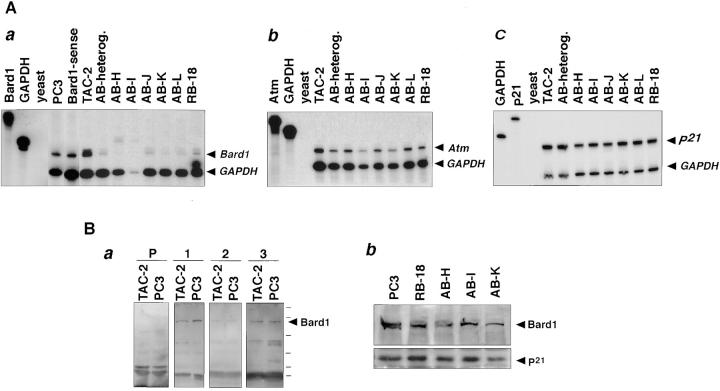
To determine the level of target gene repression, RNase protection experiments were performed on total RNA extracted from the different transfected clonal cell lines. Although nontransfected TAC-2 cells, mock-transfected PC3, and Bard1-sense cells showed similar levels of Bard1 mRNA expression, TAC-2 cells transfected with either Bard1-antisense or ribozyme constructs presented a significant repression of Bard1 mRNA levels (Fig. 3 A, panel a). To assess the specificity of Bard1 repression in TAC-2 cells, total RNA from nontransfected, antisense-expressing, and ribozyme expressing cells was analyzed by RNase protection using a cRNA for an unrelated gene, Atm. The levels of Atm transcripts were not significantly altered in any of the cell lines studied (Fig. 3 A, panel b). To determine whether Bard1 repression also affected the expression levels of genes involved in cell cycle regulation, we tested the expression level of p21 by RNase protection (Fig. 3 A, panel c). The concentration of p21 mRNA was the same in nontransfected TAC-2 cells and in Bard1-antisense expressing cells.
Figure 3.
Bard1 expression in different Bard1-antisense and ribozyme expressing cell lines. (A) 10 μg of total RNA extracted from TAC-2 cell lines were tested by RNase protection assays with probes against Bard1 and GAPDH (panel a) against Atm (panel b), and against p21 (panel c). TAC-2, nontransfected cells; PC3, mock-transfected PC3; Bard1-sense, control transfected Bard1-sense cells; AB-heterog, parental anti-Bard1 transfected cells; AB-H to AB-L, clonal cell lines derived from anti-Bard1; RB-18, ribozyme-transfected cells. Arrows, antisense protected band of correct size, additional slower migrating bands were seen in some samples after longer exposure. (B) Western blot analysis of protein levels in antisense and ribozyme expressing cells. Antibodies generated against the Bard1 peptides PVC, WFS, and MIQ were tested on Western blots of protein extracts from TAC-2 cells and mock-transfected PC3 cells (PC3) cells (panel a). Preimmune serum (P), corresponding to PVC antiserum, and purified PVC (1), WFS (2), and MIQ (3) antibodies were probed in a 1:100 dilution. Protein extracts from mock-transfected TAC-2 cells (PC3), ribozyme-expressing cells (RB-18), and antisense expressing cells (AB-H, AB-I, and AB-K) were blotted onto nitrocellulose filters and detected with PVC anti-Bard1 antibodies by chemiluminescence (panel b).
To evaluate the expression levels of the Bard1 protein in the cell lines generated, we raised three different antibodies (PVC, WFS, and MIQ) against peptides representing distinct regions within the amino-terminal domain of Bard1, as described in Materials and Methods. In cell extracts from TAC-2 cells and mock-transfected PC3 cells, a protein migrating with a molecular weight of ∼95 kD could be detected by Western blot analysis (Fig. 3 B, panel a), which is slightly slower than the predicted molecular weight of murine Bard1 (87 kD), but similar to the apparent molecular weight of human BARD1 (Wu et al., 1996). Bard1 protein levels were significantly reduced, albeit to a different extent, in all Bard1-antisense and ribozyme-expressing clones, when compared with mock-transfected PC3 cells (Fig. 3 B, panel b). When equal amounts of total protein extracts were analyzed, Bard1 protein expression appeared to be reduced by 20–50% in antisense and ribozyme-expressing cells.
To ascertain that Bard1 protein reduction was not due to a general reduction of protein expression, we tested the expression of p21. As described above, p21 RNA levels were not reduced in Bard1-antisense expressing cells. Unlike the Bard1 protein level, the p21 protein levels remained unaltered in the Bard1 repressed cell lines (Fig. 3 B, panel b), supporting the conclusion that Bard1 protein levels were specifically reduced.
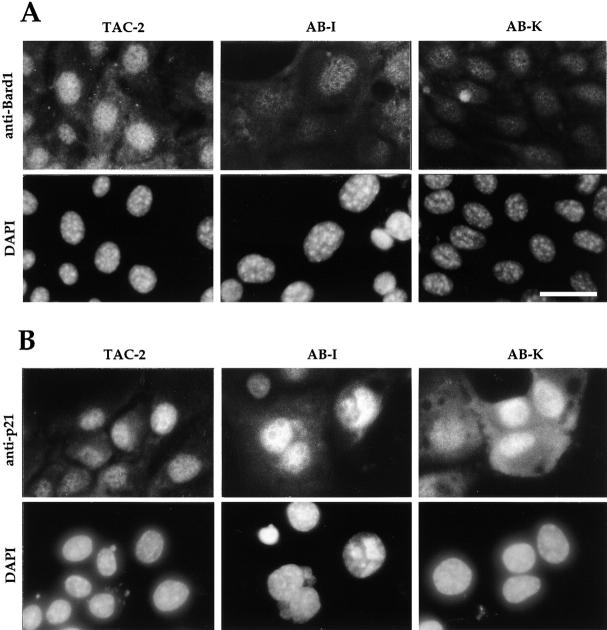
Anti-Bard1 antibodies were also used in immunolocalization studies on Bard1-antisense and ribozyme expressing cells. Although in TAC-2 cells or in mock-transfected PC3 cells the Bard1 protein could be localized to the nucleus, as reported for human BARD1 (Jin et al., 1997), the intensity of the nuclear staining was reduced in most of the antisense and ribozyme-expressing cell lines, as illustrated for two representative cell lines AB-I and AB-K (Fig. 4 A). Similar results were obtained with three different polyclonal anti-Bard1 antibodies. To test the specificity of Bard1 repression, we used anti-p21 antibodies and found that the p21 nuclear signal was not reduced in the Bard1 antisense expressing cell lines. The intensity of the nuclear p21 signal was similar in all stable cell lines (presented for TAC-2, AB-I and AB-K cells in Fig. 4 B). Taken together, these results demonstrate that ribozyme and antisense-mediated repression of Bard1 leads to a specific decrease of Bard1 mRNA levels and to a reduction of Bard1 protein levels.
Figure 4.
Immunolocalization of Bard1 and p21 in nontransfected and in Bard1-antisense expressing TAC-2 cells. (A) Anti-Bard1 staining and DAPI staining in mock-transfected PC3 cells and in clonal cell lines AB-I and AB-K is presented. Pictures were taken with identical exposure times for all cell lines, and demonstrate reduced Bard1 signal in AB-I and AB-K cells. Bar, 10 μm. (B) Anti-p21 staining and DAPI staining was performed as described for anti-Bard1. The p21 antibody was used in a 1:25 dilution.
Repression of Bard1 Induces Alterations of Cellular Morphology
Transfection of Bard1-antisense or ribozyme constructs led to characteristic phenotypic changes in stable transfectants which were reproduced to varying degrees in 10 out of 14 clonal cell lines. When compared with TAC-2 cells, PC3 cells, or Bard1-sense cells, Bard1-repressed cells displayed a flat appearance and an increased cell size. The nuclei of most cells were enlarged and up to 30% of the cells contained multilobed or multiple nuclei, as confirmed by 4′6-diamidino-2-phenylindole (DAPI) staining of nuclear DNA. A similar phenotype was observed for the ribozyme-expressing cells and the clonal cell lines generated from the antisense expressing cells. Among the transfectants studied, the phenotypic changes were most pronounced in AB-I and AB-K cells as illustrated in Fig. 5.
Figure 5.
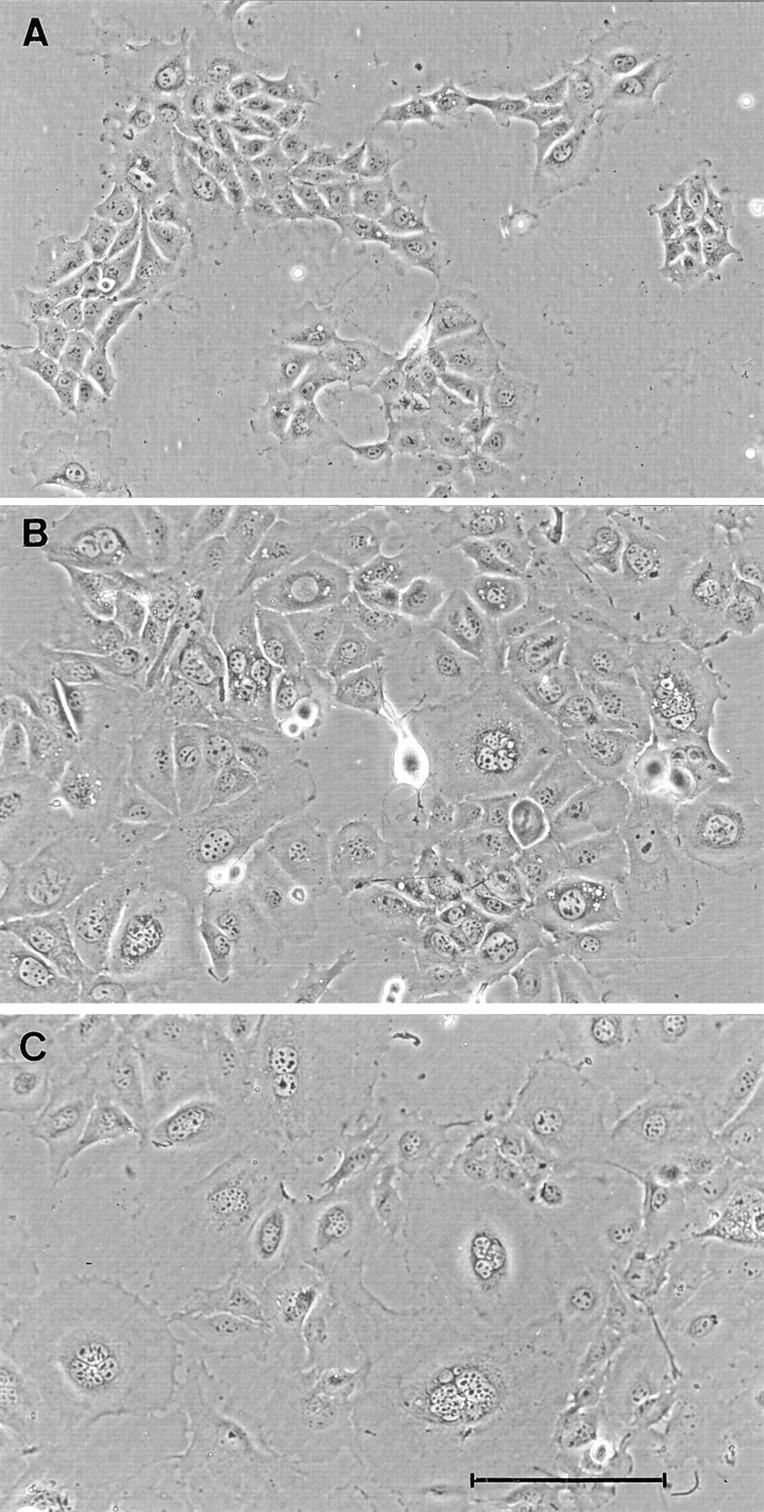
Morphological phenotype of Bard1-antisense and ribozyme expressing cells. Representative fields of untransfected TAC-2 cells (A) and clonal antisense expressing AB-I (B) and AB-K (C) cells. Whereas nontransfected TAC-2 cells have an homogeneous polygonal shape, AB-I and AB-K cells show increased cytoplasmic and nuclear size and multinucleation. Bar, 100 μm.
Repression of Bard1 Induces Retardation of S-phase
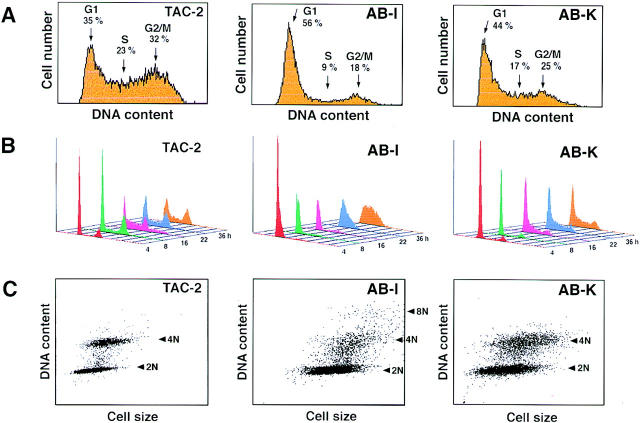
The finding that Bard1 repression in TAC-2 cells results in multinucleation raised the question as to whether this gene may be important for cell cycle functions. To test this hypothesis, we assessed the effect of Bard1 repression on cell cycle progression by FACS® analysis. Asynchronous cultures of nontransfected TAC-2 cells showed a typical distribution of cell cycle phases, with roughly similar cell events counted in G1 and G2/M, and less in S-phase (see Fig. 6 A, left panel). In contrast, asynchronous cultures of Bard1 antisense expressing cells exhibited an abnormal cell cycle distribution, consisting of a significant increase of G1 and a marked reduction of both S- and G2/M phases (presented for AB-I and AB-K cells in Fig. 6 A, middle and right panels). A similar distribution was observed in the heterogeneously transfected cell population and in eight different Bard1 repressed clonal cell lines (Table I). These data suggest that repression of Bard1 in TAC-2 cells induced a retardation of the cell cycle with a resulting accumulation of cells in G1 phase. To determine at which cell cycle stage the delay occurred in Bard1 repressed cells, we synchronized cultures of TAC-2 cells in G1 phase by serum starvation, and performed FACS® analysis at different time points after reinduction of growth, as described in Materials and Methods. Readdition of serum to nontransfected TAC-2 cells resulted in the rapid onset of cell cycle, the normal pattern of cell cycle distribution being reached 8–16 h after induction of growth (Fig. 6, A and B, compare left panels). Strikingly, however, the onset of the cell cycle in Bard1 repressed AB-I cells was dramatically delayed. Cells remained in G1-phase for the first 16 h after serum readdition and slowly entered and progressed through S-phase only after 22 h, resulting in the absence of G2/M phase cells 36 h later (Fig. 6 B, middle panel). A similar, albeit less pronounced, delay was observed in AB-K cells, which remained in G1-phase for 16 h, slowly progressed through S-phase, and finally reached G2/M phase after 22 h (Fig. 6 B, right panel). These results suggest that Bard1 is required for S-phase progression.
Figure 6.
FACS® analysis of Bard1-repressed cells. (A) Cell cycle distribution of asynchronously growing TAC-2 cells and Bard1- repressed AB-I and AB-K cells. Percentages indicate the mean values of four independent experiments. (B) Cell cycle progression of nontransfected and Bard1-repressed TAC-2 cells after G1 arrest. Cell cycle distributions of synchronized cells are shown for each cell line 4, 8, 16, 22, and 36 h after readdition of serum. (C) Presentation of DNA content versus cell size in G1-arrested cells grown for 16 h after readdition of serum. In nontransfected cells, two different populations with a distinct DNA content (2N and 4N) can be observed. In AB-K cells, only the G1 cells form a distinct (2N) population, whereas cells presumed to be in G2/M exhibit a heterogeneous DNA content. In AB-I cells, a cell population with a DNA content of ∼8N is observed.
Table I.
Cell Cycle Distribution of Nonsynchronized Cell Cultures
| Cell line | Percent of cells in cell cycle phase | |||||
|---|---|---|---|---|---|---|
| G1 | S | G2/M | ||||
| TAC-2 (6*) | 33 | 39 | 28 | |||
| PC3 (6) | 34 | 38 | 28 | |||
| AB-H (6) | 40 | 35 | 25 | |||
| AB-I (6) | 56 | 19 | 25 | |||
| AB-J (3) | 42 | 32 | 26 | |||
| AB-K (7) | 56 | 21 | 23 | |||
| AB-L (2) | 44 | 32 | 24 | |||
| RB18 (5) | 50 | 19 | 31 | |||
| RB24 (4) | 60 | 18 | 22 | |||
Number of experiments performed with individual cell lines to determine mean percentage. SEM were between ±2 and ±6.
An additional interesting feature of Bard1 repressed cells was observed when the synchronized cell population of individual cell lines was presented as DNA content against cell size (Fig. 6 C). In nontransfected lines, the majority of cells are found in either G1 or G2/M. Most strikingly, AB-K and AB-I cells did not form two distinct populations corresponding to G1 and G2/M phase cells with a distinct DNA content of 2N and 4N, respectively, as observed with TAC-2 cells, but formed a diffuse population of ∼4N. AB-I cells, in addition, contained another population of cells with a DNA content of ∼8N. These results correlate well with the morphological phenotype of AB-I and AB-K cells, consisting of a large proportion of enlarged and/or multilobed nuclei as illustrated in Fig. 5. Taken together, these observations suggest that Bard1 repression could lead to aneuplody and polyploidy.
Loss of Contact Inhibition in Bard1-repressed Cells
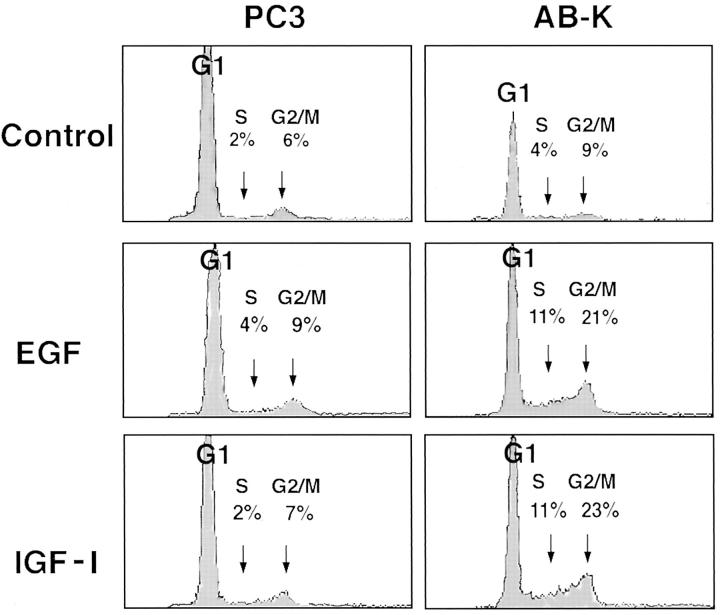
AB-K, and to a lesser extent AB-I cells, appeared to have lost control of contact-induced growth inhibition when reaching confluence. Although wild-type cells and mock-transfected TAC-2 cells formed regular monolayers in postconfluent cultures, AB-K cells manifested a tendency to overlap each other and to grow in a disorganized crisscross pattern (data not shown). The differential behavior of control and AB-K cells was particularly pronounced when the cells were grown in the presence of exogenous growth factors. Thus, the addition of either epidermal growth factor (EGF) or insulin-like growth factor I (IGF-I) did not induce multilayering in TAC-2 or PC3 cells, but resulted in a marked degree of cell stratification in AB-K cells (Fig. 7). To quantitatively characterize this observations, AB-K and mock-transfected PC3 cells were grown to confluence and their proliferation rate was subsequently monitored by FACS® analysis with and without the addition of either EGF or IGF-I. Whereas PC3 cells had the same distribution of G1, S, and G2/M phase cells in the presence or absence of exogenous growth factors, AB-K cells progressed efficiently into S and G2/M phase in the presence of either EGF or IGF-I (Fig. 8). This indicates that AB-K cells have lost sensitivity to contact inhibition of growth.
Figure 7.
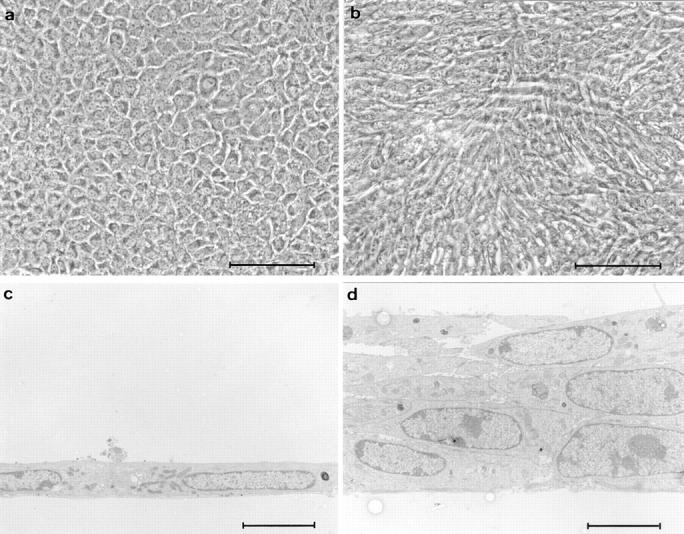
Loss of contact inhibition in Bard1-repressed cells. Cells were seeded in collagen-coated 16-mm wells at saturating cell density (2 × 10⁵ cells/ml) and grown for 2 d, at which time the cultures were incubated in the absence or the presence of 20 ng/ml EGF for a further 5 d. In EGF-supplemented cultures, mock-transfected PC3 cells form a contact-inhibited cobblestone-like monolayer (a), whereas antisense expressing AB-K cells (b) grow in a disordered crisscross pattern. (c and d) Thin sections perpendicular to the plane of cultures shown in a and b demonstrate the lack of stratification in PC3 cells and the obvious multilayering in AB-K cells. Bars: (a and b) 100 μm; (c and d) 5 μm.
Figure 8.
FACS® analysis of mock-transfected and Bard1-antisense expressing cells grown to confluence. Mock-transfected PC3 cells and Bard1-antisense expressing AB-K cells were grown to confluence, incubated with or without addition of either EGF (20 ng/ml) or IGF-I (50 ng/ml) for a further 5 d, and then subsequently analyzed by FACS® as described in Materials and Methods.
To determine whether AB-I or AB-K cells had become tumorigenic, nude mice were injected with nontransfected TAC-2 cells, AB-I, or AB-K cells (106 cells per mouse, six mice for each cell line), and observed for 10 wk. Neither TAC-2 cells nor AB-I or AB-K cells induced tumor formation in the 18 mice injected. Experiments were repeated with another group of 18 mice and observed for 10 wk without detecting the appearance of tumors. These results are consistent with the dependence of AB-K cells on the addition of growth factors for uncontrolled growth.
Repression of Bard1 Inhibits Lumen Formation by TAC-2 Cells
TAC-2 cells have the remarkable ability to mimic several essential components of ductal or alveolar morphogenesis when grown in collagen gels in the presence of either hepatocyte growth factor (HGF) or hydrocortisone (Soriano et al., 1995 ). We therefore assessed whether Bard1 could influence the morphogenetic properties of these cells. When grown in collagen gels under control conditions for 5–8 d, mock-transfected PC3 cells gave rise to small colonies with a morphology ranging from irregular cell aggregates to poorly branched structures. Addition of HGF to the cultures induced the formation of highly arborized branching cords, as previously observed with nontransfected TAC-2 cells. Addition of HGF to collagen gel cultures of Bard1 repressed AB-I or AB-K cells induced branching tubulogenesis to a similar extent as in mock-transfected cells (data not shown). These findings suggest that Bard1 does not play a major role in the elongation and branching of duct-like structures by TAC-2 cells.
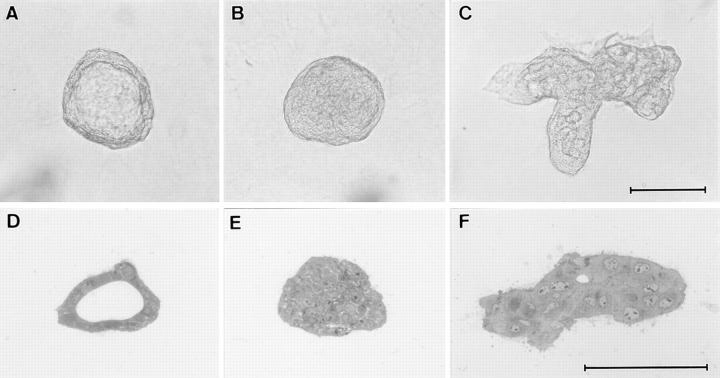
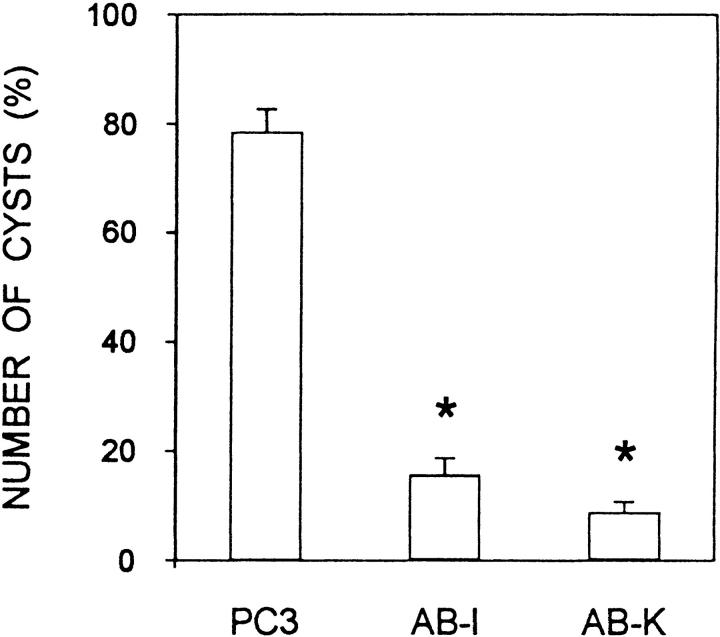
We next analyzed whether Bard1 repression could influence lumen formation by TAC-2 cells. When grown in collagen gels in the presence of hydrocortisone, mock-transfected PC3 cells formed spheroidal cysts enclosing a widely patent lumen (Fig. 9 A) delimited by a palisade of cubic epithelial cells (Fig. 9 D), as previously observed with nontransfected TAC-2 cells (Soriano et al., 1995). In contrast, under the same experimental conditions, AB-I cells formed solid aggregates devoid of lumen (Fig. 9, B and E) and AB-K cells formed irregularly shaped cell aggregates occasionally containing small focal lumina (Fig. 9, C and F). A quantitative analysis demonstrated a marked inhibition of lumen formation in Bard1 repressed cells, as evidenced by a significant six- and eightfold (P = 0.001) decrease in the mean percentage of cysts formed by AB-I and AB-K cells, respectively, when compared with PC3 cells (Fig. 10). Taken together, these results demonstrate that the repression of Bard1 expression inhibits the formation of alveolar-like cystic structures by TAC-2 cells.
Figure 9.
Repression of Bard1 abrogates hydrocortisone-induced lumen formation by TAC-2 cells. Cells were suspended in collagen gels at 104 cells/ml and incubated with 1 μg/ml hydrocortisone and 10 μg/ml insulin for 8 d. Under these conditions, PC3 cells form alveolar-like cystic structures containing widely patent lumina (A) delimited by a palisade of cubic epithelial cells (D). In marked contrast, AB-I cells form solid ball-like structures (B) devoid of lumen (E), and AB-K cells form irregular aggregates (C) containing small focal lumina (F). The three-dimensional structures illustrated in A, B, and C are representative of the vast majority of colonies formed by PC3, Ab-I, and AB-K cells, respectively. A–C, Bright-field microscopy; D–F, semithin sections. Bars, 100 μm.
Figure 10.
Quantitative analysis of lumen formation. Cells were suspended in collagen gels at 104 cells/ml and incubated with 1 μg/ml hydrocortisone and 10 μg/ml insulin. After 8 d of culture, cyst formation was quantitated as described in Materials and Methods. Data from mock-transfected PC3 cells and Bard1-repressed AB-I and AB-K cells are expressed as mean percentage ± SEM and are compared using the Student's unpaired t test (* = P < 0.001; n = 3 experiments).
Discussion
The finding of constitutive BARD1 missense mutations in breast cancer patients (Thai et al., 1998) and missense mutations within the RING domain of BRCA1 that mediates BARD1 binding activity, has led to the proposal that BARD1 plays a role in tumor suppression in conjunction with BRCA1.
The simultaneous analysis of the expression levels of Brca1 and Bard1 in a variety of tissues demonstrates a similar expression profile in most tissues, consistent with the hypothesis of their functional interaction. However, an inversion of the stoichiometry of Brca1 and Bard1 RNA is observed during the ovulatory cycle in the uterus and to a lesser extent in the mammary gland. This finding suggests a role for Bard1 as modulator of Brca1 functions in these tissues.
It was therefore of interest to characterize the phenotype resulting from altered levels of Bard1 expression in mammary gland epithelial cells. Our results provide cumulative evidence that partial but specific repression of the Bard1 gene can be achieved by antisense or ribozyme expression: firstly, the expression of antisense and ribozyme constructs aimed at different regions of the Bard1 sequence results in the same phenotype in transiently transfected cells and in several clonal cell lines; secondly, expression of sense constructs, or antisense sequences aimed at an unrelated gene, Atm, did not result in the repression of Bard1 RNA or protein, or in an altered morphological phenotype (our unpublished observations). Interestingly, the repression of Bard1 resulted in only limited repression of Bard1 protein levels (20–50%). It is possible that complete repression of Bard1 would be lethal to the cells, and that selection pressure led to the establishment of Bard1 repressed cell lines with relatively mild reduction of Bard1 protein levels.
Bard1-repressed cells display a distinct phenotype consisting of altered morphology and S-phase retardation. During S-phase, BARD1 has been shown to colocalize with BRCA1 and PCNA (Jin et al., 1997; Scully et al., 1997a ,c). The steady-state levels of BARD1 remain constant during cell cycle progression, in contrast to BRCA1 levels that reach a maximum during S-phase. Aggregation of BARD1 molecules into BRCA1 nuclear dots occurs during S-phase, suggesting that the recruitment of BARD1 depends on BRCA1 (Jin et al., 1997). Our results indicate that Bard1 by itself is required for specific functions during S-phase and that its repression leads to S-phase retardation. Interestingly, morphological features of the Bard1 repressed cells, such as multinucleation and nuclear lobulation, have also been observed as a consequence of alterations in genes involved in cell cycle regulation, such as G1 cyclins or p21 (for review see Murray, 1994; Zavitk and Zipursky, 1997), which suggests that the phenotype of Bard1 repressed cells could be a consequence of aberrant cell cycle progression.
The alterations in cell cycle progression of Bard1-repressed cells could be indicative of an upregulation of cell cycle inhibitors, such as p21. The upregulation of p21 was observed in tissues of Brca1-knockout mice (Hakem et al., 1996). Further, BRCA1 itself has been demonstrated as an activator of p21 transcription (Ouchi et al., 1998; Zhang et al., 1998) either as coactivator of p53 or in the absence of p53 (Somasundaram et al., 1997). As shown in this paper, the expression of p21 was not upregulated in Bard1 repressed cells, since mRNA and protein levels remained unaltered in Bard1 antisense-expressing cells. Therefore, the observed S-phase retardation in Bard1 repressed cells must involve other pathways than p53-p21.
Since loss of normal tissue organization is one of the first changes seen in the development of breast cancer, it was relevant to assess whether Bard1 repression would affect the morphogenetic properties of TAC-2 cells. When grown in collagen gels in the presence of hydrocortisone, TAC-2 cells transfected with vector sequences only (PC3) formed highly organized cystic structures, as previously described for nontransfected TAC-2 cells (Soriano et al., 1995). In contrast, two different clones of Bard1 antisense-transfected cells (AB-I and AB-K) formed disorganized solid aggregates devoid of a central lumen. Our findings therefore suggest that Bard1 regulates cellular activities involved in the control of epithelial morphogenesis, and that loss of this function leads to disruption of normal tissue architecture. In this context, it is interesting that nontumorigenic mammary epithelial cells grown in three-dimensional matrices form acinar-like spherical structures with a central lumen, whereas breast cancer cells lack this property and form disorganized colonies (Petersen et al., 1992).
The failure of normal morphogenesis and altered response to hydrocortisone in Bard1 repressed AB-I and AB-K cells may conceivably result from changes in levels or functions of molecules involved in cell–cell adhesion or the establishment and maintenance of cell polarity and cell–cell adhesion functions. Similar defects have been described in a human mammary epithelial cell model and shown to be functionally related to integrin expression levels (Weaver et al., 1996, 1997).
Since it was proposed that BARD1 acts as a tumor suppressor along with BRCA1 (Thai et al., 1998), it could be expected that repression of Bard1 would induce a similar phenotype as BRCA1 repression. BRCA1 antisense- expressing fibroblasts were reported to acquire a tumorigenic potential (Rao et al., 1996). Bard1-repressed cells, AB-I or AB-K, although insensitive to contact inhibition of growth, when injected into nude mice were not tumorigenic, indicating that Bard1 antisense expression gives rise to a premalignant phenotype. It remains to established whether the complete inhibition of Bard1 expression could induce a different phenotype.
Acknowledgments
We are grateful to J.-C. Irminger and D. Belin for interesting comments and helpful suggestions during the progress of this work. We are indebted to B. Imhof for a generous supply of nude mice and help with injections. We also thank D. Wohlwend for assistance with FACS® analyses, M. Eissler, F. Leuba, J. Rial-Robert, N. Sappino, and M. Vallotton for excellent technical support, P. Maillet for critical reading of the manuscript, and J.P. Gerber for photographic work (all from University of Geneva, Geneva, Switzerland).
This work was supported by grant from the Geneva Ligue against Cancer to A.-P. Sappino and a grant from the Swiss National Science Foundation to R. Montesano (31-43364.95).
Abbreviations used in this paper: BARD1
BRCA1-associated Ring domain gene 1
- BARD1
BARD1 gene product
- BRCA1
breast cancer gene 1
- BRCA1
BRCA1 gene product
- DAPI
4′6-diamidino-2-phenylindole
- HGF
hepatocyte growth factor
- IGF-I
insulin-like growth factor I
- nt
nucleotide
- RING
ring finger motif
- RT
reverse transcription
References
- Bennett LM, Haugen-Strano A, Cochran C, Brownlee HA, Fiedorek FT, Jr, Wiseman RW. Isolation of the mouse homologue of BRCA1 and genetic mapping to mouse chromosome 11. Genomics. 1995;29:576–581. doi: 10.1006/geno.1995.9963. [DOI] [PubMed] [Google Scholar]
- Bork P, Hofmann K, Bucher P, Neuwald AF, Altschul SF, Koonin EV. A superfamily of conserved domains in DNA damage-responsive cell cycle checkpoint proteins. FASEB (Fed Am Soc Exp Biol) J. 1997;11:68–76. [PubMed] [Google Scholar]
- Burke JM. Hairpin ribozyme: current status and future prospects. Biochem Soc Trans. 1996;24:608–615. doi: 10.1042/bst0240608. [DOI] [PubMed] [Google Scholar]
- Castilla LH, Couch FJ, Erdos MR, Hoskins KF, Calzone K, Garber JE, Boyd J, Lubin MB, Deshano ML, Brody LC, et al. Mutations in the BRCA1 gene in families with early-onset breast and ovarian cancer. Nat Genet. 1994;8:387–391. doi: 10.1038/ng1294-387. [DOI] [PubMed] [Google Scholar]
- Coene E, Van Oostveldt P, Willems K, van Emmelo J, De Potter CR. BRCA1 is localized in cytoplasmic tube-like invaginations in the nucleus. Nat Genet. 1997;16:122–124. doi: 10.1038/ng0697-122. [DOI] [PubMed] [Google Scholar]
- Cox LS. Who binds wins: competition for PCNA rings out cell cycle changes. Trends Cell Biol. 1997;7:493–498. doi: 10.1016/S0962-8924(97)01170-7. [DOI] [PubMed] [Google Scholar]
- Gowen LC, Avrutskaya AV, Latour AM, Koller BV, Leaden SA. BRCA1 required for transcription-coupled repair of oxidative DNA damage. Science. 1998;281:1009–1012. doi: 10.1126/science.281.5379.1009. [DOI] [PubMed] [Google Scholar]
- Hakem R, de la Pompa JL, Sirard C, Mo R, Woo M, Hakem A, Wakeham A, Potter J, Reitmair A, Billia F, et al. The tumor suppressor gene Brca1 is required for embryonic cellular proliferation in the mouse. Cell. 1996;85:1009–1023. doi: 10.1016/s0092-8674(00)81302-1. [DOI] [PubMed] [Google Scholar]
- Humphrey JS, Salim A, Erdos MR, Collins FS, Brody LC, Klausner RD. Human BRCA1 inhibits growth in yeast: potential use in diagnostic testing. Proc Natl Acad Sci USA. 1997;94:5820–5825. doi: 10.1073/pnas.94.11.5820. [DOI] [PMC free article] [PubMed] [Google Scholar]
- Irminger-Finger I, Hurt E, Roebuck A, Collart MA, Edelstein SJ. MHP1, an essential gene in Saccharomyces cerevisiaerequired for microtubule function. J Cell Biol. 1996;135:1323–1340. doi: 10.1083/jcb.135.5.1323. [DOI] [PMC free article] [PubMed] [Google Scholar]
- Jin Y, Xu XL, Yang M-CW, Wei F, Ayi T-C, Bowcock AM, Baer R. Cell cycle-dependent colocalization of BARD1 and BRCA1 proteins in discrete nuclear domains. Proc Natl Acad Sci USA. 1997;94:12075–12080. doi: 10.1073/pnas.94.22.12075. [DOI] [PMC free article] [PubMed] [Google Scholar]
- Kelsell DP, Black DM, Bishop DT, Spurr NK. Genetic analysis of the BRCA1 region in a large breast/ovarian family: refinement of the minimal region containing BRCA1. Hum Mol Genet. 1993;2:1823–1828. doi: 10.1093/hmg/2.11.1823. [DOI] [PubMed] [Google Scholar]
- Koonin EV, Altschul SF, Bork P. BRCA1 protein products. Functional motifs. Nat Genet. 1996;13:266–268. doi: 10.1038/ng0796-266. [DOI] [PubMed] [Google Scholar]
- Lane TF, Deng C, Elson A, Lyu MS, Kozak CA, Leder P. Expression of Brca1 is associated with terminal differentiation of ectodermally and mesodermally derived tissues in mice. Genes Dev. 1995;9:2712–2722. doi: 10.1101/gad.9.21.2712. [DOI] [PubMed] [Google Scholar]
- Menoud PA, Sappino N, Boudal-Khoshbeen M, Vassalli JD, Sappino AP. The kidney is a major site of alpha(2)-antiplasmin production. J Clin Invest. 1996;97:2478–2484. doi: 10.1172/JCI118694. [DOI] [PMC free article] [PubMed] [Google Scholar]
- Miki Y, Swensen J, Shattuck-Eidens D, Futreal PA, Harshman K, Tavtigian S, Liu Q, Cochran C, Bennett LM, Ding W, et al. A strong candidate for the breast and ovarian cancer susceptibility gene BRCA1. Science. 1994;266:66–71. doi: 10.1126/science.7545954. [DOI] [PubMed] [Google Scholar]
- Montesano R, Schaller G, Orci L. Induction of epithelial tubular morphogenesis in vitro by fibroblast-derived soluble factors. Cell. 1991;66:697–711. doi: 10.1016/0092-8674(91)90115-f. [DOI] [PubMed] [Google Scholar]
- Montesano R, Soriano JV, Fialka I, Orci L. Isolation of EpH4 mammary epithelial cell subpopulations which differ in their morphogenetic properties. In Vitro Cell Dev Biol Anima. 1998;34:468–477. doi: 10.1007/s11626-998-0080-3. [DOI] [PubMed] [Google Scholar]
- Murray AW. Cyclin-dependent kinases: regulators of the cell cycle and more. Chem Biol. 1994;1:191–195. doi: 10.1016/1074-5521(94)90009-4. [DOI] [PubMed] [Google Scholar]
- Ouchi T, Monteiro ANA, August A, Aaronson SA, Hanafusa H. BRCA1 regulates p53-dependent gene expression. Proc Natl Acad Sci USA. 1998;95:2302–2306. doi: 10.1073/pnas.95.5.2302. [DOI] [PMC free article] [PubMed] [Google Scholar]
- Owens RB, Smith HS, Hackett AJ. Epithelial cell cultures from normal glandular tissue of mice. J Natl Cancer Inst. 1974;53:261–269. doi: 10.1093/jnci/53.1.261. [DOI] [PubMed] [Google Scholar]
- Petersen OW, Rønnov-Jenssen L, Howlett AR, Bissell MJ. Interaction with basement membrane serves to rapidly distinguish growth and differentiation pattern of normal and malignant human breast epithelial cells. Proc Natl Acad Sci USA. 1992;89:9064–9068. doi: 10.1073/pnas.89.19.9064. [DOI] [PMC free article] [PubMed] [Google Scholar]
- Rajan JV, Marquis ST, Gardner HP, Chodosh LA. Developmental expression of Brca2 colocalizes with Brca1 and is associated with proliferation and differentiation in multiple tissues. Dev Biol. 1997;184:385–401. doi: 10.1006/dbio.1997.8526. [DOI] [PubMed] [Google Scholar]
- Rao VN, Shao N, Ahmad M, Reddy ES. Antisense RNA to the putative tumor suppressor gene BRCA1 transforms mouse fibroblasts. Oncogene. 1996;12:523–528. [PubMed] [Google Scholar]
- Scully R, Chen J, Ochs RL, Keegan K, Hoekstra M, Feunteun J, Livingston DM. Dynamic changes of BRCA1 subnuclear localization and phosphorylation state are initiated by DNA damage. Cell. 1997a;90:425–435. doi: 10.1016/s0092-8674(00)80503-6. [DOI] [PubMed] [Google Scholar]
- Scully R, Anderson SF, Chao DM, Wei W, Ye L, Young RA, Livingston DM, Parvin JD. BRCA1 is a component of the RNA polymerase II holoenzyme. Proc Natl Acad Sci USA. 1997b;94:5605–5610. doi: 10.1073/pnas.94.11.5605. [DOI] [PMC free article] [PubMed] [Google Scholar]
- Scully R, Chen J, Plug A, Xiao Y, Weaver D, Feunteun J, Ashley T, Livingston DM. Association of BRCA1 with Rad51 in mitotic and meiotic cells. Cell. 1997c;88:265–275. doi: 10.1016/s0092-8674(00)81847-4. [DOI] [PubMed] [Google Scholar]
- Shao N, Chai YL, Shyam E, Reddy P, Rao VN. Induction of apoptosis by the tumor suppressor protein BRCA1. Oncogene. 1996;13:1–7. [PubMed] [Google Scholar]
- Shinohara A, Ogawa H, Ogawa T. Rad51 protein involved in repair and recombination in S. cerevisiaeis a RecA-like protein. Cell. 1992;69:457–470. doi: 10.1016/0092-8674(92)90447-k. [DOI] [PubMed] [Google Scholar]
- Somasundaram K, Zhang H, Zeng Y-Z, Houvras Y, Peng Y, Zhang H, Wu GS, Licht JD, Weber BL, El-Deiry WS. Arrest of the cell cycle by the tumor-suppressor BRCA1 requires the CDK-inhibitor p21Waf1/CiP1 . Nature. 1997;389:187–190. doi: 10.1038/38291. [DOI] [PubMed] [Google Scholar]
- Soriano JV, Pepper MS, Nakamura T, Orci L, Montesano R. Hepatocyte growth factor stimulates extensive development of branching duct-like structures by cloned mammary gland epithelial cells. J Cell Sci. 1995;108:413–430. doi: 10.1242/jcs.108.2.413. [DOI] [PubMed] [Google Scholar]
- Thai TH, Du F, Tsan JT, Jin Y, Phung A, Spillmann MA, Massa HF, Muller CY, Ashfaq R, Mathis JM, Miller DS, Trask BJ, Baer R, Bowcock AM. Mutations in the Brca1-associated RING domain (BARD1) gene in primary breast, ovarian, and uterine cancers. Hum Mol Genet. 1998;7:195–202. doi: 10.1093/hmg/7.2.195. [DOI] [PubMed] [Google Scholar]
- Weaver VM, Fischer AH, Peterson OW, Bissell MJ. The importance of the microenvironment in breast cancer progression: recapitulation of mammary tumorigenesis using a unique human mammary epithelial cell model and three-dimensional culture assay. Biochem Cell Biol. 1996;74:833–851. doi: 10.1139/o96-089. [DOI] [PMC free article] [PubMed] [Google Scholar]
- Weaver VM, Petersen OW, Wang F, Larabell CA, Briand P, Damsky C, Bissell MJ. Reversion of the malignant phenotype of human breast cells in three-dimensional culture and in vivo by integrin blocking antibodies. J Cell Biol. 1996;137:231–245. doi: 10.1083/jcb.137.1.231. [DOI] [PMC free article] [PubMed] [Google Scholar]
- Wu LC, Wang ZW, Tsan JT, Spillman MA, Phung A, Xu XL, Yang MC, Hwang LY, Bowcock AM, Baer R. Identification of a RING protein that can interact in vivo with the BRCA1 gene product. Nat Genet. 1996;14:430–440. doi: 10.1038/ng1296-430. [DOI] [PubMed] [Google Scholar]
- Zavitz KH, Zipursky SL. Controlling cell proliferation in differentiating tissues: genetic analysis of negative regulators of G1 → S-phase progression. Curr Opin Cell Biol. 1997;9:773–781. doi: 10.1016/s0955-0674(97)80077-4. [DOI] [PubMed] [Google Scholar]
- Zhang H, Somasundaram K, Peng Y, Tian H, Zhang H, Bi D, Weber BL, El-Deiry WS. BRCA1 physically associates with p53 and stimulates its transcriptional activity. Oncogene. 1998;16:1713–1721. doi: 10.1038/sj.onc.1201932. [DOI] [PubMed] [Google Scholar]


