

Abstract
Optical tomography with ultrasound (US) localization utilizes co-registered ultrasound images to guide optical imaging reconstruction. A hand-held probe consisting of a commercial US transducer and near infrared optical imaging sensors of multiple wavelengths was used to simultaneously acquire US images and optical measurements. A novel image scheme was used to map the ultrasound-visible lesions for optical imaging reconstruction. As a result, we overcome the problem of intense light scattering caused by breast tissue and obtained reliable tumor hemoglobin concentration and blood oxygen saturation distributions from a group of patients. These functional parameters are valuable for aiding US diagnosis and assessing chemotherapy response.
Introduction
Optical imaging of large organs is feasible in a spectrum window that exists within tissues in the 700–900 nm near infrared (NIR) region (see Fig. 1), in which photon transport is dominated by scattering rather than absorption. In fact, light transillumination (also called diaphanography) was introduced 70 years ago as a diagnostic tool to locate and identify breast cancers [1]. Unfortunately, transillumination did not achieve sufficient sensitivity and specificity to be used clinically, primarily due to intensive light scattering [2–3]. During the last decade, developments in light propagation theory and modeling as well as advancement of instrumentation in optical sources and detectors, have enabled researchers to apply tomographic principles to localize and quantify light absorption and scattering in the breast [4–20]. If a single optical wavelength is used, optical absorption related to tumor hemoglobin concentration and other normal blood vessels can be measured. If two or more optical wavelengths are used, both oxygenated hemoglobin and deoxygenated hemoglobin concentrations can be measured simultaneously. Tumor hemoglobin concentration is directly related to tumor angiogenesis [4, 12], a key factor required for tumor growth and metastasis [21]. In addition, tumor metabolism and tumor hypoxia, important indicators of tumor response to various forms of therapy [22], can be probed by NIR diffused light as well [11, 19, 20].
Fig.1.
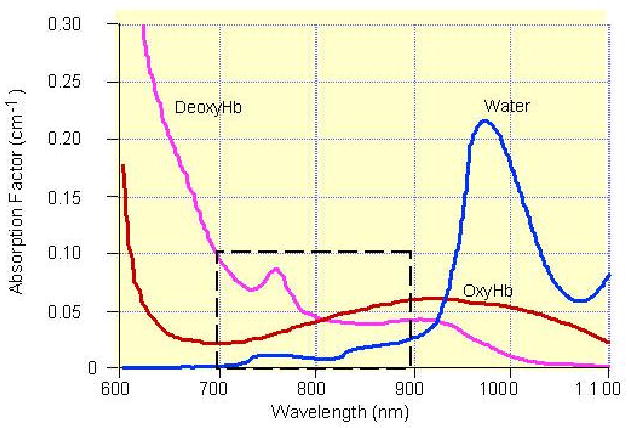
In vitro absorption spectra of hemoglobin and water, showing a spectral window in tissue in the NIR. The window is brought about by first a decrease in blood (oxy- and deoxyhemoglobin) absorption and then an increase in water absorption with increasing wavelength.
However, optical tomography alone suffers from low spatial resolution and location uncertainty because of the intense light scattering in tissue. The image reconstruction results depend on many parameters, such as the system signal-to-noise ratio, measurement geometry, regularization schemes used in inversion, etc [23]. More recently, many research groups have investigated the use of a priori lesion structure information provided by other imaging modalities, such as ultrasound (US) [24–32], MRI [8, 11,33–34], and X-ray mammography [35] to improve the localization of optical tomography. A flexible light guide using optical fibers makes optical imaging compatible with many other imaging modalities and allows for simultaneous imaging under identical geometric conditions. Furthermore, the lesion structure information provided by other modalities can be used to assist optical imaging reconstruction and therefore to reduce the location uncertainty and to improve the quantification accuracy of light.
US is frequently used as an adjunct tool to mammography in differentiating simple cysts from solid lesions and also plays an important role in guiding interventional procedures such as needle aspiration, core-needle biopsy, and prebiopsy needle localization [36–37]. However, ultrasound features that occur in solid breast masses are not reliable enough to determine whether invasive evaluation is needed or non-invasive follow-up is indicated [36]. The lack of specificity of ultrasound has prompted radiologists to recommend biopsies on most solid nodules [38]. We have developed a novel technique, which combines optical tomography and US to improve optical reconstruction accuracy and aid US diagnosis [27–28, 30–32]. Furthermore, optical tomography with US localization has additional benefits to map tumor vascularity and tumor hypoxia when studying larger tumors already diagnosed by US. These indices can be followed before and during theraputic interventions. It has been shown that tumor hypoxia is related to the growth rate and chemotheraputic responsiveness of tumors [41]. The ability to demonstrate and follow these parameters before and during therapy non-invasively could prove invaluable in choosing tailored treatments especially in the era of new drugs targeting angiogenesis.
Our unique approach employs a commercial ultrasound transducer and NIR optical imaging sensors mounted on a hand-held probe as shown in Fig. 2. The co-registered ultrasound is used for lesion localization and optical sensors are used for imaging tumor angiogenesis and tumor hypoxia. Initial clinical results have shown that early stage invasive cancers may be distinguished by an average of twofold greater total hemoglobin concentration compared to fibroadenomas and other benign lesions [30,32]. Preliminary results of advanced cancers have shown that the hemoglobin distribution is highly distorted and heterogeneous. The distorted distributions correlate with histological microvessel density counts and may be used to assess chemotherapy response [31].
Fig.2.
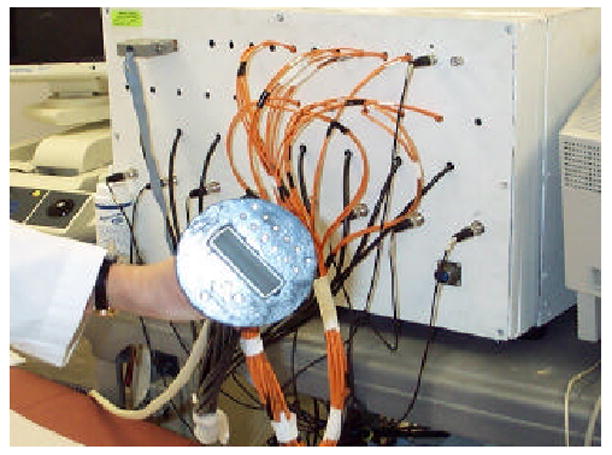
Prototype of our hand-held combined probe and a frequency domain NIR optical imager. The diameter of the combined probe is 10 cm and a commercial ultrasound probe is located at the center.
2. Hybrid Imaging Technology
How did NIR/US work synergistically?
Photon density waves launched from a source and detected by a detector travel a “banana” path, which can be visualized in Fig. 3. In the figure, photons at each source location were injected into the breast tissue. Each photon propagated in the medium, being absorbed or scattered. The scattered photons that reach the detectors carry the background tissue and the lesion optical absorption and scattering information and can be used for tomographic reconstruction to map out the lesion and background optical properties. For each source-detector pair, the high sensitivity region in both spatial and depth dimensions is distributed along the “banana” path. With many source and detector pairs of different separations shown in the figure, the photon density waves can probe the medium underneath. Ultrasound is a coherent imaging modality and the sound waves propagate into the medium from the transducer located on top of the breast along a straight path and reflected waves or echoes from tissue underneath are used for forming B-scan images. Therefore, sensors of two modalities probe the medium underneath although the sensor locations are offset on the probe. Thus, the two modalities have unique synergy not only in providing complementary structure and function information of the lesion but also in optimization of sensor locations.
Fig. 3.
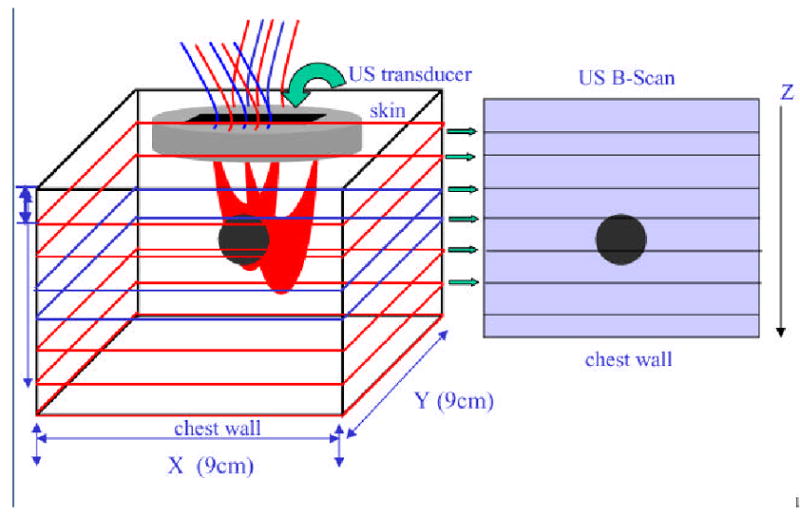
Illustration demonstrating photon propagation paths launched from optical sources and detected by optical detectors.
The technical aspects of our two prototype NIR imagers have been described in detail previously [28–29]. The prototype systems have either 12 dual-wavelength (780nm and 830nm) laser diode sources or 9 tri-wavelength (690, 780nm, 830nm) sources and 8 parallel Photo Multiplier Tubes (PMT) detectors or 10 parallel PMT detectors. The outputs of the laser diodes are amplitude modulated at radio frequencies and sequentially selected to illuminate the medium. On the reception, PMTs are employed to detect diffusely reflected light from the scattering media. The detected signals are acquired into the computer simultaneously, sampled, and used to reconstruct tomographic images. The entire data acquisition takes less than 15 seconds, which is fast enough to avoid motion artifacts from patients.
US-guided optical imaging
Measurements obtained from all optical source-detector pairs in the planar array are used to reconstruct optical absorption distributions at two wavelengths of 780 nm and 830 nm or three wavelengths of 690nm, 780nm and 830nm , where rvj is the voxel element within the sample. We have introduced a novel dual-mesh optical imaging reconstruction algorithm to overcome the light scattering problem [27,39]. Briefly, the optical tomographic reconstruction takes advantages of US localization of lesions and segments the imaging volume into a finer grid in US identified lesion region and a coarser grid in non-lesion regions (see Fig. 4). To account for possible larger angiogenesis extension of ultrasound-identified lesions, we have used a much larger region of interest (ROI) for finer grid lesion mapping. Therefore, the exact lesion shape is not important and an elliptical ROI is used in imaging reconstruction. By choosing a finer grid for lesion and a coarse grid for background tissue, we can maintain the total number of voxels with unknown optical absorption on the same scale of the total measurements. As a result, the inverse tomographic mapping is well-defined. In addition, since the lesion absorption coefficient is higher than that of background tissue, in general, the total absorption of the lesion over a smaller voxel is of the same scale as the total absorption of the background over a bigger voxel. Therefore, the inverse tomographic mapping is further improved.
Fig.4.
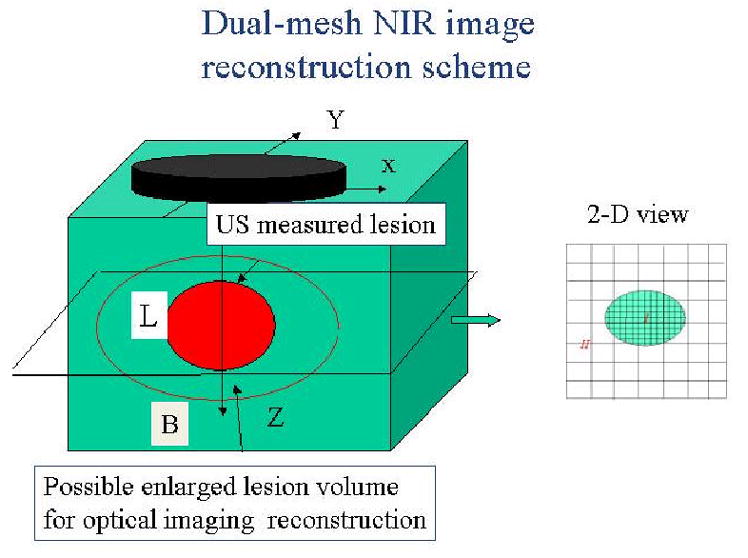
Illustration of the dual-mesh optical imaging reconstruction with the assistance of ultrasound lesion mapping. The entire imaging volume is segmented into lesion (L) and background regions (B). The finer imaging grid is used for the lesion region and the coarse grid is used for the background. To account for possible larger angiogenesis extension of the ultrasound-identified lesions, we have used a much larger region of interest (ROI) than the US-identified one for finer grid lesion mapping. In general, an elliptical ROI is used in optical imaging reconstruction.
Since the major chromophores are deoxygenated (deoxyHb) and oxygenated (oxyHb) hemoglobin in the wavelength range studied, we can compute total hemoglobin concentration totalHb(rvj) = deoxyHb(rvj) + oxyHb(rvj) and blood oxygenation saturation using the following equations:
| (1) |
and
| (2) |
where ε s are extinction coefficients given in Ref. [40] and .
Probing regions of the banana-shaped diffusive photons depend on source-detector separations and measurement geometry. For a semi-infinite geometry, the probing regions extend further into the medium when source-detector separation increases. This is why we have multiple source-detector pairs of various separations to detect targets at variable depths from 0.5 cm to 4 cm. Of course, it is hard to achieve uniform sensitivity in the entire region of interest. For example, a superficial target (~1cm deep) would cause very strong perturbations when it is close to a source or a detector, but will result in much weaker signals when it is located deeper. Normalization of scattering photon density waves with respect to the incident waves makes it possible for reconstruction algorithms to handle the huge dynamic range of signals and to detect a target as deep as 4 cm.
3. Initial Clinical Results
Pilot clinical trials using the combined approach have been conducted at University of Connecticut Health Center and Hartford Hospital. To date, more than 100 patients have been enrolled and published results can be found in Refs [30, 32]. An example obtained from an early stage invasive ductal carcinoma is shown in Fig. 5 [30]. The ultrasound showed a nodular mass with internal echoes and the lesion was considered suspicious (see Fig. 5(a)). The estimated lesion diameter measured from ultrasound image was 8 mm. An ultrasound guided core needle biopsy revealed intraductal and infiltrating ductal carcinoma (nuclear grade II, histological grade III). The total hemoglobin concentration distribution computed from optical absorption maps at 780nm and 830nm wavelengths are shown in Fig. 5(b). In (d) the first slice is 0.7 cm deep into the breast tissue from the skin surface and the last slice is closer to the chest wall. The spacing of the slices is 0.5 cm. The horizontal and vertical axes of each slice are spatial x and y optical probe dimensions of 9 cm in size. The lesion is well resolved in slice #5, and the measured maximum total hemoglobin concentration for lesion is 122 μmol/liter, the average measured within full width and half maximum (FWHM) is 91 μmol/liter and the measured average background hemoglobin concentration is 14 μmol/liter.
Fig.5.
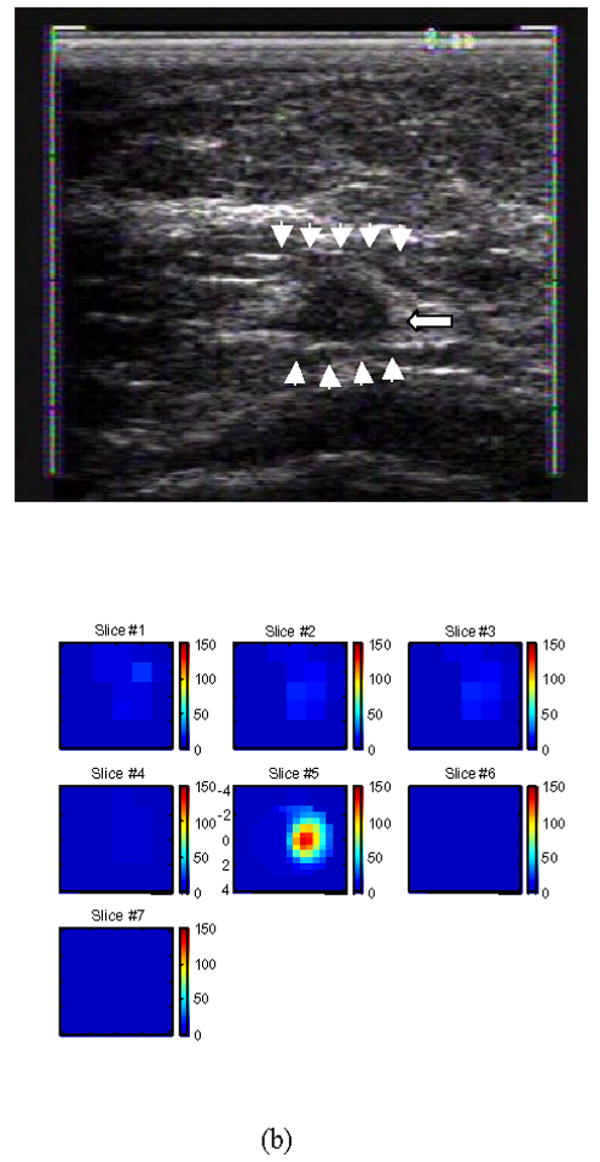
(a) shows a gray scale ultrasound image of a non-palpable lesion of a 55-year-old woman. The lesion measuring 8 mm in diameter pointed by the arrow was located at the 4 o’clock position of the right breast. Ultrasound showed a nodular mass with internal echoes and the lesion was considered suspicious. (b) is the total hemoglobin concentration distribution computed from the optical absorption maps obtained at 780nm and 830 nm wavelengths (no shown). For each slice n (b), x and y axes are spatial probe dimensions of 9 cm by 9 cm. The slices beginning from left to right correspond to hemoglobin maps from 0.7 cm underneath skin surface to chest wall in 0.5 cm spacing. [Published with permission of Neoplasia; Ref. 30].
Figure 6(a) is an example of a suspicious lesion seen by US. The lesion was measured 8.4 mm × 6 mm located at 4–5 o’clock of the right breast of a 38-year old woman. The biopsy result revealed that the lesion was a fibroadenoma. Figure 6(b) is the total hemoglobin concentration map computed from absorption maps of 780nm and 830nm (not shown), and no isolated mass with high blood content is seen. The maximum and average hemoglobin concentration are 27.4, and 18.8 μ mol/liter, respectively. The vertical scale is the total hemoglobin concentration in μ mol ranging from 0 to 100 μ mol/liter.
Fig.6.
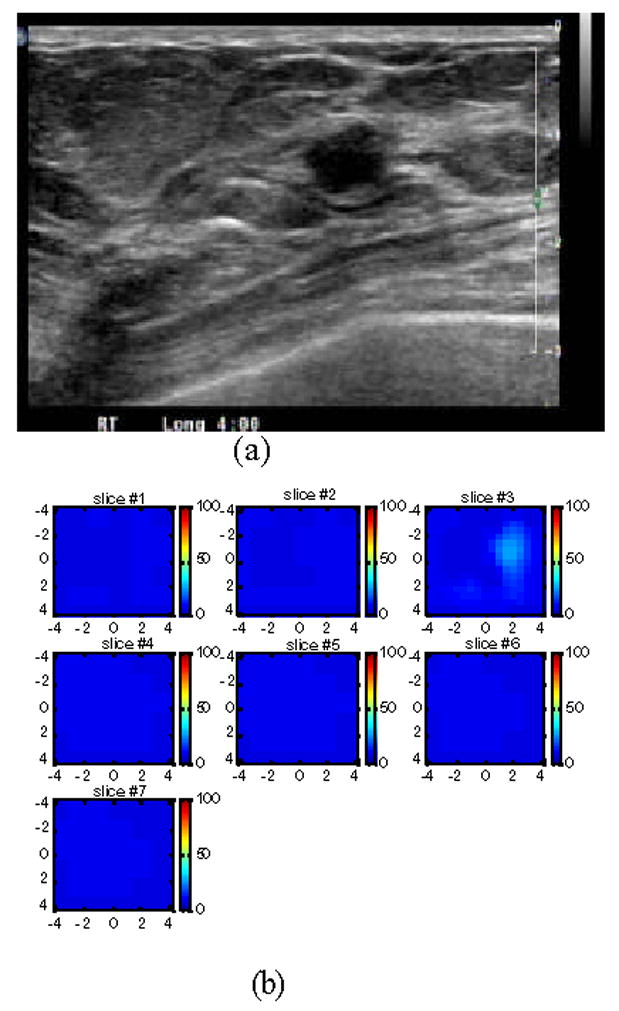
(a) US image of a suspicious solid lesion measured 8.4 mm × 6 mm located at 4–5 o’clock of the right breast of a 38-year old woman. The biopsy result revealed that the lesion was a fibroademona with no evidence of malignancy. (b) The total hemoglobin concentration map computed from absorption maps of 780nm and 830nm (not shown). No isolated mass with high blood content is seen. The vertical scale is the total hemoglobin concentration in μ mol ranging from 0 to 150 μ mol/liter.
The initial patient population obtained from both University of Connecticut Health Center and Hartford Hospital consisted of malignant cases (n=10), fibroadenomas (n=32), fibrocystic changes (n=17), fibrosis (n=9), other benign solid lesions (n=8), complex cysts (n=21), and combined fibroadenoma and fibrocystic changes with neoplasia/carcinoma in situ and hyperplasia (n=3) [30,32]. The mean maximum total hemoglobin concentration and the mean average hemoglobin values were calculated for each group. No significant difference was found among benign groups but a more than two-fold higher average total hemoglobin concentration was found in malignant (mean maximum 121 μ mol/liter (± 23.8), mean average 88 μ mol/liter (± 21.7) measured within FWHM) versus benign groups (mean maximum 57 μ mol/liter (± 23.7), mean average 40 μ mol/liter (± 16.6) measured within FWHM). Both maximum and average of total hemoglobin level were statistically significantly higher in the malignant group than in the benign group (P<0.001).
The limited cases of combined fibroadenoma and fibrocystic changes with neoplasia/carcinoma in situ and hyperplasia (n=3) suggest that optical tomography may not be sensitive to high-risk hyperplasia or early stage mixed benign changes and non-invasive neoplasia/carcinoma in situ because tumor neovascularization has not been developed. This result is consistent with magnetic resonance imaging (MRI) findings on the low detection sensitivity of carcinoma in situ. However, our cases are limited and optical tomography may be useful in identifying more aggressive type of carcinoma in situ that may have early neovasculature changes.
An example of assessing chemotherapy response was obtained from a 53 year-old patient who had a history of right breast cancer. A large palpable mass occurred at the 6 clock position of her right breast in the previous surgical scar area. US-guided core biopsy revealed an invasive ductal carcinoma of nuclear grade II, histological grade II and high mitotic activity. She was given four cycles of doxorubicin and cyclophosphamide (AC) followed by four cycles of combination of paclitaxel (Taxol) and Gemcitabine during her neoadjuvant chemotherapy. We imaged her before US-guided core biopsy (Fig 7(a), after 2 cycles (Fig. 7(b)) and 4 cycles (Fig. 7(c)), and before her surgery (Fig. 7(d)). Figure 7(a)–(d) are corresponding ultrasound images; (a1)–(d1) are corresponding hemoglobin distribution maps; (a2)–(d2) are corresponding blood oxygen saturation maps. Since the recurrent cancer was in the scar area, US images showed extensive scar tissues and calcifications with no obvious reduction in size throughout the chemotherapy treatment (see Fig. 7 (a)–(d)). However, the hemoglobin distribution maps showed highly heterogeneous rim enhancement patterns initially (a1)–(b1) and reduction in spatial vasculature distribution (c1–d1) as well as the quantitative values (d1). The measured maximum and average (within FWHM) hemoglobin levels are 126.1 124.0, 129.3 and 92.7 μ mol/liter, and 89.6, 90.1, 92.8, 67.6 μ mol/liter from (a1) to (d1), respectively. Contrast-enhanced MRI images were acquired before surgery and showed a residual tumor which was enhanced by contrast agent (Fig. 8). Blood oxygen saturation revealed that the top regions of the cancer were more deoxygenated initially (a2)–(b2) (blue color compared with deep yellow background) and were close to normal background tissue level at the end of the treatment (d2). Surgical pathology revealed clustered foci of residual invasive carcinoma with larger foci measuring 0.5 cm.
Fig.7.

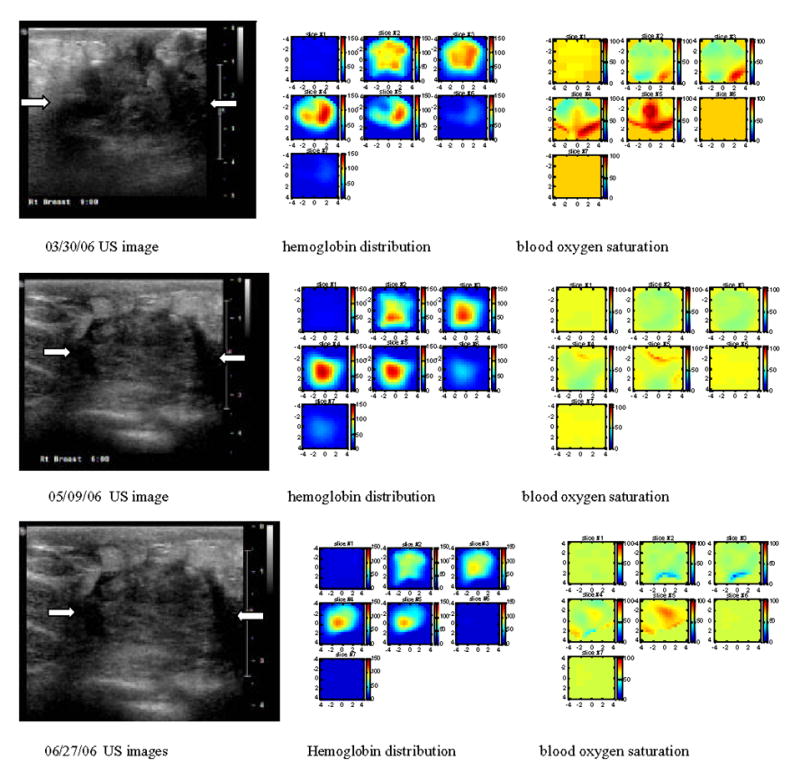
Corresponding US images acquired at the beginning (a), after 2 cycles (b) and 4 cycles (c) of chemotherapy, and before surgery (d). The white arrows mark the approximate left and right margins of the tumor. (a1), (b1), (c1) and (d1) are corresponding NIR hemoglobin concentrations, while (a2), (b2), (c2) and (d2) are corresponding blood oxygen saturation maps. For each hemoglobin and oxygen saturation map of (a1)–(d1) and (a2)–(d2), each small slice in the map is the x–y image of 9 cm by 9 cm. The first slice is obtained at 0.5-cm depth from the skin surface and the last slice #7 is 3.5 cm deep toward the chest wall. The slices in each hemoglobin and oxygen saturation map are numbered from left to right and top to bottom. Hemoglobin maps showed rim-enhancement initially and reduced in spatial dimension and also quantitative level at the end of the treatment.
Fig. 8.
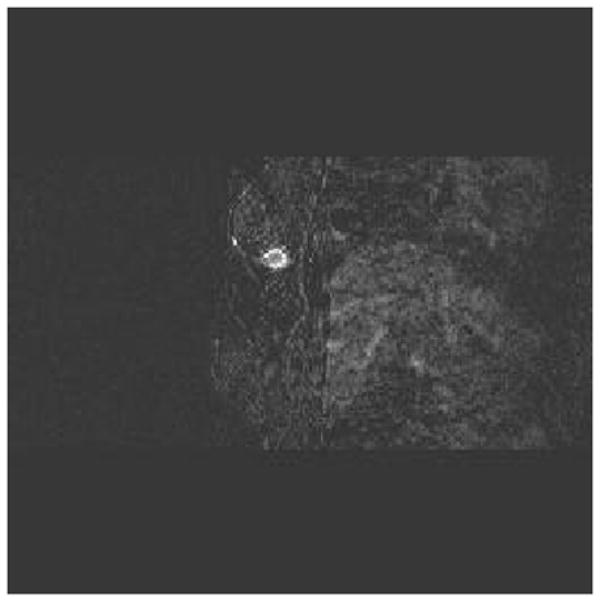
Contrast-enhanced MRI before surgery showing residual tumor mass.
4. Discussions
Since conventional ultrasound is used in pulse-echo reflection geometry, it is desirable to acquire optical measurements with the same geometry. Compared with transmission geometry or ring geometry where the light sources and detectors are deployed on a pair of parallel plates or a ring, the reflection geometry has the advantage of probing reduced breast tissue thickness because patients are scanned in the supine position. Consequently, lesions closer to the chest wall can be imaged. In general, the breast tissue thickness has been reduced to less than 3 to 4 cm. However, when the chest wall is present within 1.5 cm or less from the skin surface, the semi-infinite geometry is not a valid assumption for optical measurements and the chest wall underlying the breast tissue affects the optical measurements obtained from distant source-detector pairs. Since the depth of chest wall and average breast tissue absorption and scattering coefficients vary from patient to patient, it is difficult to predict the exact distant point to eliminate the longer source-detector pairs. As a consequence, the data processing and image reconstruction must be done off-line for each individual patient by examining the data and removing distant measurements. In general, the symmetric location of the contralateral normal breast is chosen as the reference site to minimize the effect of the chest wall. Currently, we are quantitatively evaluating image reconstruction errors caused by the chest-wall located at a shallower depth using Monte Carlo simulations and a two-layer analytical solution [42–43]. With the help of simulation and modeling, we expect to improve the accuracy of image reconstruction and speed of data processing.
Our initial results on early-stage breast cancer diagnosis are encouraging. We anticipate a larger, prospective clinical trial to validate these results. US is frequently used as an adjunct tool to mammography in differentiating simple cysts from solid lesions and also plays an important role in guiding interventional procedures such as needle biopsy. Our technique has a potential role in characterizing functional changes of US-visible lesions and therefore in reducing benign biopsies. Since US-visible lesions are needed to map out target and background regions for optical imaging reconstruction, our technique is limited to this patient population and is not suitable for screening purposes.
Our initial clinical results obtained from a small number of chemotherapy patients have indicated that optical tomography with US localization has additional benefits to map tumor vascularity and tumor hypoxia when studying larger tumors. It has been shown that tumor hypoxia is related to the growth rate and chemotheraputic responsiveness of tumors [26]. The ability to demonstrate and follow these parameters before and during therapy non-invasively could prove invaluable in choosing tailored treatments. Some of the other newer imaging techniques do not have this capability. These techniques utilized clinically and experimentally include 15O-water contrast-enhanced positron emission tomography [44], dynamic contrast-enhanced MRI [45–46], 99m Tc-sestamibi contrast-enhanced single-photon emission tomography [47–48], and Doppler sonography [49]. The first three techniques require rather expensive systems and may only be used at the beginning and the end of chemotherapy leaving the entire treatment period completely unmonitored. The Doppler sonography is limited to imaging large blood vessels. Compared with Doppler sonography that visualizes larger blood vessels, optical tomography images tumor microvessel density, which is directly related to tumor angiogenesis distributions. Furthermore, near-infrared systems are cost- effective, portable and can be easily coupled to clinical ultrasound systems for repeated imaging. While our study is confined to patients with breast cancer, the principles could be applied to other solid tumors. A variety of imaging modalities could be used to co-register the light data that is obtained. Thus we feel that there is an enormous potential to use light data to identify and follow the course of treatment for patients with cancers in general. This modality will also allow for the acquisition of real time tumor specific insights.
Acknowledgments
Many people have collaborated in this research project. Drs. Poornima Hegde, Mark Kane, Bipin Jagjivan, Kristin Zarfos of University of Connecticut Health Center and Drs. Edward B Cronin, Allen A Currier, Hugh A Vine of Hartford Hospital are greatly acknowledged for their contributions in clinical studies. Many people at the Optical and Ultrasound Imaging Laboratory of the ECE Department of the University of Connecticut have contributed to theory and modeling, instrumentation and clinical data acquisition. Graduate student Chen Xu is specially acknowledged for her help on data acquisition.
The following funding agents are thanked for their funding support: the National Institute of Health (R01EB002136), the Donaghue Foundation, the ARMY Medical Research and Materiel Command (DAMD17-00-1-0217) and the State of Connecticut.
Footnotes
Publisher's Disclaimer: This is a PDF file of an unedited manuscript that has been accepted for publication. As a service to our customers we are providing this early version of the manuscript. The manuscript will undergo copyediting, typesetting, and review of the resulting proof before it is published in its final citable form. Please note that during the production process errors may be discovered which could affect the content, and all legal disclaimers that apply to the journal pertain.
References
- 1.Cutler M. Transillumination as an aid in the diagnosis of breast lesions. Surg Genecol Obstet. 1929;48:721–729. [Google Scholar]
- 2.Lafreniere R, Ashkar FS, Ketcham AS. Infrared light scanning of the breast. Am Surg. 1986;52:123–128. [PubMed] [Google Scholar]
- 3.Drexler B, Davis JL, Schofield G. Diaphanography in the diagnosis of breast cancer. Radiology. 1985;157:41–44. doi: 10.1148/radiology.157.1.4034975. [DOI] [PubMed] [Google Scholar]
- 4.Chance B. Near-infrared images using continuous, phase-modulated, and pulsed light with quantitation of blood and blood oxygenation. Ann NY Acad Sci. 1998;838:29–45. doi: 10.1111/j.1749-6632.1998.tb08185.x. [DOI] [PubMed] [Google Scholar]
- 5.Yodh A, Chance B. Spectroscopy and imaging with diffusing light. Phys Today. 1995;48:34–40. [Google Scholar]
- 6.Tromberg B, Shah N, Lanning R, Cerussi A, Espinoza J, Pham T, Svaasand L, Butler J. Non-Invasive in vivo characterization of breast tumors using photon migration spectroscopy. Neoplasia. 2000;2(12):26–40. doi: 10.1038/sj.neo.7900082. [DOI] [PMC free article] [PubMed] [Google Scholar]
- 7.Alfano R, Demos S, Gayen SK. Advances in optical imaging of biomedical media. Ann NY Acad Sci. 1997;820:248–270. doi: 10.1111/j.1749-6632.1997.tb46200.x. [DOI] [PubMed] [Google Scholar]
- 8.Barbour RL, Graber HL, Chang Jenghwa, Barbour S-LS, Koo PC, Aronson R. Computational Science & Engineering. 4. Vol. 2. IEEE; Winter. 1995. pp. 63–77. [see also Computing in Science & Engineering] [Google Scholar]
- 9.Hoogenraad JH, van der Mark MB, Colak SB, ‘t Hooft GW, van der Linden ES. First Results from the Philips optical mammoscope, In: Photon Propagation of tissues III. In: Benaron DA, Chance B, Ferrari M, editors. SPIE: The International Society for Optical Engineering. 1997. pp. 3194pp. 184–190. [Google Scholar]
- 10.Franceschini MA, Moesta KT, Fantini S, Gaida G, Gratton E, Jess H, Seeber M, Schlag PM, Kashke M. Frequency-domain techniques enhance optical mammography: initial clinical results. Proc of Nat Ac of Sci. 1997;94:6468–6473. doi: 10.1073/pnas.94.12.6468. [DOI] [PMC free article] [PubMed] [Google Scholar]
- 11.Ntziachristos V, Yodh A, Schnall M, Chance B. Concurrent MRI and diffuse optical tomography of breast after indocyanine green enhancement. Proc of Nat Ac of Sci. 2000;97(6):2267–2772. doi: 10.1073/pnas.040570597. [DOI] [PMC free article] [PubMed] [Google Scholar]
- 12.Pogue B, Poplack SP, McBride TO, Wells WA, Osterman K, Osterberg U, Paulsen KD. Quantitative hemoglobin tomography with diffuse near-infrared spectroscopy: pilot results in the breast. Radiology. 2001;218:261–266. doi: 10.1148/radiology.218.1.r01ja51261. [DOI] [PubMed] [Google Scholar]
- 13.Jiang H, Xu Y, Iftimia N, Eggert J, Klove K, Baron L, Fajardo L. Three-dimensional optical tomographic imaging of breast in a human subject. IEEE Trans on Medical Imaging. 2001;20(12):1334–1340. doi: 10.1109/42.974928. [DOI] [PubMed] [Google Scholar]
- 14.Jiang H, Iftimia N, Xu Y, Eggert J, Fajardo L, Klove K. Near-infrared optical imaging of the breast with model-based reconstruction. Academic Radiology. 2002;9(2):186–194. doi: 10.1016/s1076-6332(03)80169-1. [DOI] [PubMed] [Google Scholar]
- 15.Culver JP, Choe R, Holboke MJ, Zubkov L, Durduran T, Slemp A, Ntziachristos V, Chance B, Yodh AG. Three-dimensional diffuse optical tomography in the parallel plane transmission geometry: Evaluation of a hybrid frequency domain/continuous wave clinical system for breast imaging. Med Phys. 2003;30(2):235–247. doi: 10.1118/1.1534109. [DOI] [PubMed] [Google Scholar]
- 16.Grosenick D, Moesta KT, Wabnitz H, Mucke J, Stroszczynski C, Macdonald R, Schlg P, Rinneberg H. Time-domain optical mammography: initial clinical results on detection and characterization of breast tumors. Appl Opt. 2003;42(16):3170–3186. doi: 10.1364/ao.42.003170. [DOI] [PubMed] [Google Scholar]
- 17.Dehghani H, Pogue B, Poplack SP, Paulsen KD. Multiwavelength three-dimensional near-infrared tomography of the breast: initial simulation, phantom, and clinical results. Appl Opt. 2003;42(1):135–145. doi: 10.1364/ao.42.000135. [DOI] [PubMed] [Google Scholar]
- 18.Torricelli A, Spinelli L, Pifferi A, Taroni P, Cubeddu R, Danesini GM. Use of a nonlinear perturbation approach for in vivo breast lesion characterization by multiwavelength time-resolved optical mammography. Optics Express. 2003;11(8):853–867. doi: 10.1364/oe.11.000853. [DOI] [PubMed] [Google Scholar]
- 19.Heffer E, Pera V, Schutz O, Siebold H, Fantini S. Near-infrared imaging of the human breast: complementing hemoglobin concentration maps with oxygenation images. Journal of Biomedical Optics. 2004;9(6):1152–1160. doi: 10.1117/1.1805552. [DOI] [PubMed] [Google Scholar]
- 20.Jakubowski DB, Cerussi AE, Bevilacqua F, Shah N, Hsiang D, Butler J, Tromberg B. Monitoring neoadjuvant chemotherapy in breast cancer using quantitative diffuse optical spectroscopy: a case study. Journal of Biomedical Optics. 2004;9(1):230–238. doi: 10.1117/1.1629681. [DOI] [PubMed] [Google Scholar]
- 21.Folkman J, Watson K, Ingber D, Hanahan D. Induction of angiogenesis during the transition from hyperplasia to neoplasia. Nature. 1989;339:58–61. doi: 10.1038/339058a0. [DOI] [PubMed] [Google Scholar]
- 22.Vaupel P, Kallinowski F, Okunieff P. Blood flow, oxygen and nutrient supply, and metabolic microenvironment of human tumors: a review. Cancer Research. 1989;49:6449–6465. [PubMed] [Google Scholar]
- 23.Arridge SR. Optical tomography in medical imaging. Inverse Problems. 1999;15:R41–R93. [Google Scholar]
- 24.Zhu Q, Durduran T, Holboke M, Ntziachristos V, Yodh A. Imager that combines near infrared diffusive light and ultrasound. Optics Letters. 1999;24(15):1050–1052. doi: 10.1364/ol.24.001050. [DOI] [PubMed] [Google Scholar]
- 25.Holboke M, Tromberg B, Li X, Shah N, Fishkin J, Kidney D, Butler J, Chance B, Yodh A. Three-dimentional diffuse optical mammography with ultrasound localization in human subject. Journal of Biomedical Optics. 2000;5(2):237–247. doi: 10.1117/1.429992. [DOI] [PubMed] [Google Scholar]
- 26.Zhu Q, Conant E, Chance B. Optical imaging as an adjunct to sonograph in differentiating benign from malignant breast lesions. Journal of Biomedical Optics. 2000;5(2):229–236. doi: 10.1117/1.429991. [DOI] [PubMed] [Google Scholar]
- 27.Zhu Q, Chen NG, Kurtzman HS. Imaging tumor angiogenesis by the use of combined near infrared diffusive light and ultrasound. Optics Letters. 2003;28(5):337–339. doi: 10.1364/ol.28.000337. [DOI] [PMC free article] [PubMed] [Google Scholar]
- 28.Chen NG, Guo PY, Yan SK, Piao DQ, Zhu Q. Simultaneous near infrared diffusive light and ultrasound imaging. Appl Opt. 2001;40(34):6367–6380. doi: 10.1364/ao.40.006367. [DOI] [PMC free article] [PubMed] [Google Scholar]
- 29.Zhu Q, Xu C, Guo PY, Aguirre A, Yuan B, Huang F, Castilo D, Gamelin J, Tannenbaum S, Kane M, Hegde P, Kurtzman S. Optimal probing of optical contrast of breast lesions of different size located at different depths by US localization. Technology in Cancer Research & Treatment. 2006;5(4):365–380. doi: 10.1177/153303460600500408. [DOI] [PMC free article] [PubMed] [Google Scholar]
- 30.Zhu Q, Huang MM, Chen NG, Zarfos K, Jagjivan B, Kane M, Hegde P, Kurtzman SH. Ultrasound-guided optical tomographic imaging of malignant and benign breast lesions. Neoplasia. 2003;5(5):379–388. doi: 10.1016/s1476-5586(03)80040-4. [DOI] [PMC free article] [PubMed] [Google Scholar]
- 31.Zhu Q, Kurtzman SH, Hegde P, Tannenbaum S, Kane M, Huang MM, Chen NG, Jagjivan B, Zarfos K. Utilizing optical tomography with ultrasound localization to image heterogeneous hemoglobin distribution in large breast cancers. Neoplasia. 2005;7(3):263–270. doi: 10.1593/neo.04526. [DOI] [PMC free article] [PubMed] [Google Scholar]
- 32.Zhu Q, Cronin EB, Currier AA, Vine SH, Huang MM, Chen NG, Xu C. Benign versus Malignant Breast Masses: Optical Differentiation using US to Guide Optical Imaging Reconstruction. Radiology. 2005 Oct;237:57–66. doi: 10.1148/radiol.2371041236. [DOI] [PMC free article] [PubMed] [Google Scholar]
- 33.Pei Y, Lin F, Barbour R. Modeling of sensitivity and resolution to an included object in homogeneous scattering media and in MRI-derived breast maps. Optics Express. 1999;5(10):203–219. doi: 10.1364/oe.5.000203. [DOI] [PubMed] [Google Scholar]
- 34.Ntziachristos V, Yodh A, Schnall M, Chance B. MRI-Guided diffuse optical spectroscopy of malignant and benign breast lesions. Neoplasia. 2002;4(4):347–354. doi: 10.1038/sj.neo.7900244. [DOI] [PMC free article] [PubMed] [Google Scholar]
- 35.Li A, Miller E, Kilmer M, Brukilacchio T, Chaves T, Scott J, Zhang Q, Wu T, Chorlton M, Moore R, Kopans D, Boas D. Tomographic optical breast imaging guided by three-dimensional mammography. Appl Opt. 2003;42(25):5181–5190. doi: 10.1364/ao.42.005181. [DOI] [PubMed] [Google Scholar]
- 36.Jackson VP. The current role of ultrasonography in breast imaging. Radiol Clin North Am. 1995;33:1161–1170. [PubMed] [Google Scholar]
- 37.Fornage BD, Coan JD, David CL. Ultrasound-guided needle biopsy of the breast and other interventional procedures. Radiol Clin North Am. 1992;30:167–185. [PubMed] [Google Scholar]
- 38.Rahbar G, Sie AC, Hansen GC, Prince JS, Melany ML, Reynolds HE, Jackson VP, Sayre JW, Bassett LW. Benign versus Malignant Solid Breast Masses: US Differentiation. Radiology. 1999;213:889–894. doi: 10.1148/radiology.213.3.r99dc20889. [DOI] [PubMed] [Google Scholar]
- 39.Huang MM, Zhu Q. A Dual-mesh optical tomography reconstruction method with depth correction using a priori ultrasound information. Appl Opt. 2004;43(8):1654–1662. doi: 10.1364/ao.43.001654. [DOI] [PMC free article] [PubMed] [Google Scholar]
- 40.Cope M. PhD Dissertation. University of College London: 1991. [Google Scholar]
- 41.Vaupel P, Schlenger K, Knoop C, Hockel M. Oxygenation of human tumors: evaluation of tissue oxygen distribution in breast cancers by computerized O2 tension measurements. Cancer Research. 1991;51:3316–3322. [PubMed] [Google Scholar]
- 42.Xu C, Zhu Q. Estimation of chest-wall induced diffused wave distortion with the assistance of ultrasound. Appl Opt. 2005;44(20):4255–4264. doi: 10.1364/ao.44.004255. [DOI] [PMC free article] [PubMed] [Google Scholar]
- 43.Das M, Xu C, Zhu Q. Analytical solution for light propagation in a two-layer tissue structure with a tilted interface for breast imaging. Applied Optics. 2006 July 10;45(20):5027–5036. doi: 10.1364/ao.45.005027. [DOI] [PMC free article] [PubMed] [Google Scholar]
- 44.Wilson CBJH, Lammertsma AA, McKenzie CG, Sikora K, Jones T. Measurements of blood flow and exchanging water space in breast tumors using positron emission tomography: a rapid and non-invasive dynamic method. Cancer Res. 1992;52:1592–1597. [PubMed] [Google Scholar]
- 45.Abraham DC, Jones RC, Jones SE, et al. Evaluation of neoadjuvant chemotherapeutic response of locally advanced breast cancer by magnetic resonance imaging. Cancer. 1996;78:91–100. doi: 10.1002/(SICI)1097-0142(19960701)78:1<91::AID-CNCR14>3.0.CO;2-2. [DOI] [PubMed] [Google Scholar]
- 46.Gilles R, Guinebretiere JM, Shapeero LG, Lesnik A, Contesso G, Sarrazin D. Assessment of breast cancer recurrence with contrast-enhanced subtraction MR imaging: preliminary results in 26 patients. Radiology. 1993;188:473–478. doi: 10.1148/radiology.188.2.8327700. [DOI] [PubMed] [Google Scholar]
- 47.Maini CL, Tofani A, Sciuto R, et al. Technetium-99m-MIBI scintigraphy in the assessment of neoadjuvant chemotherapy in breast carcinoma. J Nucl Med. 1997;38:1546–1550. [PubMed] [Google Scholar]
- 48.Mankoff DA, Dunnwald LK, Gralow JR, Ellis GK, Drucker MJ, Livingston RB. Monitoring the response of patients with locally advanced breast carcinoma to neoadjuvant chemotherapy using [technetium-99m]-sestamibi scintimammography. Cancer. 1999;85:2410–2423. [PubMed] [Google Scholar]
- 49.Kedar RP, Cosgrove DO, Smith IE, Mansi JL, Bamber JC. Breast carcinoma: measurement of tumor response to primary medical therapy with color flow Doppler imaging. Radiology. 1994;190:825–830. doi: 10.1148/radiology.190.3.8115634. [DOI] [PubMed] [Google Scholar]